| Param | Original file | Final file |
|---|---|---|
| Filename | modeM0/AS1C06_010T01_9000005800_42386cztM0_level2.fits | modeM0/AS1C06_010T01_9000005800_42386cztM0_level2_quad_clean.evt |
| Size (bytes) | 349,214,400 | 89,052,480 |
| Size | 333.0 MB | 84.9 MB |
| Events in quadrant A | 2,865,094 | 620,241 |
| Events in quadrant B | 2,911,677 | 605,989 |
| Events in quadrant C | 2,671,092 | 588,735 |
| Events in quadrant D | 4,079,784 | 522,551 |
| Mode M9 | |||
|---|---|---|---|
| Quadrant | BADHDUFLAG | Total packets | Discarded packets |
| A | 0 | 25 | 0 |
| B | 0 | 26 | 0 |
| C | 0 | 26 | 0 |
| D | 0 | 26 | 0 |
| Mode M0 | |||
|---|---|---|---|
| Quadrant | BADHDUFLAG | Total packets | Discarded packets |
| A | 0 | 11407 | 2 |
| B | 0 | 12064 | 2 |
| C | 0 | 10955 | 2 |
| D | 0 | 15631 | 2 |
| Mode SS | |||
|---|---|---|---|
| Quadrant | BADHDUFLAG | Total packets | Discarded packets |
| A | 0 | 104 | 0 |
| B | 0 | 104 | 0 |
| C | 0 | 104 | 0 |
| D | 0 | 104 | 0 |
| Quadrant | Total seconds | Saturated seconds | Saturation percentage |
|---|---|---|---|
| A | 5125 | 11 | 0.214634% |
| B | 5125 | 149 | 2.907317% |
| C | 5125 | 22 | 0.429268% |
| D | 5124 | 403 | 7.864949% |
Noise dominated data is calculated using 1-second bins in cleaned event files. If a bin has >2000 counts, and if more than 50% of those come from <1% of pixels, then it is considered to be noise-dominated and hence unusable.
| Quadrant | # 1 sec bins | Bins with >0 counts | Bins with >2000 counts | High rate bins dominated by noise | Noise dominated (total time) | Noise dominated (detector-on time) | Marked lightcurve |
|---|---|---|---|---|---|---|---|
| A | 7098 | 5126 | 3 | 3 | 0.04% | 0.06% | 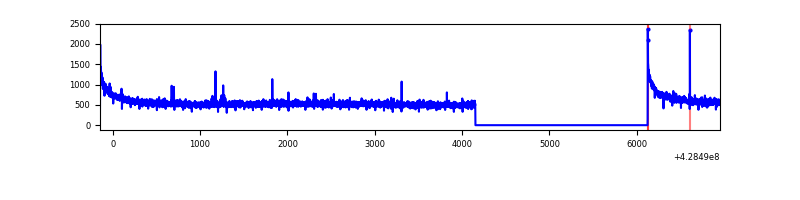 |
| B | 7098 | 5126 | 114 | 114 | 1.61% | 2.22% | 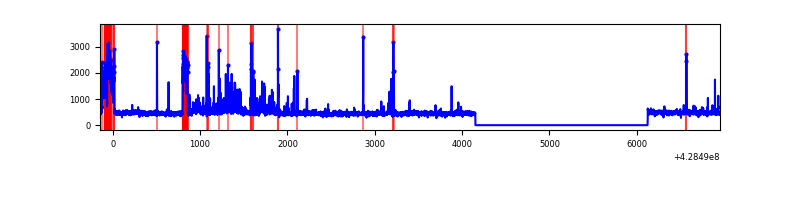 |
| C | 7098 | 5126 | 18 | 18 | 0.25% | 0.35% | 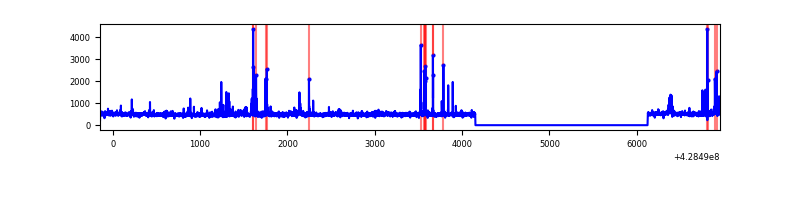 |
| D | 7097 | 5125 | 336 | 336 | 4.73% | 6.56% | 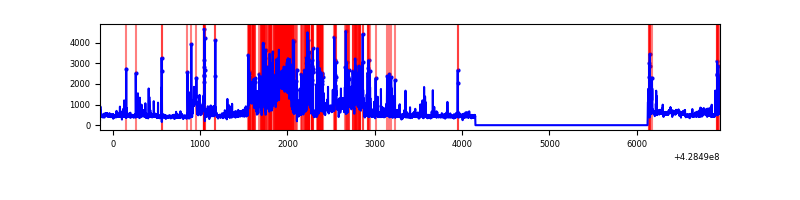 |
Top three noisy pixels from each quadrant. If the there are fewer than three noisy pixels in the level2.evt file, extra rows are filled as -1
| Pixel properties | Quadrant properties | ||||||
|---|---|---|---|---|---|---|---|
| Quadrant | DetID | PixID | Counts | Sigma | Mean | Median | Sigma |
| A | 10 | 83 | 591973 | 4979.9 | 582 | 570 | 118.8 |
| A | 13 | 6 | 13513 | 108.99 | 582 | 570 | 118.8 |
| A | 13 | 248 | 9865 | 78.27 | 582 | 570 | 118.8 |
| B | 4 | 81 | 475096 | 4458.0 | 564 | 551 | 106.4 |
| B | 15 | 36 | 71434 | 665.89 | 564 | 551 | 106.4 |
| B | 5 | 172 | 45629 | 423.47 | 564 | 551 | 106.4 |
| C | 15 | 214 | 220547 | 1708.54 | 555 | 559 | 128.8 |
| C | 14 | 254 | 155548 | 1203.72 | 555 | 559 | 128.8 |
| C | 8 | 79 | 62001 | 477.19 | 555 | 559 | 128.8 |
| D | 2 | 16 | 785759 | 5864.72 | 553 | 538 | 133.9 |
| D | 10 | 118 | 295468 | 2202.79 | 553 | 538 | 133.9 |
| D | 12 | 233 | 284671 | 2122.15 | 553 | 538 | 133.9 |
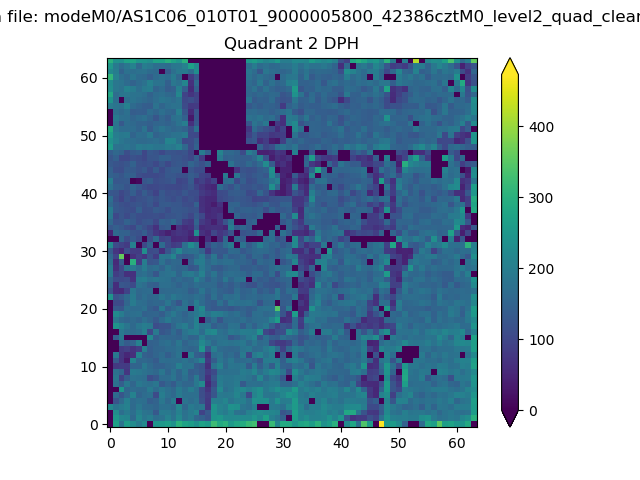
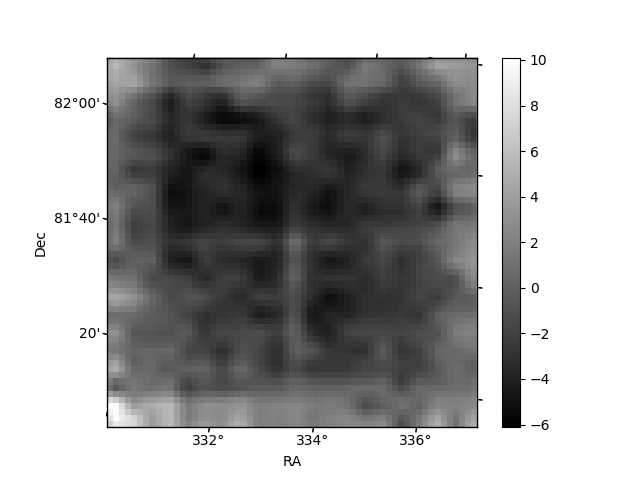
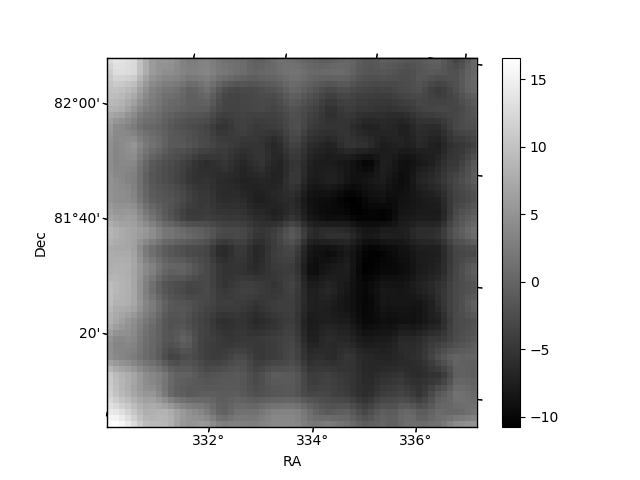
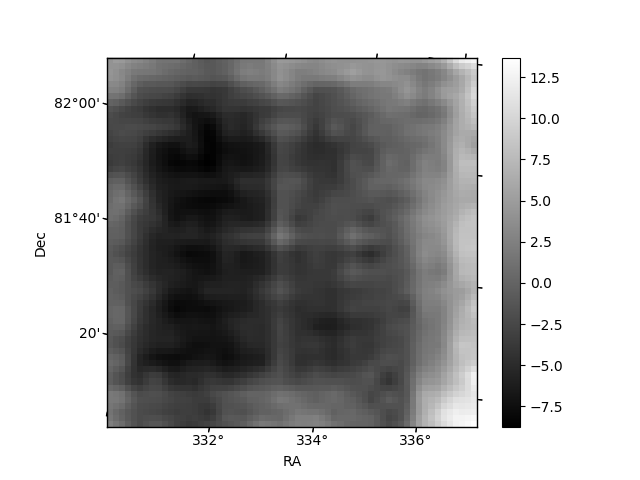
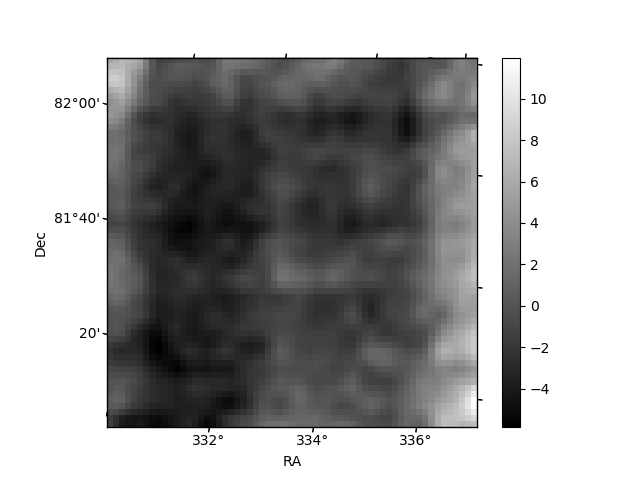
Histogram calculated using DETX and DETY for each event in the final _common_clean file
| Quadrant A | 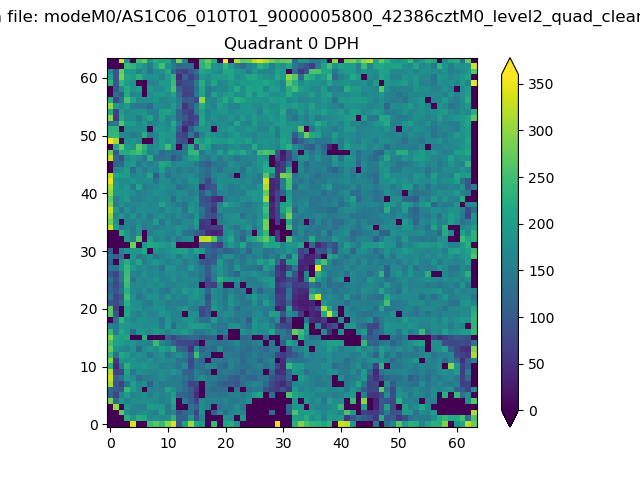 |
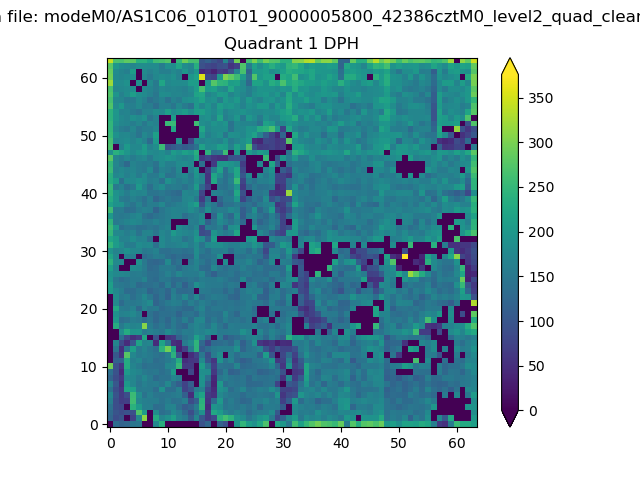 |
Quadrant B |
|---|---|---|---|
| Quadrant D | 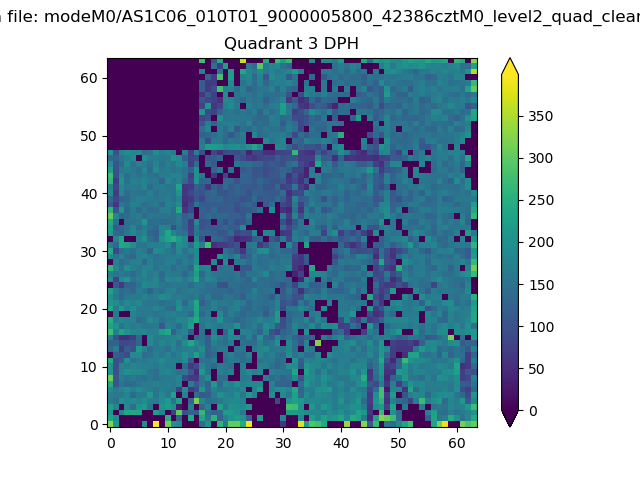 |
 |
Quadrant C |
| Plot type | Count rate plots | Images |
|---|---|---|
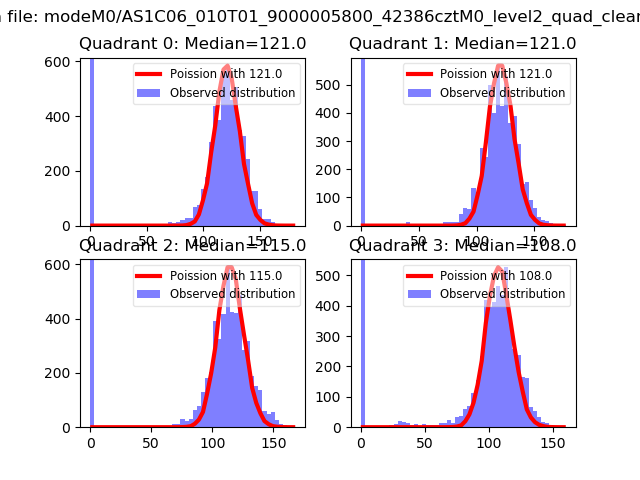
| Comparison with Poisson distribution Blue bars denote a histogram of data divided into 1 sec bins. Red curve is a Poisson curve with rate = median count rate of data. |
 |
 |
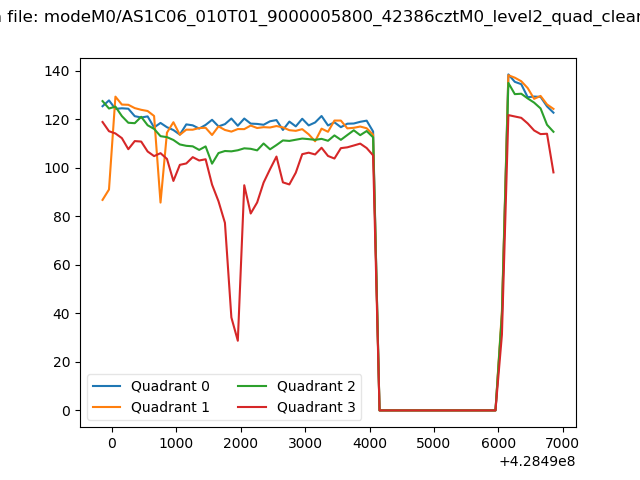
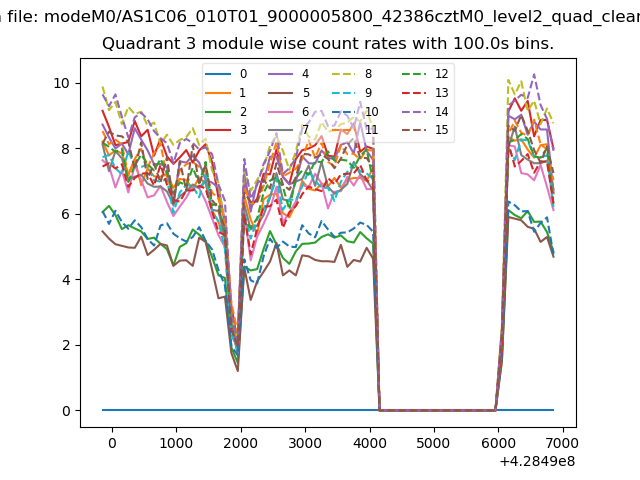
| Quadrant-wise count rates Data is divided into 100 sec bins |
 |
|
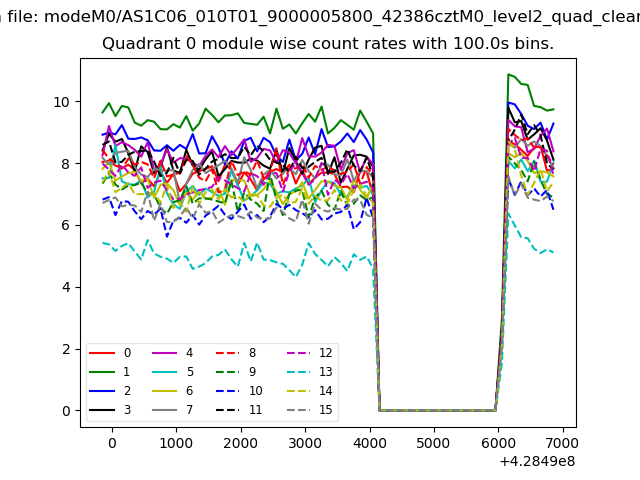
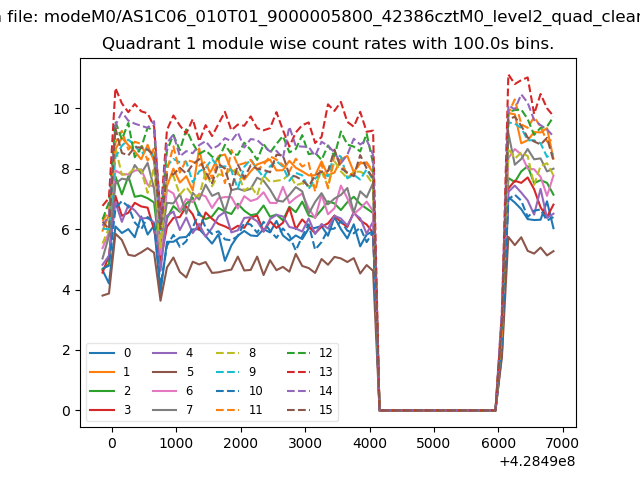
| Module-wise count rates for Quadrant A Data is divided into 100 sec bins |
 |
 |
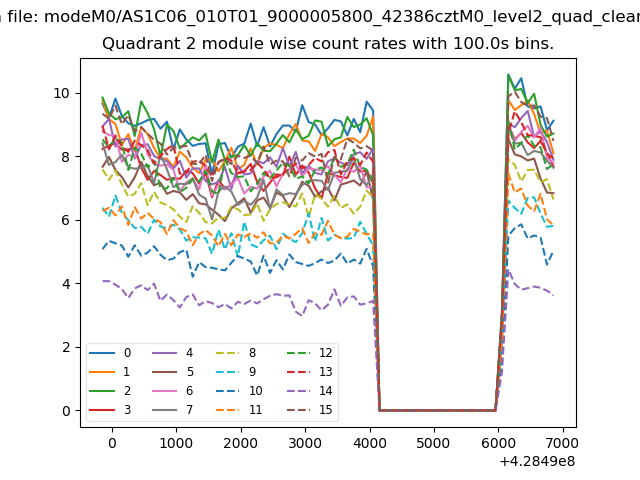
| Module-wise count rates for Quadrant B Data is divided into 100 sec bins |
 |
 |
| Module-wise count rates for Quadrant C Data is divided into 100 sec bins |
 |
 |
| Module-wise count rates for Quadrant D Data is divided into 100 sec bins |
 |
 |
| Parameter | Plot |
|---|---|
| CZT HV Monitor | 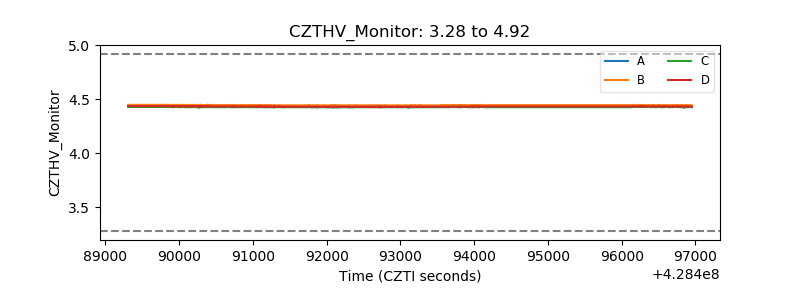 |
| D_VDD |  |
| Temperature 1 | 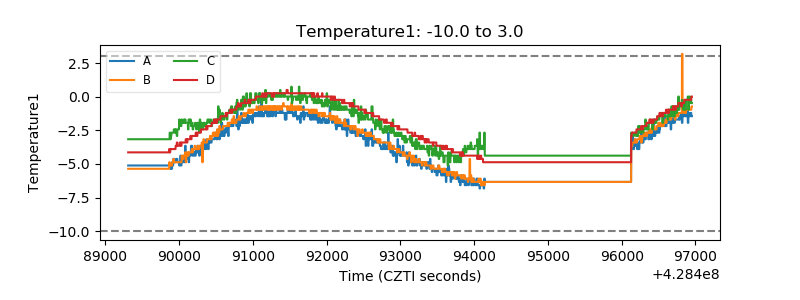 |
| Veto HV Monitor | 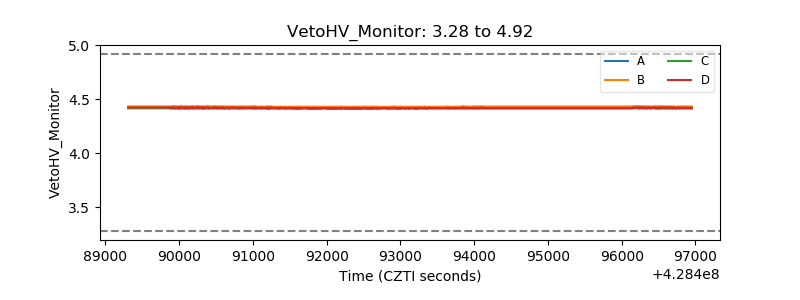 |
| Veto LLD |  |
| Alpha Counter | 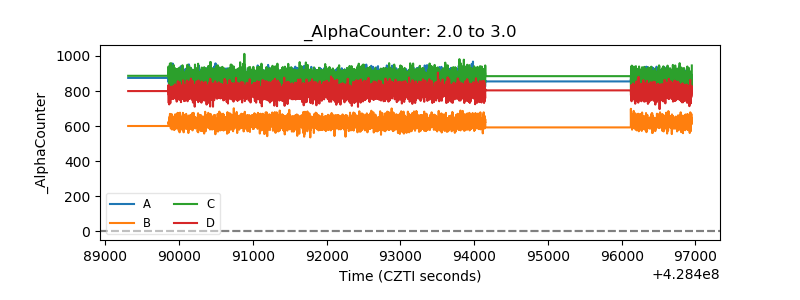 |
| _CPM_Rate | 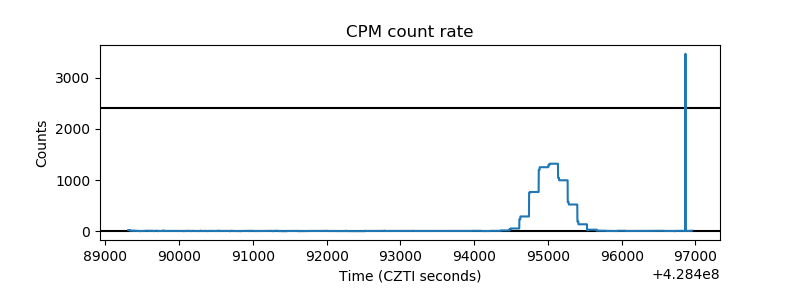 |
| CZT Counter | 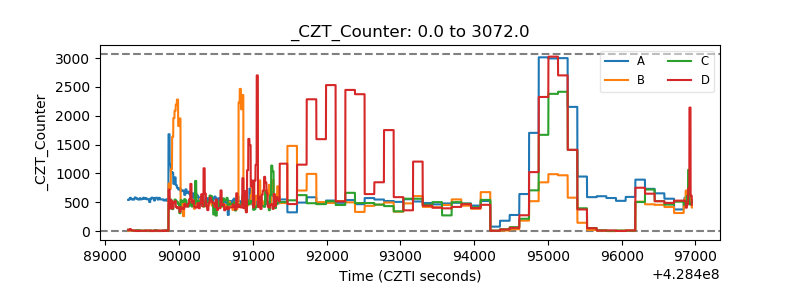 |
| +2.5 Volts monitor | 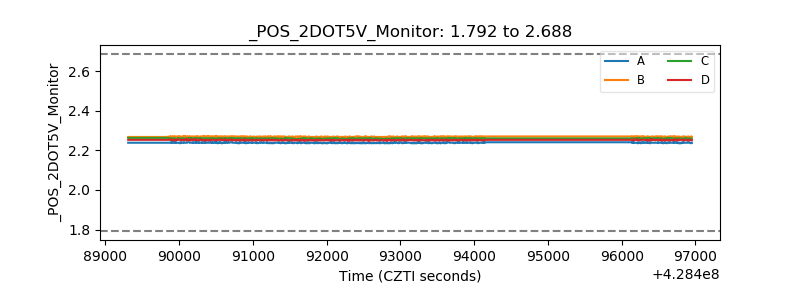 |
| +5 Volts monitor | 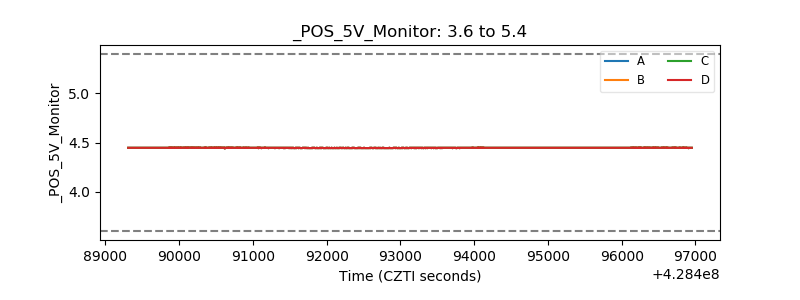 |
| _ROLL_ROT | 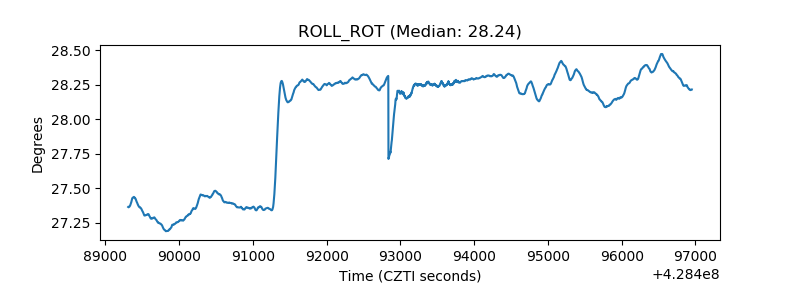 |
| _Roll_DEC | 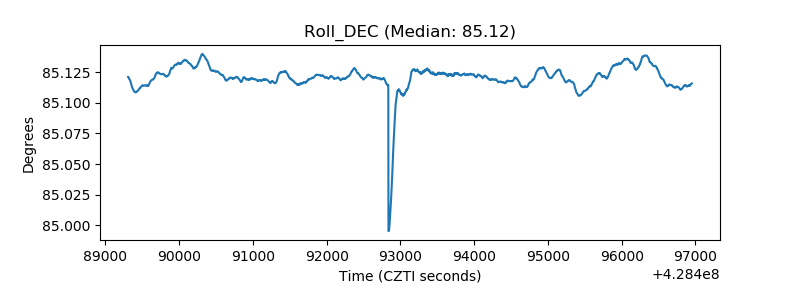 |
| _Roll_RA | 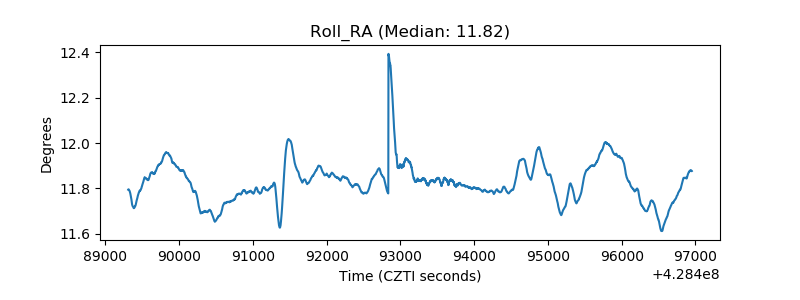 |
| Veto Counter | 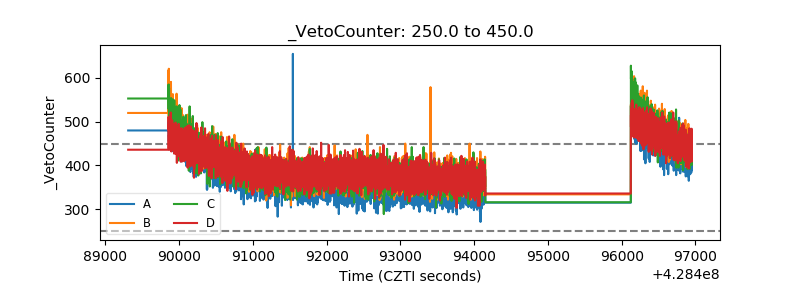 |