| Param | Original file | Final file |
|---|---|---|
| Filename | modeM0/AS1C06_010T01_9000005800_42387cztM0_level2.fits | modeM0/AS1C06_010T01_9000005800_42387cztM0_level2_quad_clean.evt |
| Size (bytes) | 313,024,320 | 88,257,600 |
| Size | 298.5 MB | 84.2 MB |
| Events in quadrant A | 2,759,639 | 611,218 |
| Events in quadrant B | 2,452,398 | 607,093 |
| Events in quadrant C | 2,768,516 | 572,644 |
| Events in quadrant D | 3,223,952 | 537,094 |
| Mode M9 | |||
|---|---|---|---|
| Quadrant | BADHDUFLAG | Total packets | Discarded packets |
| A | 0 | 21 | 0 |
| B | 0 | 21 | 0 |
| C | 0 | 21 | 0 |
| D | 0 | 21 | 0 |
| Mode M0 | |||
|---|---|---|---|
| Quadrant | BADHDUFLAG | Total packets | Discarded packets |
| A | 0 | 10995 | 2 |
| B | 0 | 10498 | 2 |
| C | 0 | 11206 | 2 |
| D | 0 | 12773 | 2 |
| Mode SS | |||
|---|---|---|---|
| Quadrant | BADHDUFLAG | Total packets | Discarded packets |
| A | 0 | 100 | 0 |
| B | 0 | 100 | 0 |
| C | 0 | 100 | 0 |
| D | 0 | 100 | 0 |
| Quadrant | Total seconds | Saturated seconds | Saturation percentage |
|---|---|---|---|
| A | 4911 | 8 | 0.162900% |
| B | 4912 | 24 | 0.488599% |
| C | 4912 | 79 | 1.608306% |
| D | 4912 | 128 | 2.605863% |
Noise dominated data is calculated using 1-second bins in cleaned event files. If a bin has >2000 counts, and if more than 50% of those come from <1% of pixels, then it is considered to be noise-dominated and hence unusable.
| Quadrant | # 1 sec bins | Bins with >0 counts | Bins with >2000 counts | High rate bins dominated by noise | Noise dominated (total time) | Noise dominated (detector-on time) | Marked lightcurve |
|---|---|---|---|---|---|---|---|
| A | 7005 | 4912 | 5 | 5 | 0.07% | 0.10% |  |
| B | 7006 | 4913 | 17 | 17 | 0.24% | 0.35% |  |
| C | 7006 | 4913 | 55 | 55 | 0.79% | 1.12% |  |
| D | 7006 | 4913 | 91 | 91 | 1.30% | 1.85% |  |
Top three noisy pixels from each quadrant. If the there are fewer than three noisy pixels in the level2.evt file, extra rows are filled as -1
| Pixel properties | Quadrant properties | ||||||
|---|---|---|---|---|---|---|---|
| Quadrant | DetID | PixID | Counts | Sigma | Mean | Median | Sigma |
| A | 10 | 83 | 555260 | 4876.39 | 562 | 551 | 113.8 |
| A | 13 | 6 | 14503 | 122.65 | 562 | 551 | 113.8 |
| A | 13 | 254 | 8059 | 66.0 | 562 | 551 | 113.8 |
| B | 15 | 36 | 101397 | 967.71 | 550 | 536 | 104.2 |
| B | 4 | 141 | 38600 | 365.21 | 550 | 536 | 104.2 |
| B | 0 | 230 | 28585 | 269.12 | 550 | 536 | 104.2 |
| C | 14 | 254 | 425114 | 3435.67 | 537 | 539 | 123.6 |
| C | 15 | 214 | 208159 | 1680.06 | 537 | 539 | 123.6 |
| C | 8 | 79 | 17191 | 134.75 | 537 | 539 | 123.6 |
| D | 1 | 52 | 479879 | 3626.5 | 545 | 528 | 132.2 |
| D | 10 | 118 | 217080 | 1638.31 | 545 | 528 | 132.2 |
| D | 12 | 233 | 190882 | 1440.11 | 545 | 528 | 132.2 |
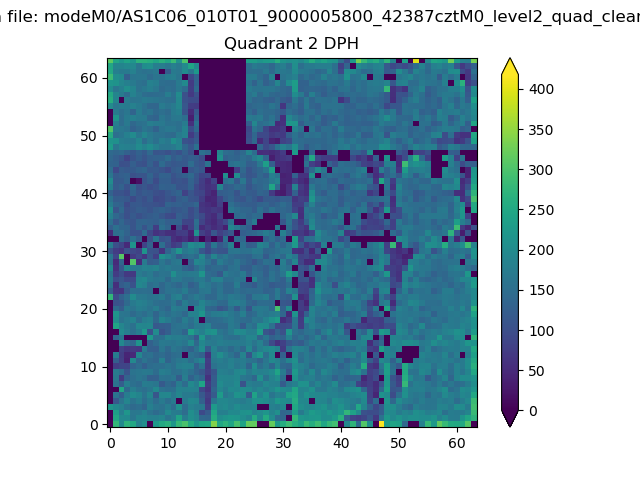
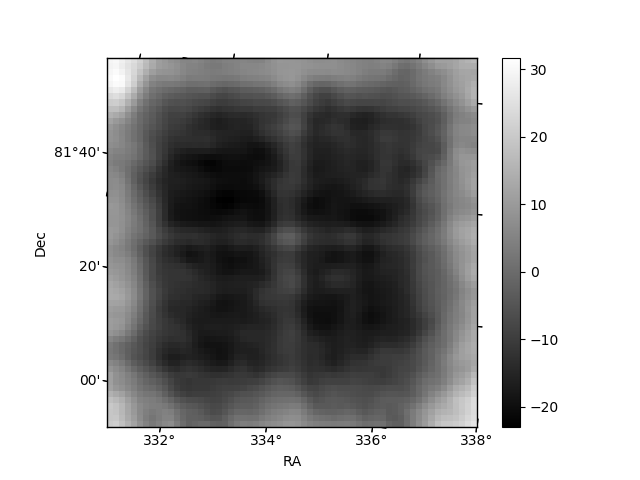
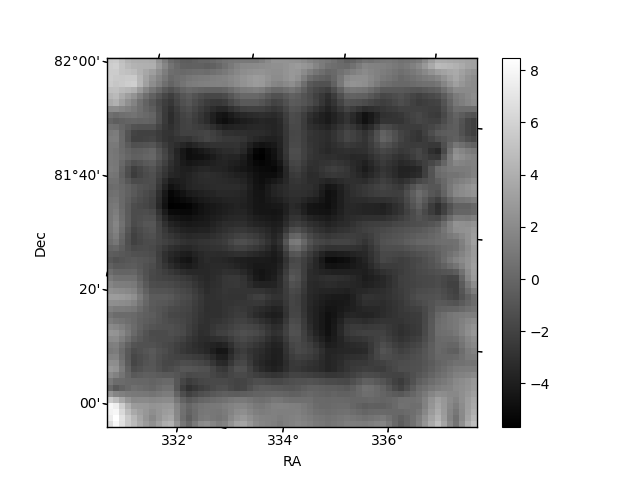
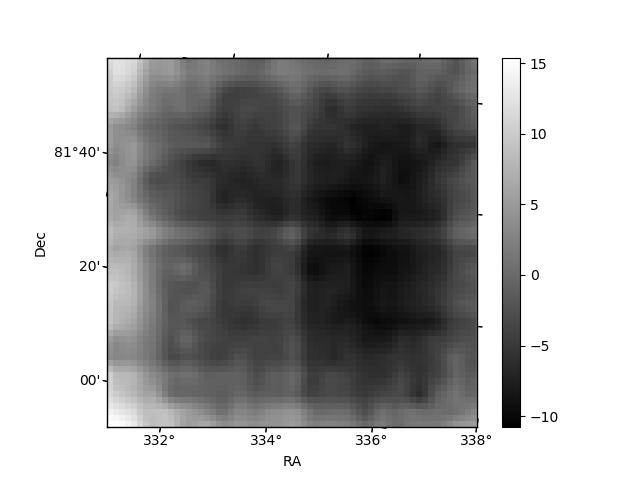
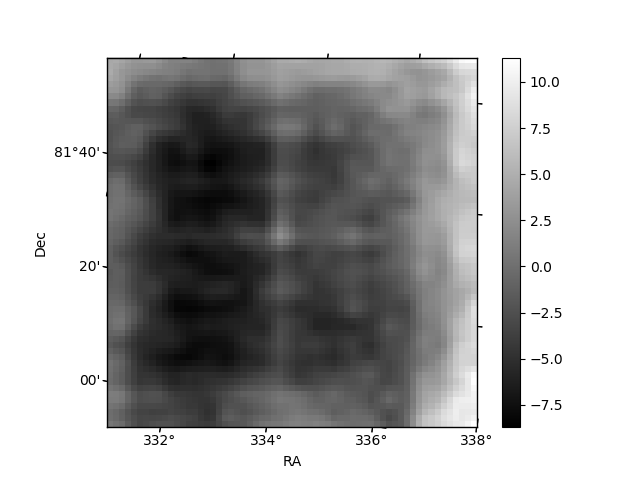
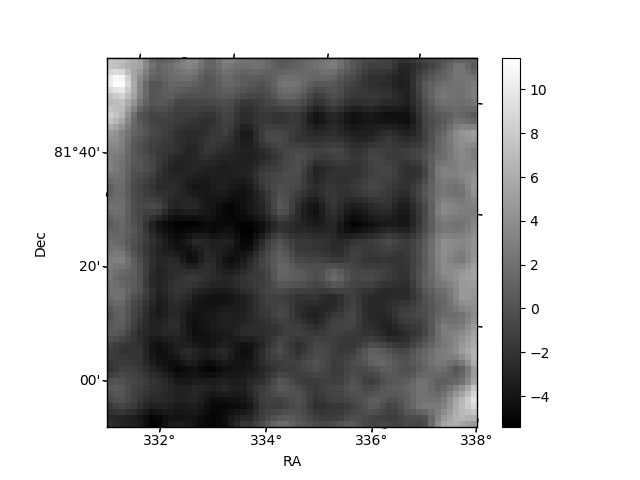
Histogram calculated using DETX and DETY for each event in the final _common_clean file
| Quadrant A | 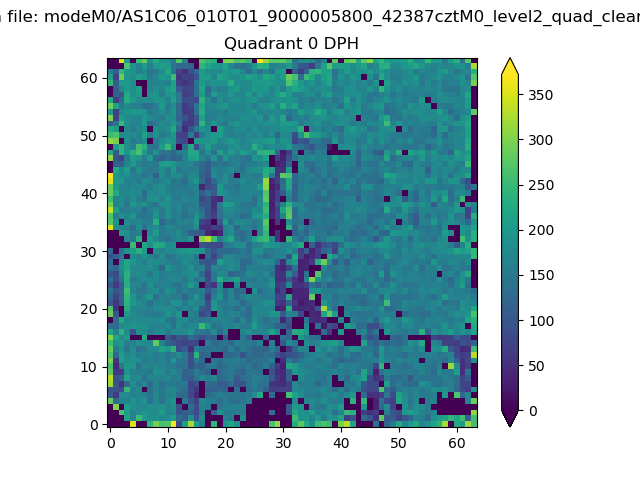 |
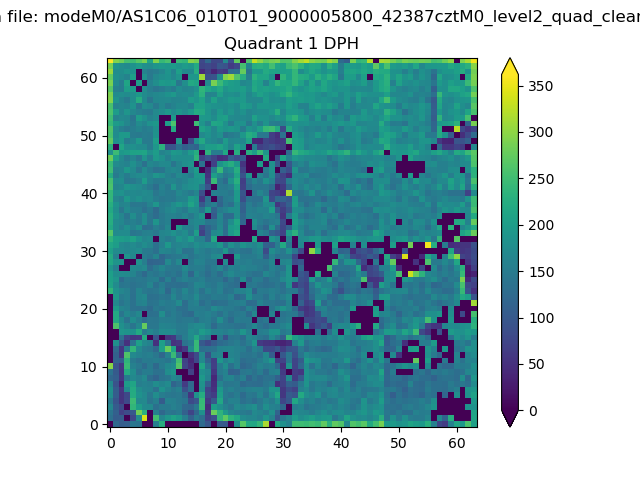 |
Quadrant B |
|---|---|---|---|
| Quadrant D | 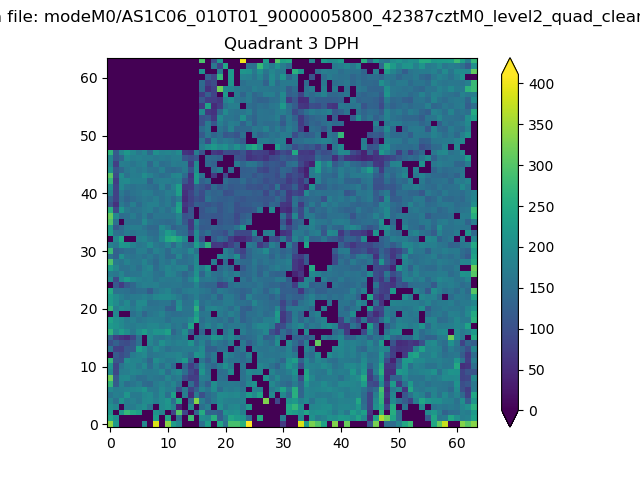 |
 |
Quadrant C |
| Plot type | Count rate plots | Images |
|---|---|---|
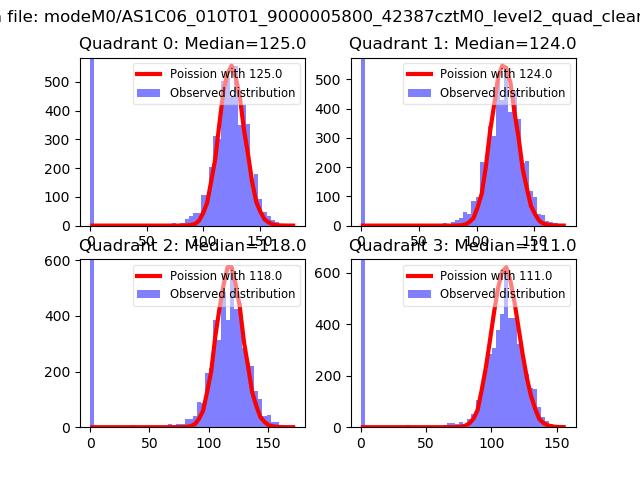
| Comparison with Poisson distribution Blue bars denote a histogram of data divided into 1 sec bins. Red curve is a Poisson curve with rate = median count rate of data. |
 |
 |
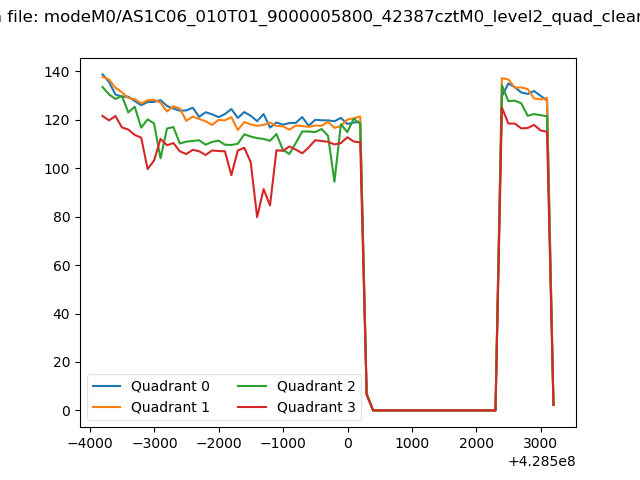
| Quadrant-wise count rates Data is divided into 100 sec bins |
 |
|
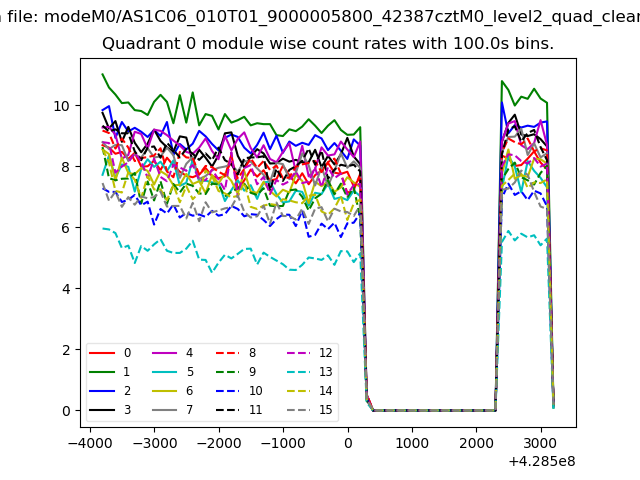
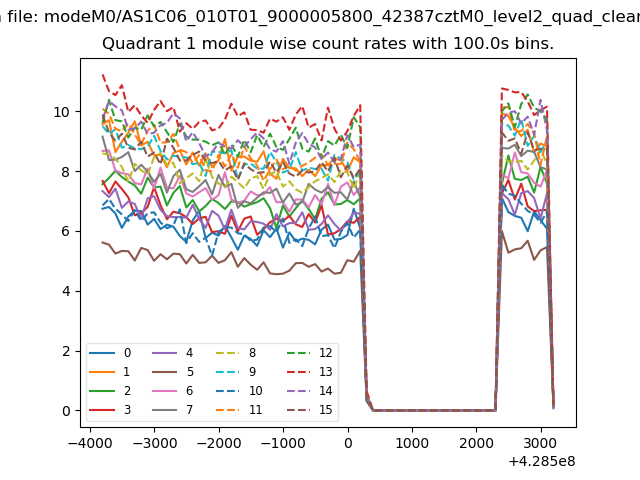
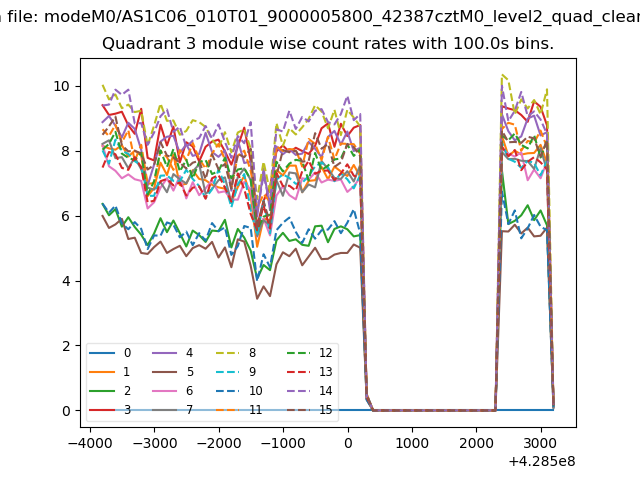
| Module-wise count rates for Quadrant A Data is divided into 100 sec bins |
 |
 |
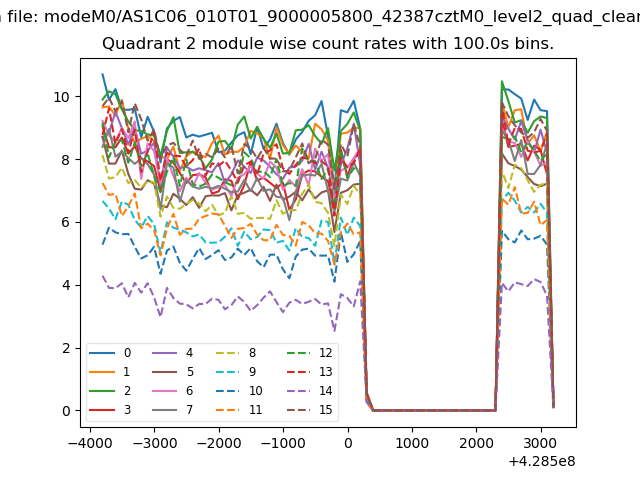
| Module-wise count rates for Quadrant B Data is divided into 100 sec bins |
 |
 |
| Module-wise count rates for Quadrant C Data is divided into 100 sec bins |
 |
 |
| Module-wise count rates for Quadrant D Data is divided into 100 sec bins |
 |
 |
| Parameter | Plot |
|---|---|
| CZT HV Monitor | 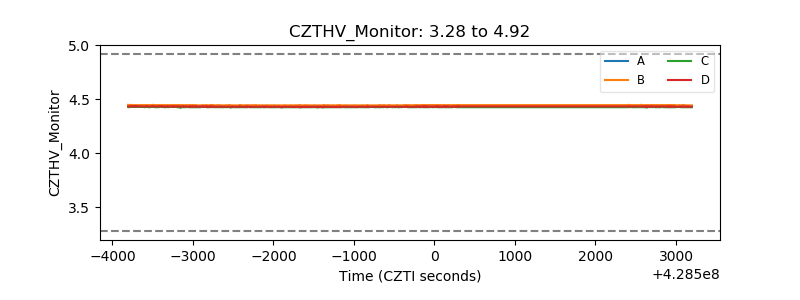 |
| D_VDD | 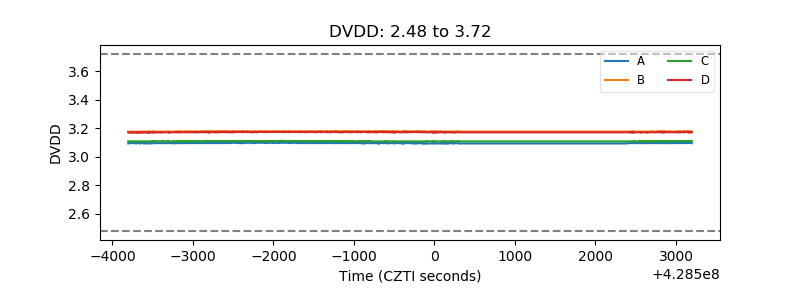 |
| Temperature 1 | 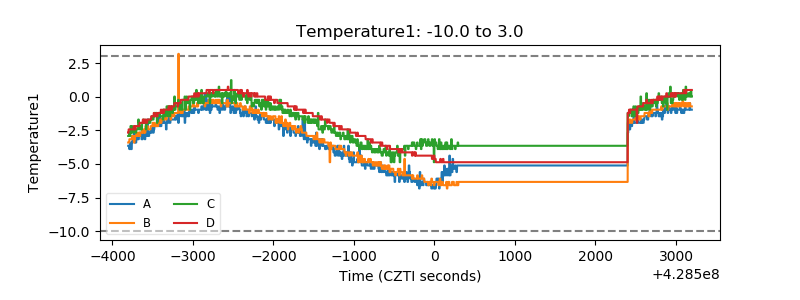 |
| Veto HV Monitor |  |
| Veto LLD | 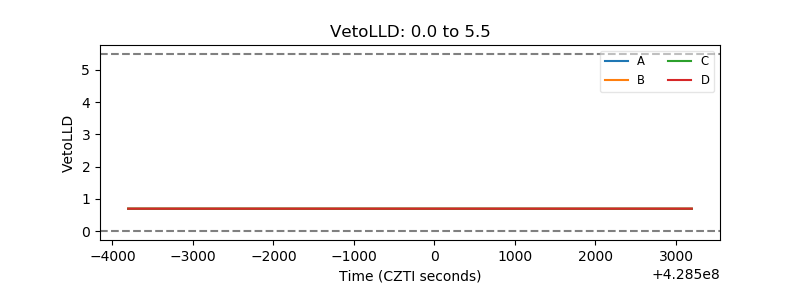 |
| Alpha Counter | 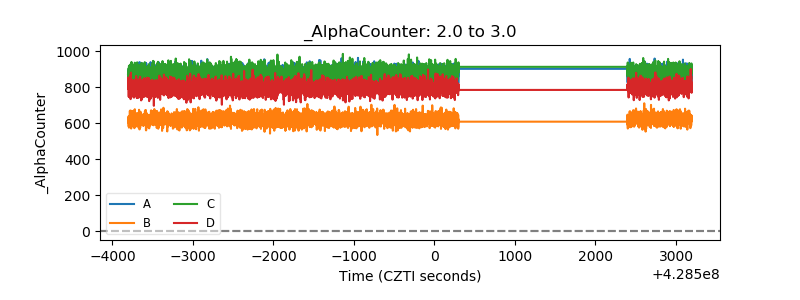 |
| _CPM_Rate | 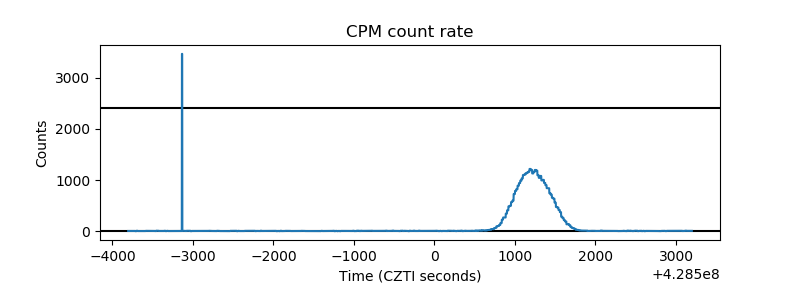 |
| CZT Counter | 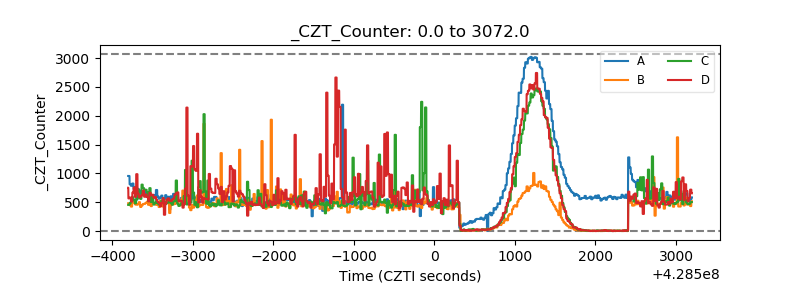 |
| +2.5 Volts monitor |  |
| +5 Volts monitor | 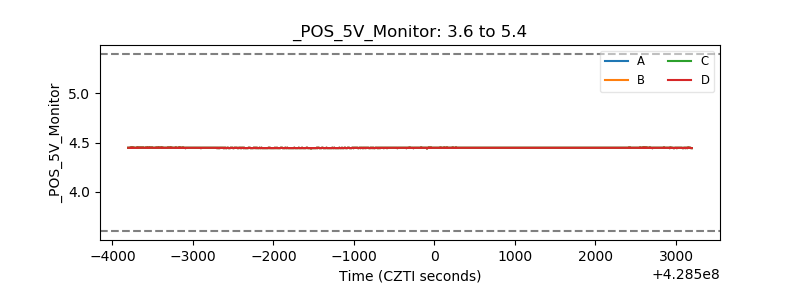 |
| _ROLL_ROT | 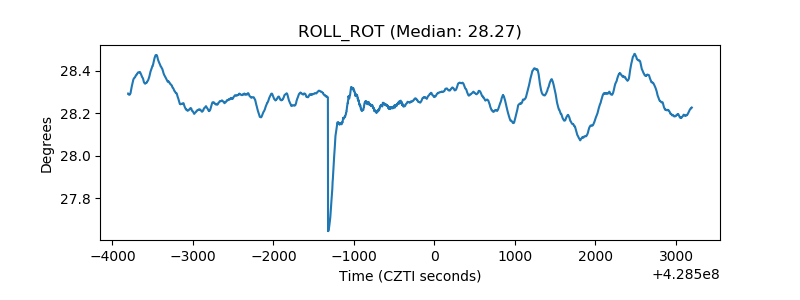 |
| _Roll_DEC |  |
| _Roll_RA | 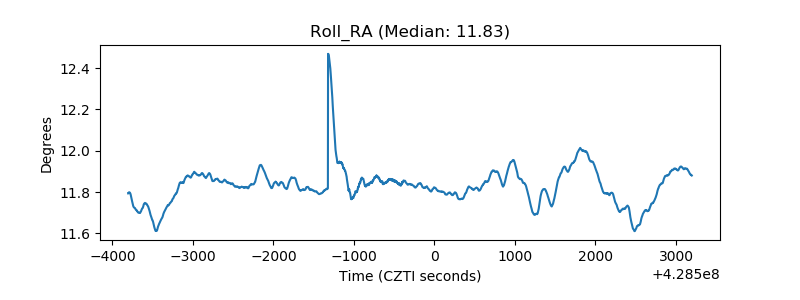 |
| Veto Counter | 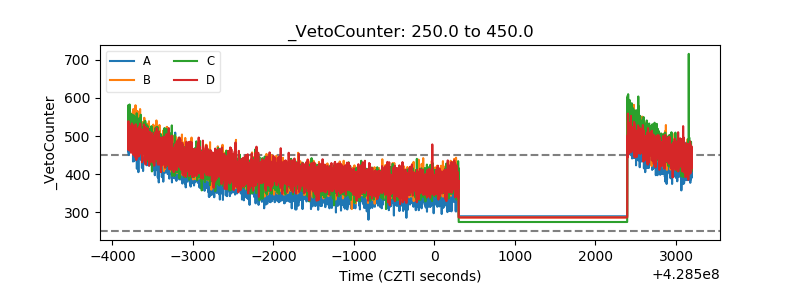 |