| Param | Original file | Final file |
|---|---|---|
| Filename | modeM0/AS1C06_010T01_9000005800_42388cztM0_level2.fits | modeM0/AS1C06_010T01_9000005800_42388cztM0_level2_quad_clean.evt |
| Size (bytes) | 349,634,880 | 90,584,640 |
| Size | 333.4 MB | 86.4 MB |
| Events in quadrant A | 3,019,014 | 629,893 |
| Events in quadrant B | 2,625,837 | 623,698 |
| Events in quadrant C | 3,155,884 | 583,393 |
| Events in quadrant D | 3,741,469 | 545,736 |
| Mode M9 | |||
|---|---|---|---|
| Quadrant | BADHDUFLAG | Total packets | Discarded packets |
| A | 0 | 21 | 0 |
| B | 0 | 21 | 0 |
| C | 0 | 21 | 0 |
| D | 0 | 21 | 0 |
| Mode M0 | |||
|---|---|---|---|
| Quadrant | BADHDUFLAG | Total packets | Discarded packets |
| A | 0 | 12038 | 2 |
| B | 0 | 11195 | 2 |
| C | 0 | 12490 | 2 |
| D | 0 | 14668 | 2 |
| Mode SS | |||
|---|---|---|---|
| Quadrant | BADHDUFLAG | Total packets | Discarded packets |
| A | 0 | 106 | 0 |
| B | 0 | 106 | 0 |
| C | 0 | 106 | 0 |
| D | 0 | 106 | 0 |
| Quadrant | Total seconds | Saturated seconds | Saturation percentage |
|---|---|---|---|
| A | 5137 | 39 | 0.759198% |
| B | 5138 | 40 | 0.778513% |
| C | 5138 | 182 | 3.542234% |
| D | 5138 | 277 | 5.391203% |
Noise dominated data is calculated using 1-second bins in cleaned event files. If a bin has >2000 counts, and if more than 50% of those come from <1% of pixels, then it is considered to be noise-dominated and hence unusable.
| Quadrant | # 1 sec bins | Bins with >0 counts | Bins with >2000 counts | High rate bins dominated by noise | Noise dominated (total time) | Noise dominated (detector-on time) | Marked lightcurve |
|---|---|---|---|---|---|---|---|
| A | 7290 | 5138 | 28 | 28 | 0.38% | 0.54% | 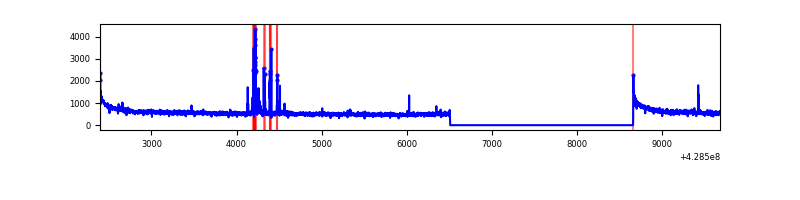 |
| B | 7291 | 5139 | 29 | 29 | 0.40% | 0.56% | 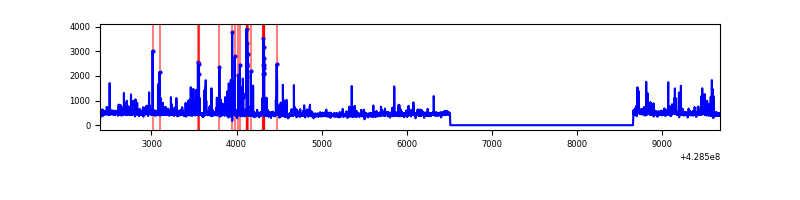 |
| C | 7291 | 5139 | 136 | 136 | 1.87% | 2.65% | 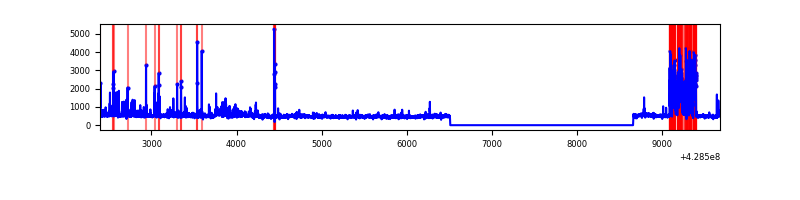 |
| D | 7291 | 5139 | 220 | 220 | 3.02% | 4.28% | 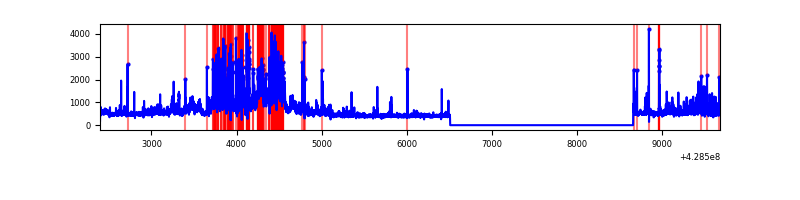 |
Top three noisy pixels from each quadrant. If the there are fewer than three noisy pixels in the level2.evt file, extra rows are filled as -1
| Pixel properties | Quadrant properties | ||||||
|---|---|---|---|---|---|---|---|
| Quadrant | DetID | PixID | Counts | Sigma | Mean | Median | Sigma |
| A | 10 | 83 | 620609 | 5268.26 | 579 | 569 | 117.7 |
| A | 7 | 3 | 133216 | 1127.05 | 579 | 569 | 117.7 |
| A | 13 | 6 | 16674 | 136.84 | 579 | 569 | 117.7 |
| B | 15 | 36 | 136633 | 1273.28 | 569 | 554 | 106.9 |
| B | 5 | 255 | 80318 | 746.34 | 569 | 554 | 106.9 |
| B | 7 | 221 | 42615 | 393.56 | 569 | 554 | 106.9 |
| C | 4 | 254 | 435302 | 3335.96 | 555 | 557 | 130.3 |
| C | 15 | 214 | 217858 | 1667.43 | 555 | 557 | 130.3 |
| C | 14 | 254 | 183756 | 1405.75 | 555 | 557 | 130.3 |
| D | 10 | 118 | 613260 | 4572.04 | 559 | 544 | 134.0 |
| D | 1 | 52 | 607424 | 4528.49 | 559 | 544 | 134.0 |
| D | 13 | 249 | 174398 | 1297.28 | 559 | 544 | 134.0 |
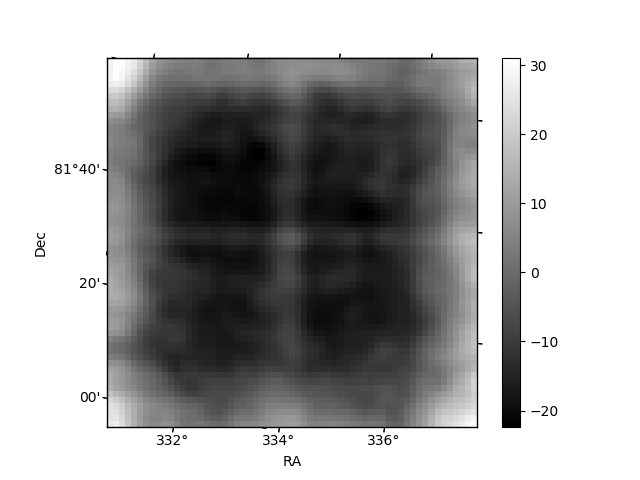
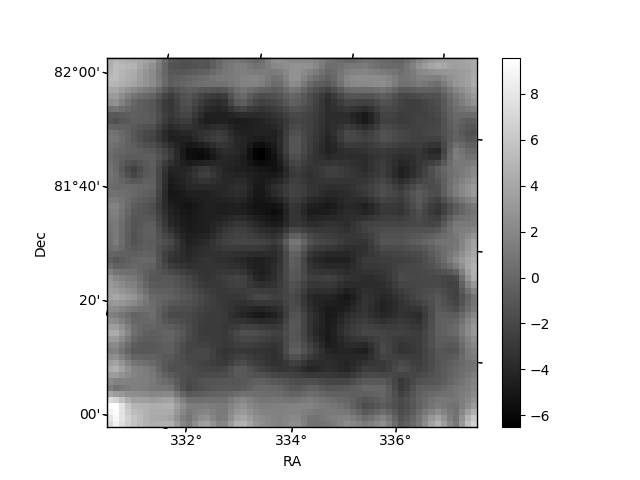
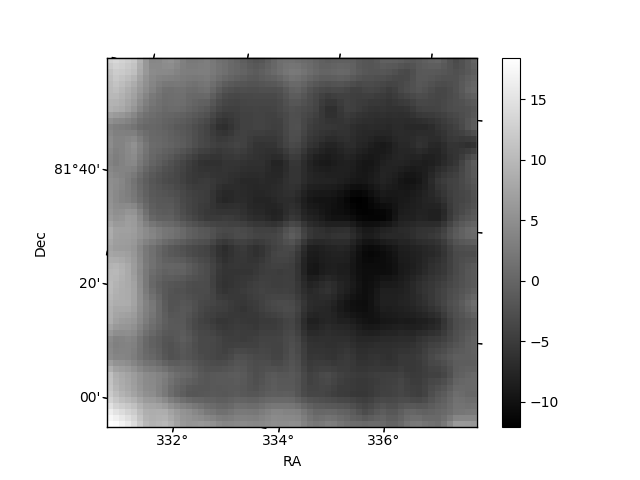
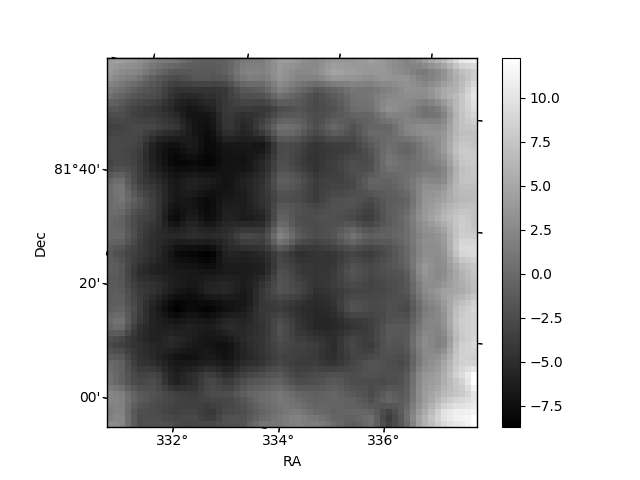
Histogram calculated using DETX and DETY for each event in the final _common_clean file
| Quadrant A | 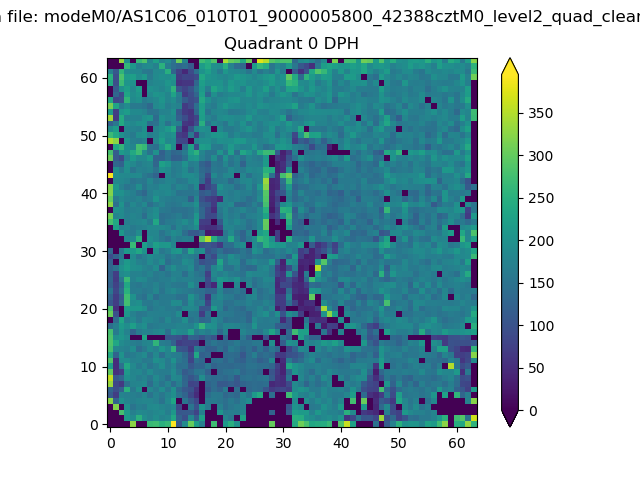 |
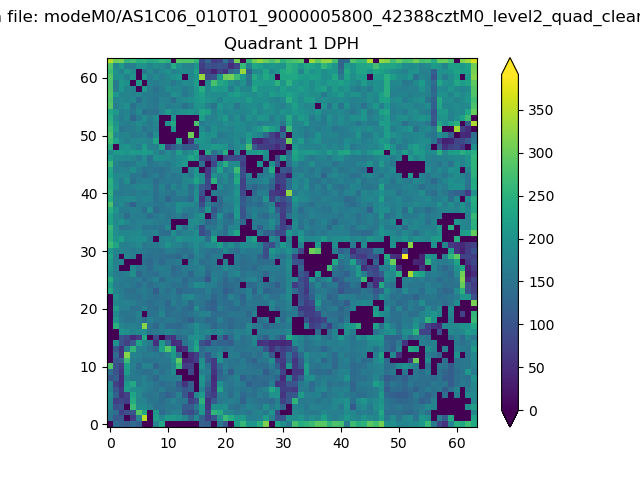 |
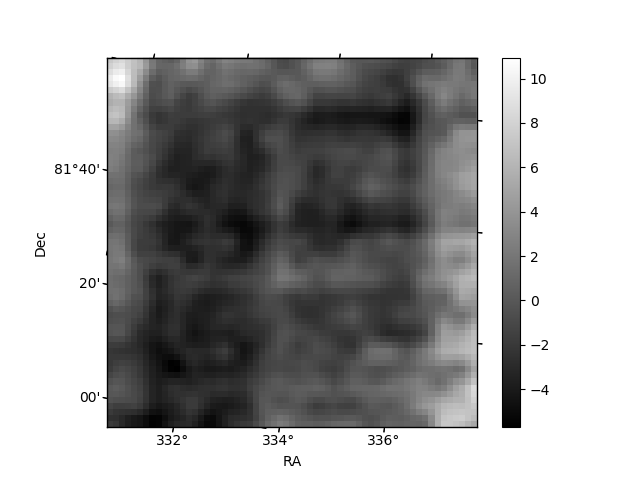
Quadrant B |
|---|---|---|---|
| Quadrant D | 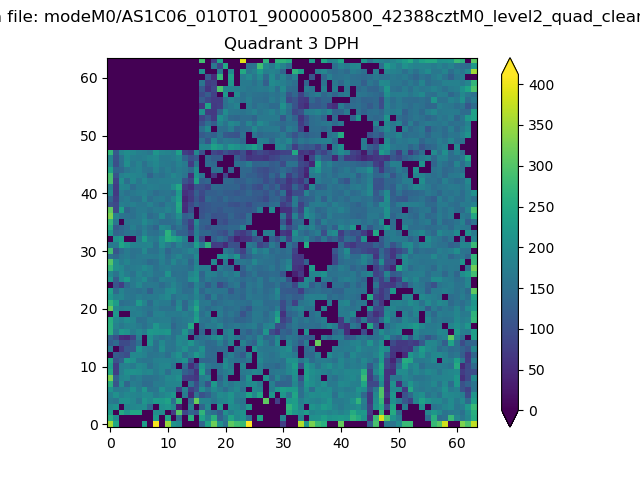 |
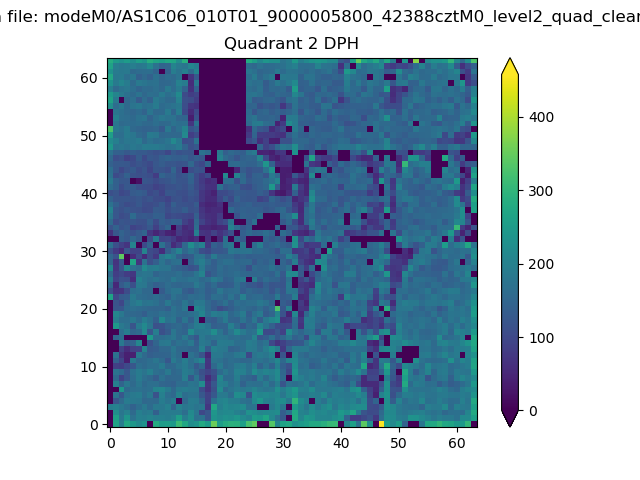 |
Quadrant C |
| Plot type | Count rate plots | Images |
|---|---|---|
| Comparison with Poisson distribution Blue bars denote a histogram of data divided into 1 sec bins. Red curve is a Poisson curve with rate = median count rate of data. |
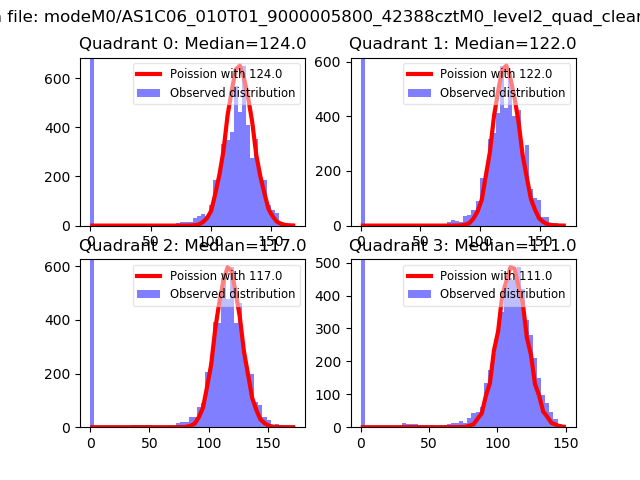 |
 |
| Quadrant-wise count rates Data is divided into 100 sec bins |
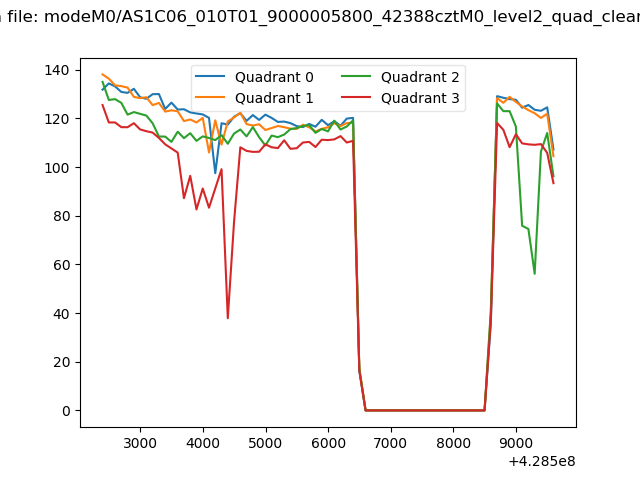 |
|
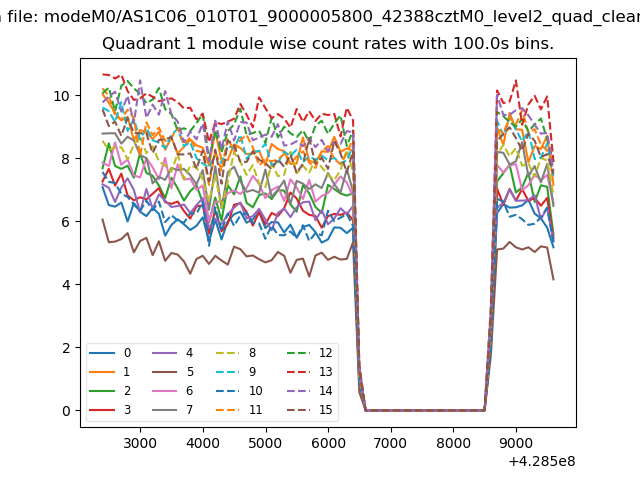
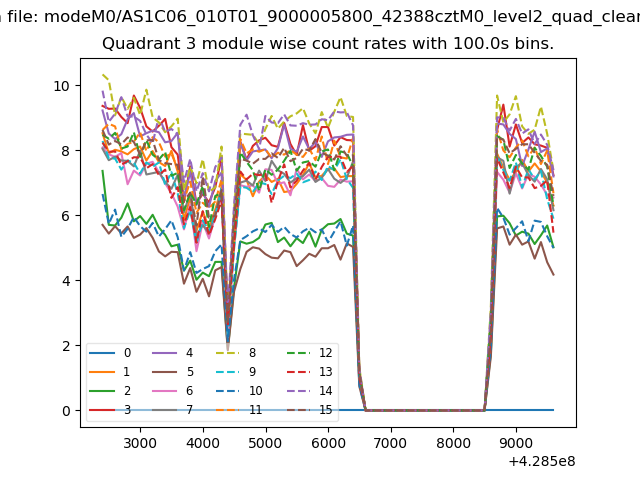
| Module-wise count rates for Quadrant A Data is divided into 100 sec bins |
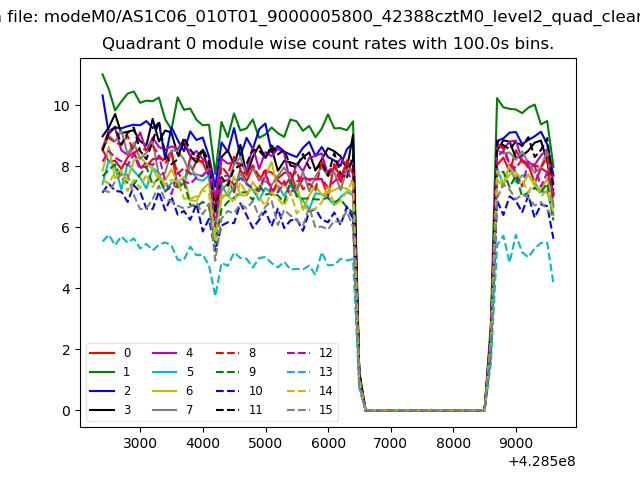 |
 |
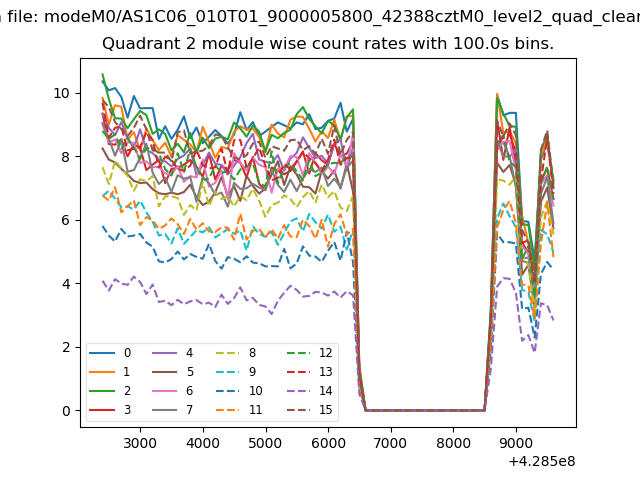
| Module-wise count rates for Quadrant B Data is divided into 100 sec bins |
 |
 |
| Module-wise count rates for Quadrant C Data is divided into 100 sec bins |
 |
 |
| Module-wise count rates for Quadrant D Data is divided into 100 sec bins |
 |
 |
| Parameter | Plot |
|---|---|
| CZT HV Monitor | 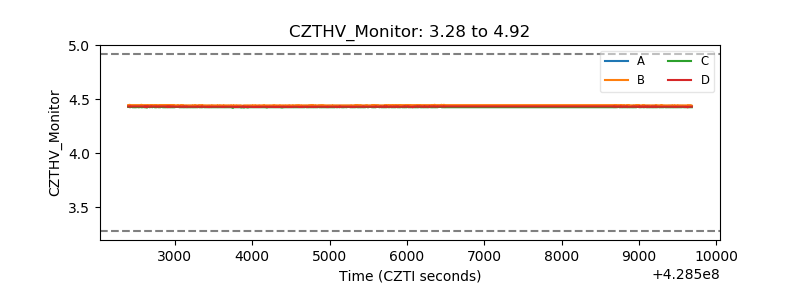 |
| D_VDD | 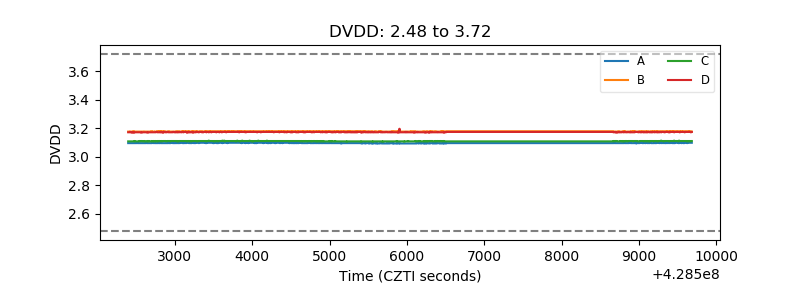 |
| Temperature 1 | 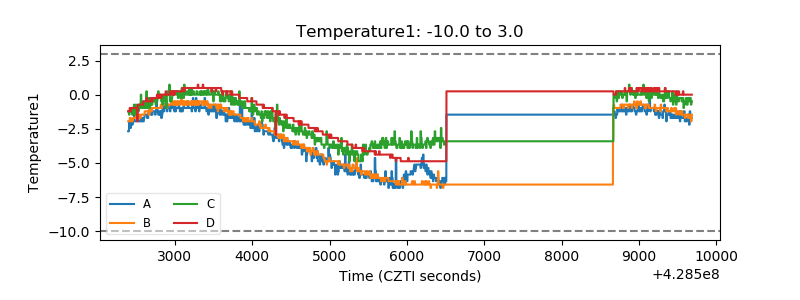 |
| Veto HV Monitor | 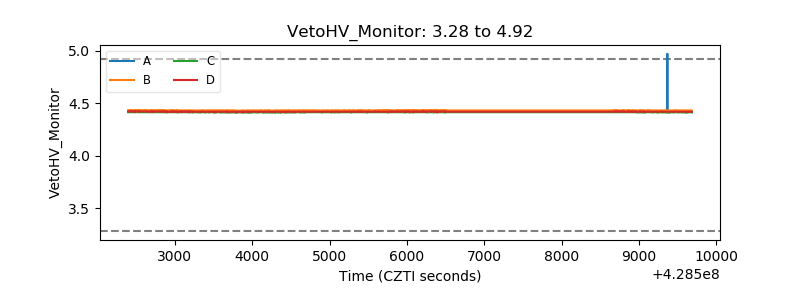 |
| Veto LLD | 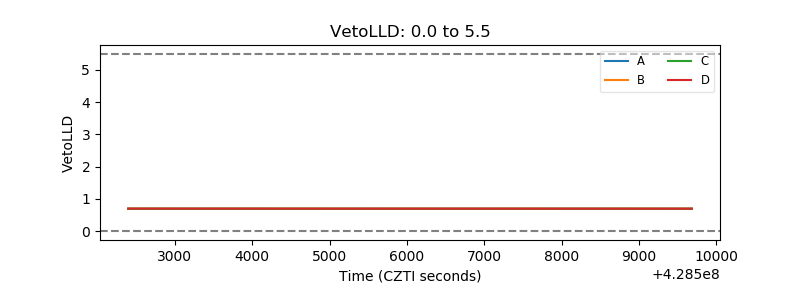 |
| Alpha Counter | 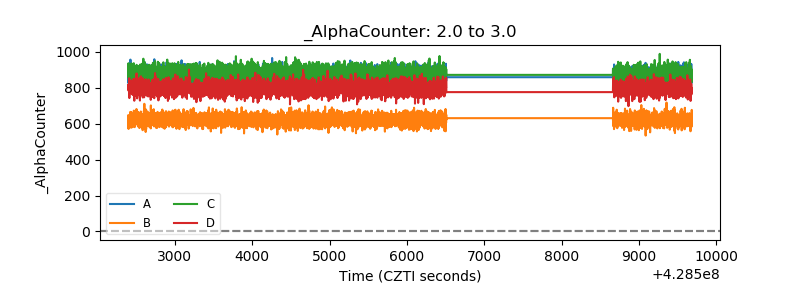 |
| _CPM_Rate | 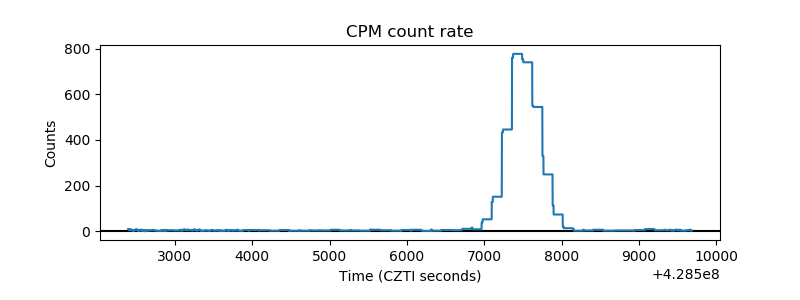 |
| CZT Counter | 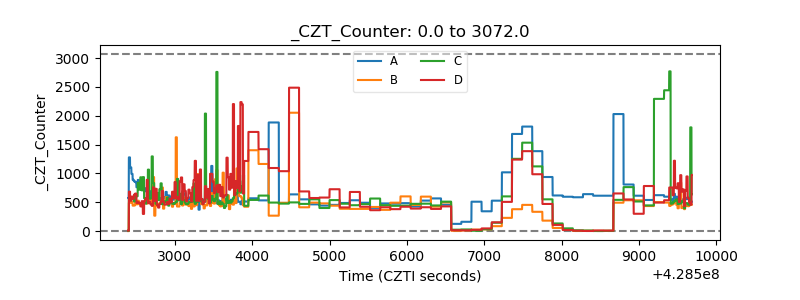 |
| +2.5 Volts monitor | 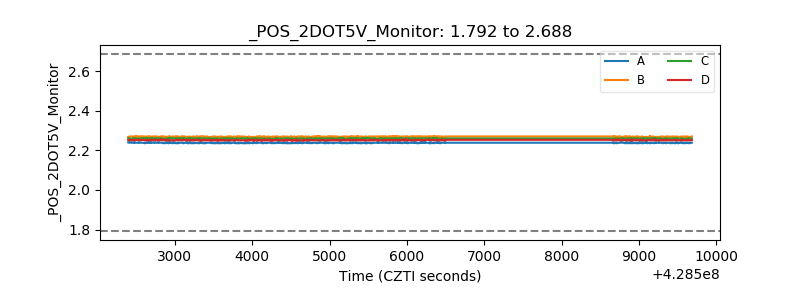 |
| +5 Volts monitor | 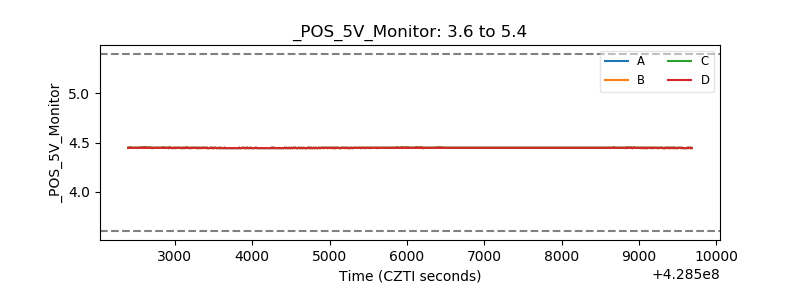 |
| _ROLL_ROT | 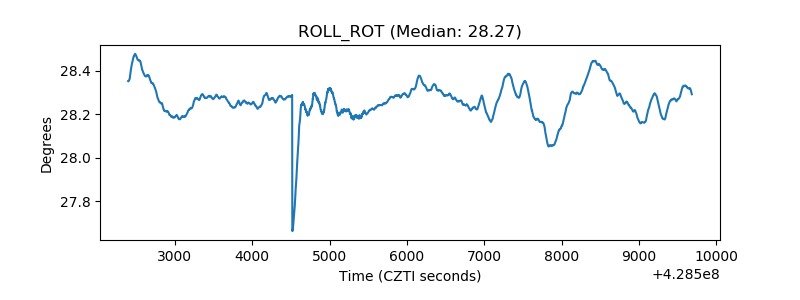 |
| _Roll_DEC | 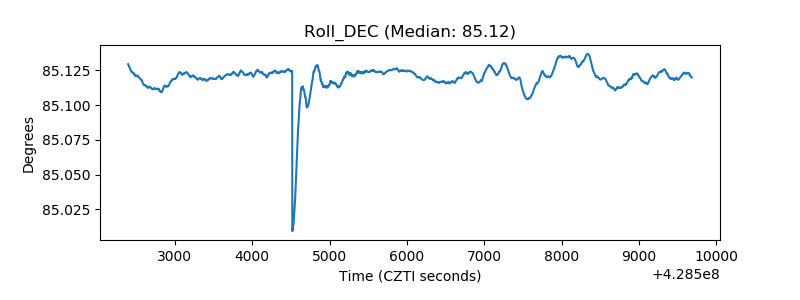 |
| _Roll_RA | 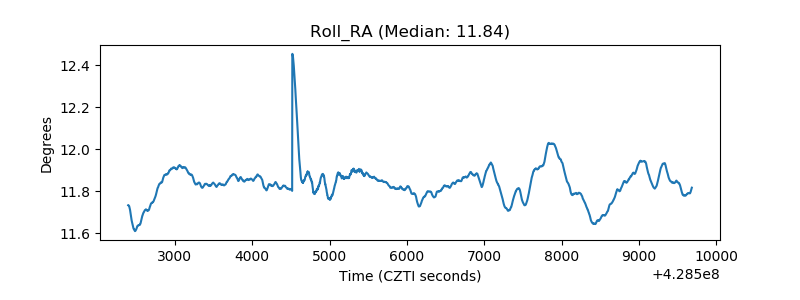 |
| Veto Counter | 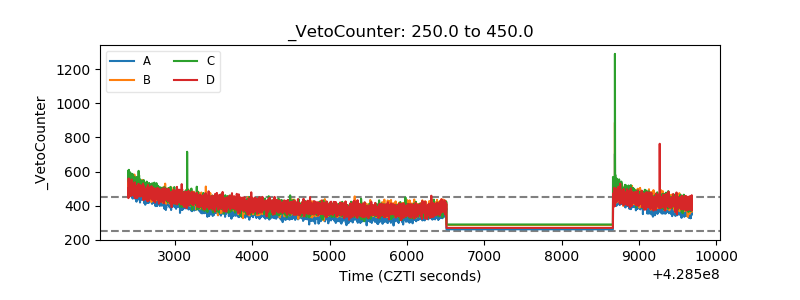 |