| Param | Original file | Final file |
|---|---|---|
| Filename | modeM0/AS1C06_010T01_9000005800_42389cztM0_level2.fits | modeM0/AS1C06_010T01_9000005800_42389cztM0_level2_quad_clean.evt |
| Size (bytes) | 386,026,560 | 84,913,920 |
| Size | 368.1 MB | 81.0 MB |
| Events in quadrant A | 2,858,881 | 602,968 |
| Events in quadrant B | 2,415,029 | 594,112 |
| Events in quadrant C | 4,029,047 | 524,280 |
| Events in quadrant D | 4,589,140 | 492,099 |
| Mode M9 | |||
|---|---|---|---|
| Quadrant | BADHDUFLAG | Total packets | Discarded packets |
| A | 0 | 22 | 0 |
| B | 0 | 23 | 0 |
| C | 0 | 23 | 0 |
| D | 0 | 23 | 0 |
| Mode M0 | |||
|---|---|---|---|
| Quadrant | BADHDUFLAG | Total packets | Discarded packets |
| A | 0 | 11611 | 2 |
| B | 0 | 10797 | 2 |
| C | 0 | 15262 | 2 |
| D | 0 | 17083 | 2 |
| Mode SS | |||
|---|---|---|---|
| Quadrant | BADHDUFLAG | Total packets | Discarded packets |
| A | 0 | 104 | 0 |
| B | 0 | 104 | 0 |
| C | 0 | 104 | 0 |
| D | 0 | 104 | 0 |
| Quadrant | Total seconds | Saturated seconds | Saturation percentage |
|---|---|---|---|
| A | 5102 | 16 | 0.313603% |
| B | 5102 | 45 | 0.882007% |
| C | 5102 | 544 | 10.662485% |
| D | 5102 | 618 | 12.112897% |
Noise dominated data is calculated using 1-second bins in cleaned event files. If a bin has >2000 counts, and if more than 50% of those come from <1% of pixels, then it is considered to be noise-dominated and hence unusable.
| Quadrant | # 1 sec bins | Bins with >0 counts | Bins with >2000 counts | High rate bins dominated by noise | Noise dominated (total time) | Noise dominated (detector-on time) | Marked lightcurve |
|---|---|---|---|---|---|---|---|
| A | 7225 | 5103 | 6 | 6 | 0.08% | 0.12% | 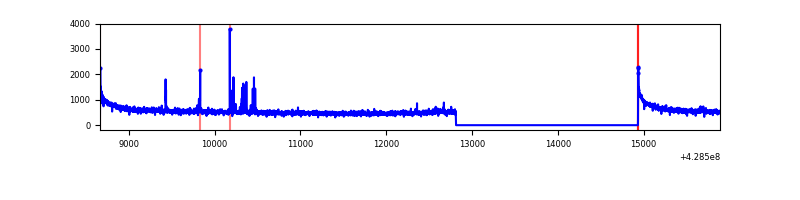 |
| B | 7225 | 5103 | 17 | 17 | 0.24% | 0.33% | 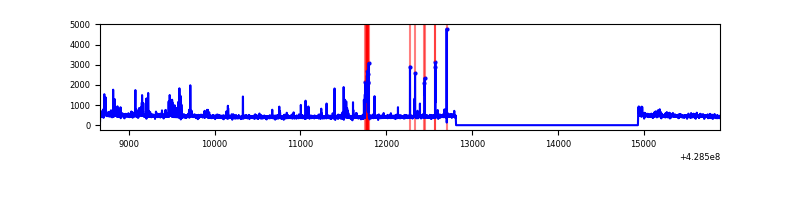 |
| C | 7225 | 5103 | 418 | 418 | 5.79% | 8.19% | 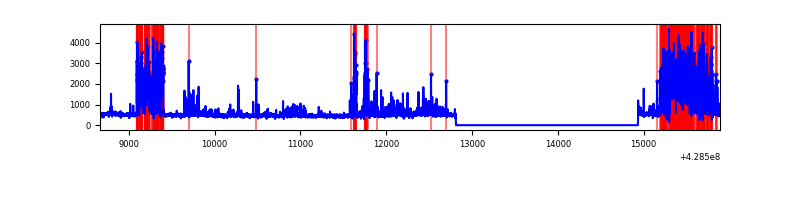 |
| D | 7225 | 5103 | 691 | 691 | 9.56% | 13.54% | 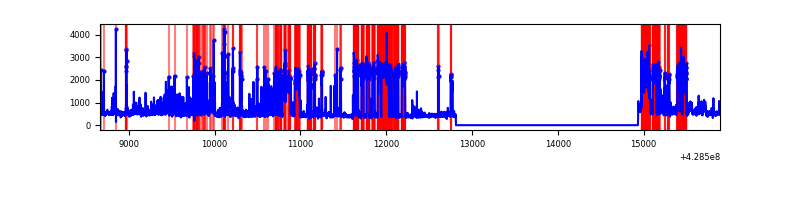 |
Top three noisy pixels from each quadrant. If the there are fewer than three noisy pixels in the level2.evt file, extra rows are filled as -1
| Pixel properties | Quadrant properties | ||||||
|---|---|---|---|---|---|---|---|
| Quadrant | DetID | PixID | Counts | Sigma | Mean | Median | Sigma |
| A | 10 | 83 | 610033 | 5328.65 | 558 | 547 | 114.4 |
| A | 7 | 3 | 66493 | 576.56 | 558 | 547 | 114.4 |
| A | 13 | 6 | 13436 | 112.69 | 558 | 547 | 114.4 |
| B | 3 | 112 | 87327 | 829.83 | 549 | 534 | 104.6 |
| B | 15 | 36 | 34638 | 326.07 | 549 | 534 | 104.6 |
| B | 5 | 172 | 32958 | 310.01 | 549 | 534 | 104.6 |
| C | 4 | 254 | 1663244 | 13757.78 | 517 | 519 | 120.9 |
| C | 15 | 214 | 208756 | 1723.0 | 517 | 519 | 120.9 |
| C | 14 | 254 | 105191 | 866.08 | 517 | 519 | 120.9 |
| D | 2 | 16 | 1651096 | 12576.01 | 539 | 526 | 131.2 |
| D | 1 | 52 | 264631 | 2012.27 | 539 | 526 | 131.2 |
| D | 12 | 233 | 222802 | 1693.56 | 539 | 526 | 131.2 |
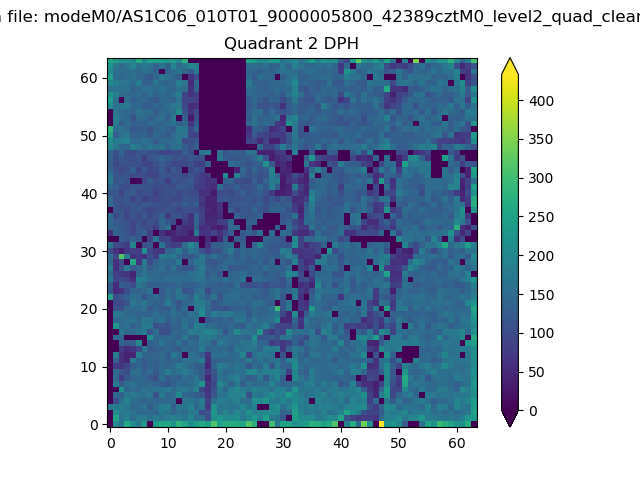
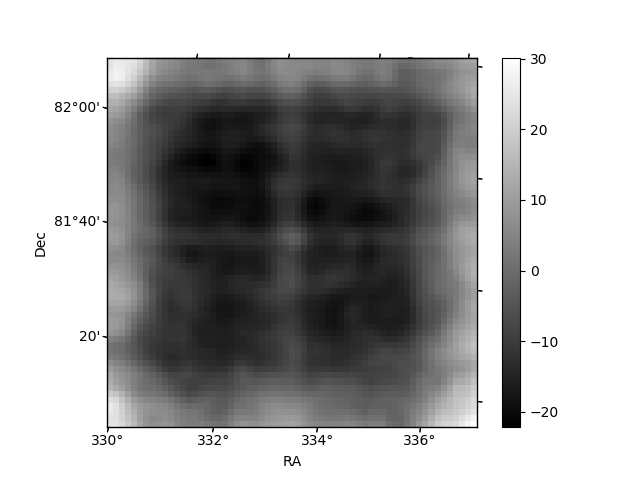
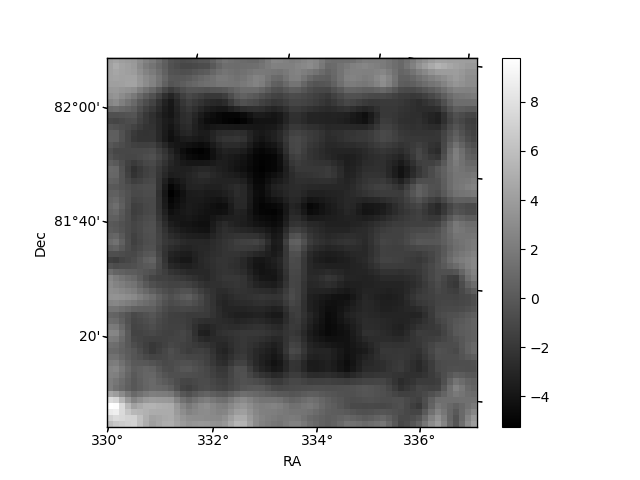
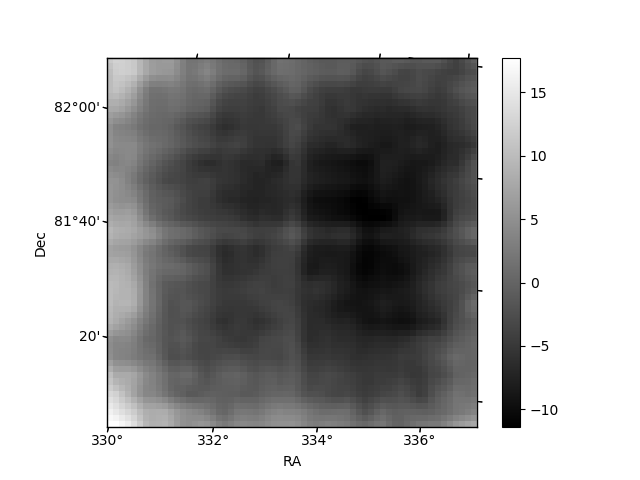
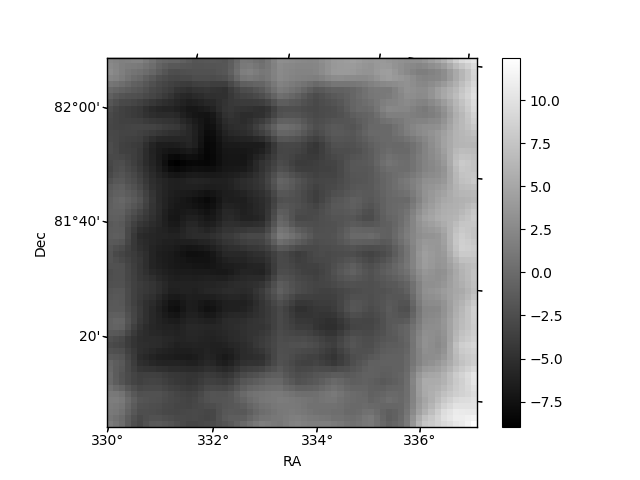
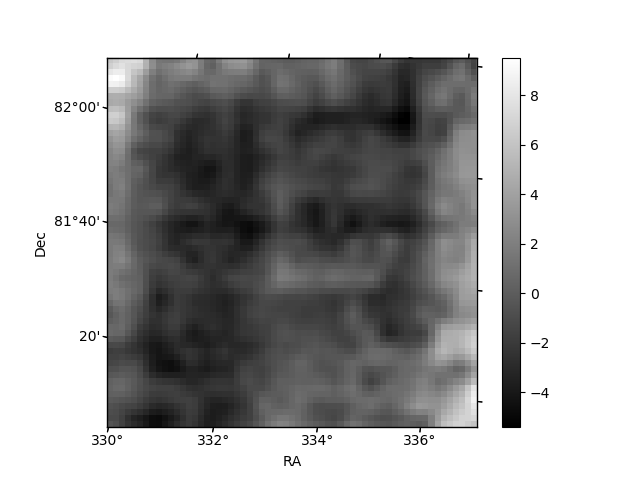
Histogram calculated using DETX and DETY for each event in the final _common_clean file
| Quadrant A | 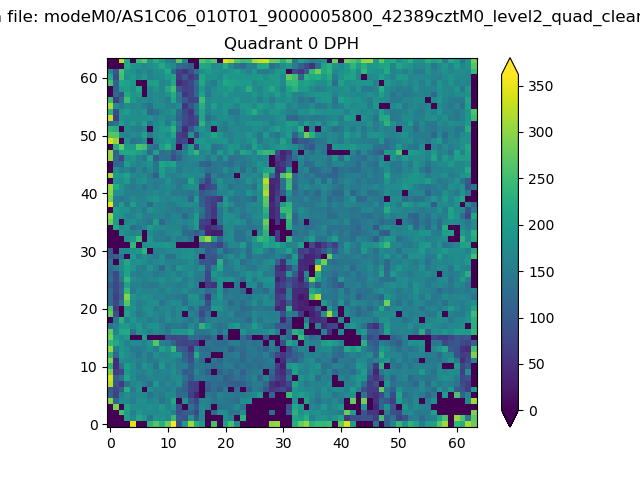 |
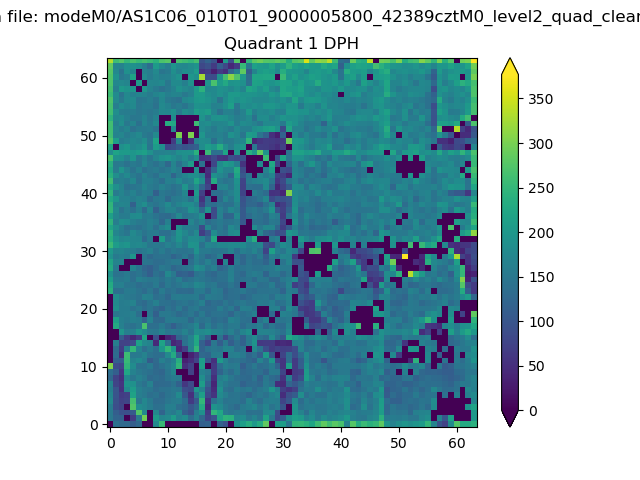 |
Quadrant B |
|---|---|---|---|
| Quadrant D | 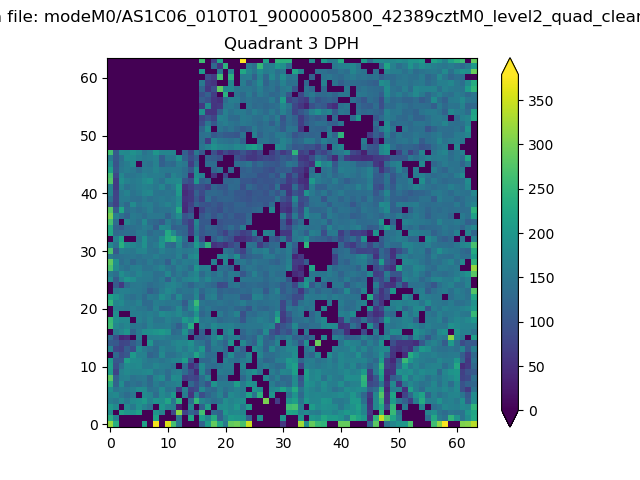 |
 |
Quadrant C |
| Plot type | Count rate plots | Images |
|---|---|---|
| Comparison with Poisson distribution Blue bars denote a histogram of data divided into 1 sec bins. Red curve is a Poisson curve with rate = median count rate of data. |
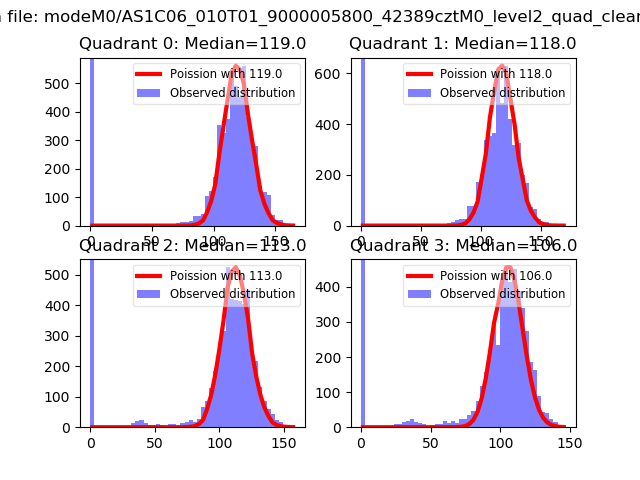 |
 |
| Quadrant-wise count rates Data is divided into 100 sec bins |
 |
|
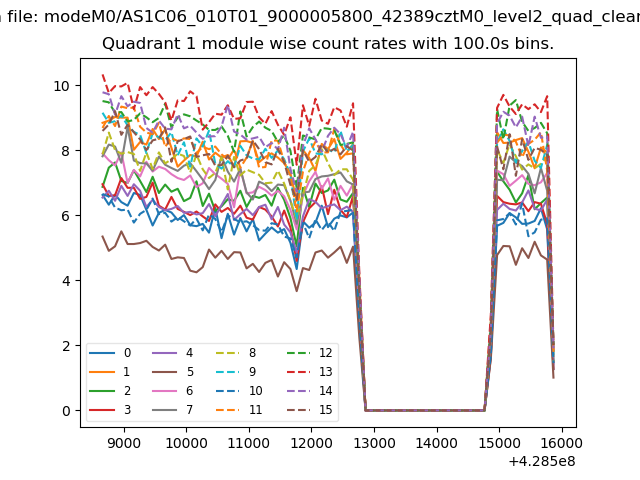
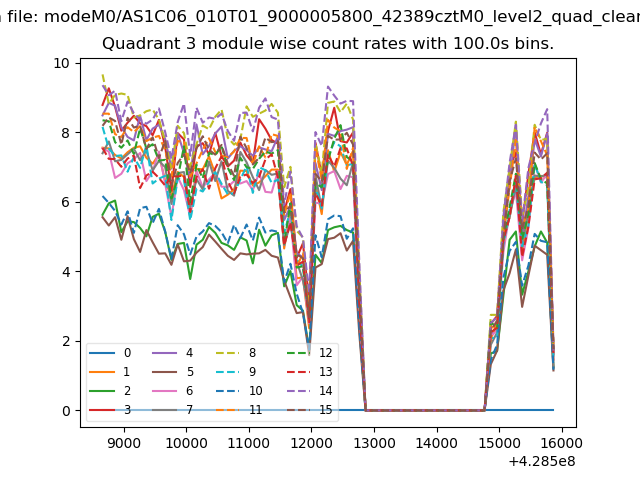
| Module-wise count rates for Quadrant A Data is divided into 100 sec bins |
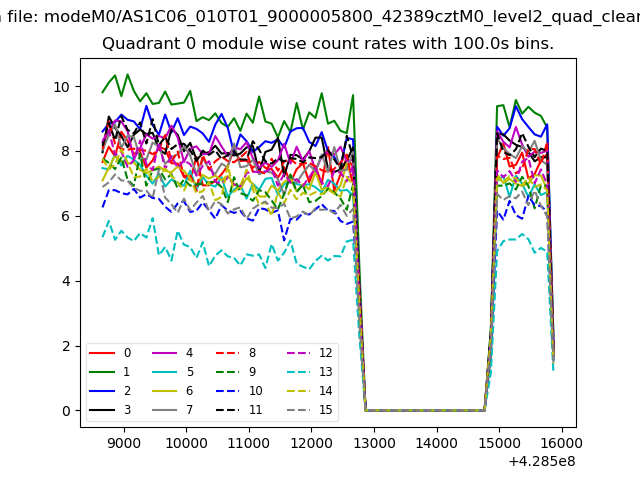 |
 |
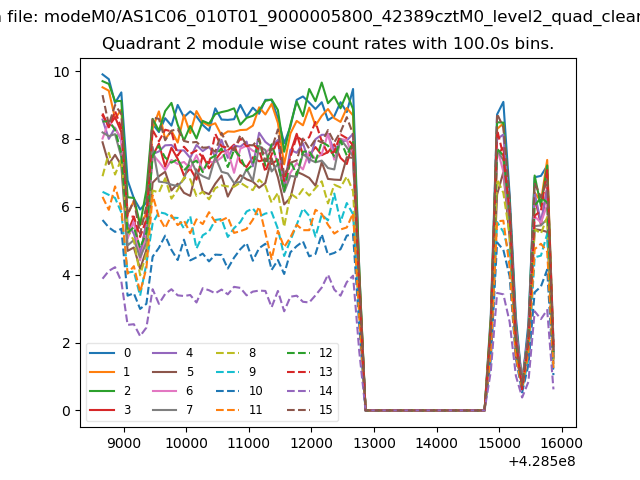
| Module-wise count rates for Quadrant B Data is divided into 100 sec bins |
 |
 |
| Module-wise count rates for Quadrant C Data is divided into 100 sec bins |
 |
 |
| Module-wise count rates for Quadrant D Data is divided into 100 sec bins |
 |
 |
| Parameter | Plot |
|---|---|
| CZT HV Monitor | 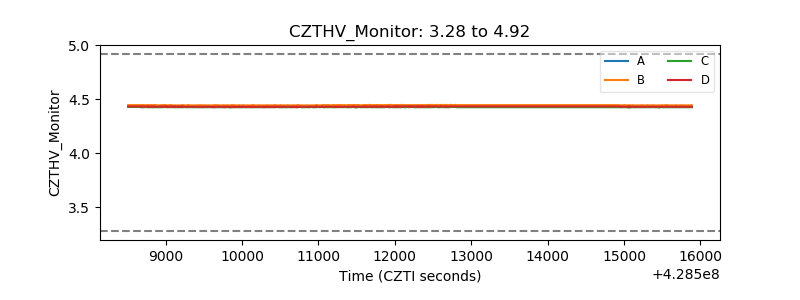 |
| D_VDD | 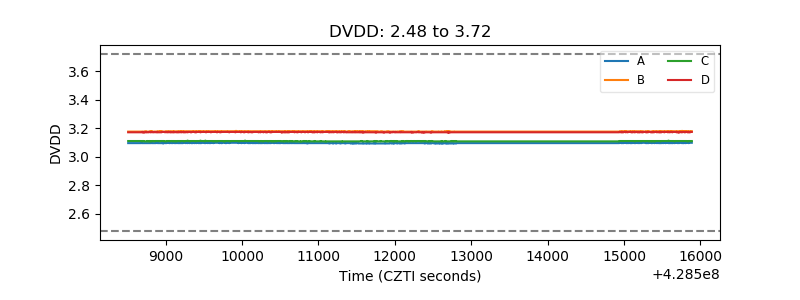 |
| Temperature 1 | 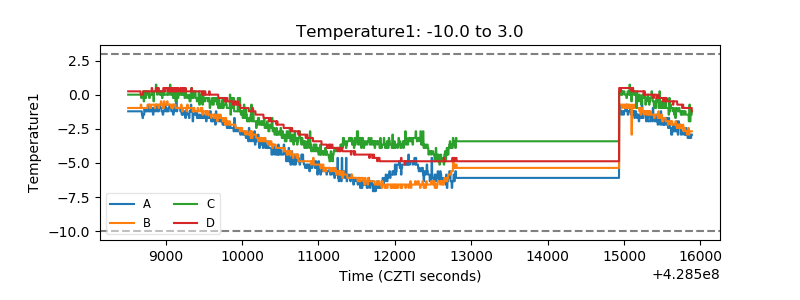 |
| Veto HV Monitor | 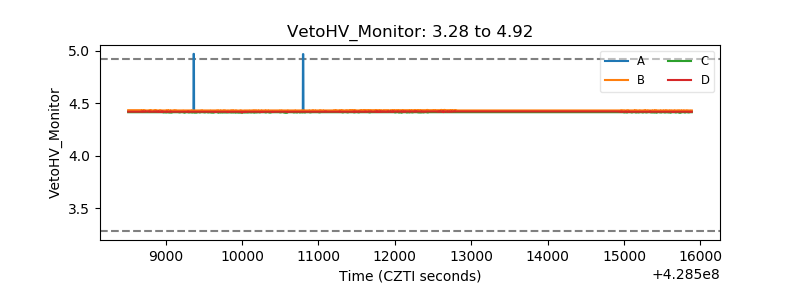 |
| Veto LLD | 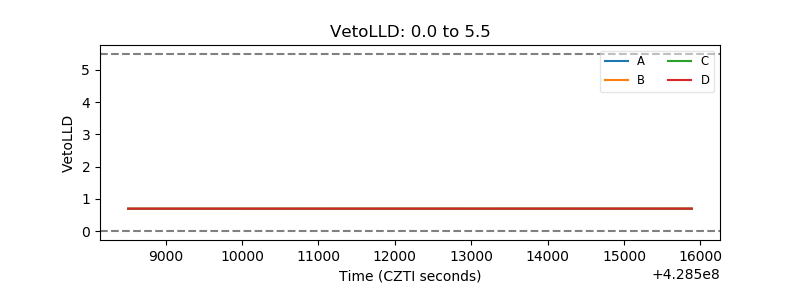 |
| Alpha Counter | 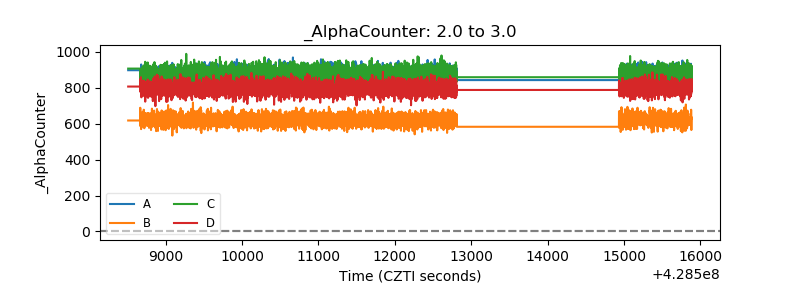 |
| _CPM_Rate | 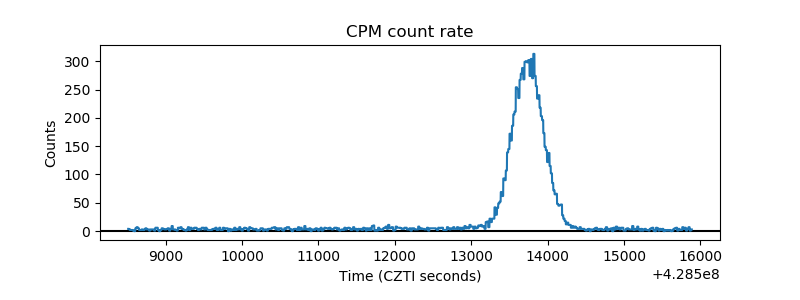 |
| CZT Counter | 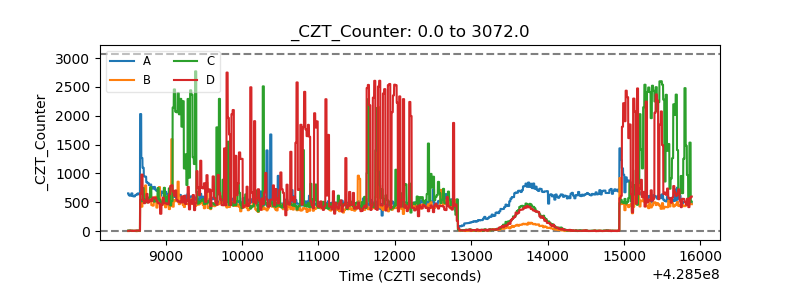 |
| +2.5 Volts monitor | 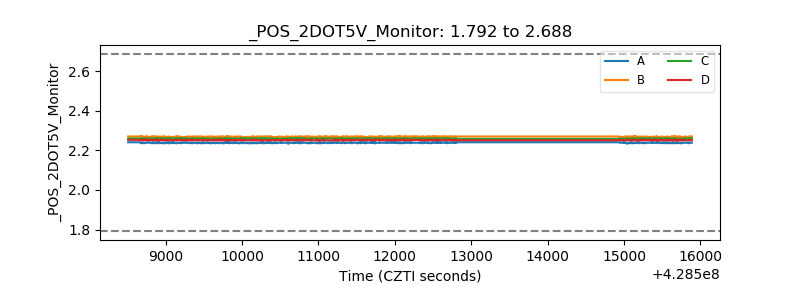 |
| +5 Volts monitor | 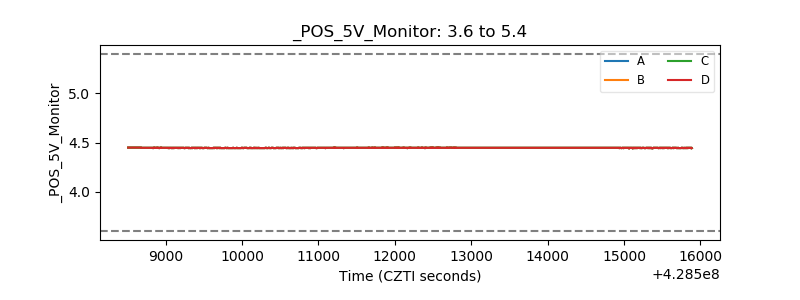 |
| _ROLL_ROT | 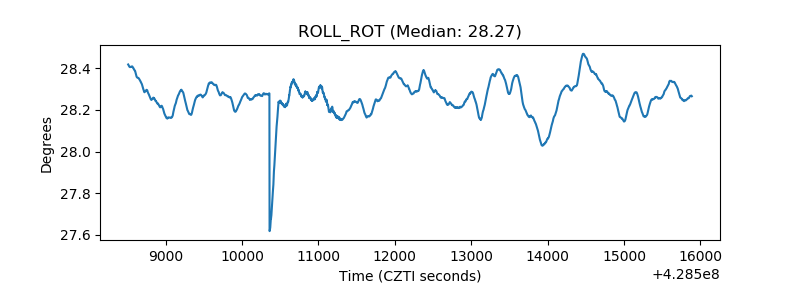 |
| _Roll_DEC | 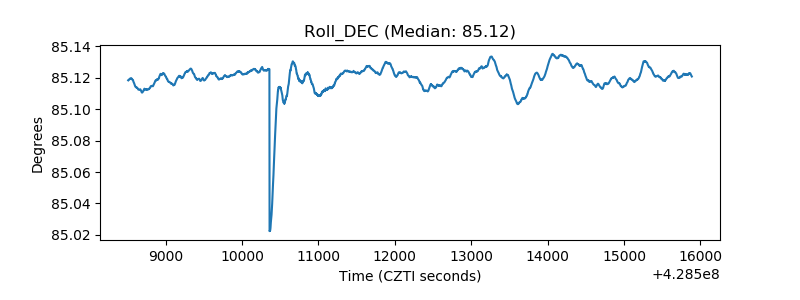 |
| _Roll_RA | 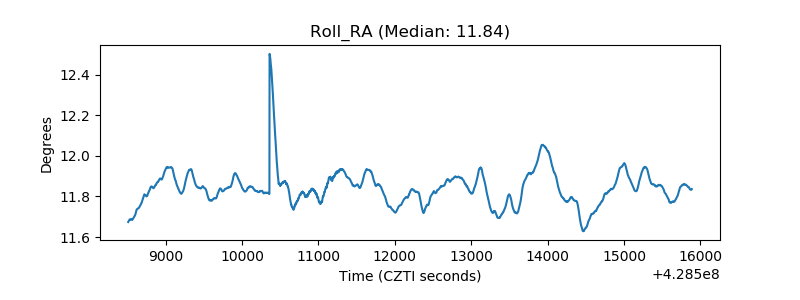 |
| Veto Counter | 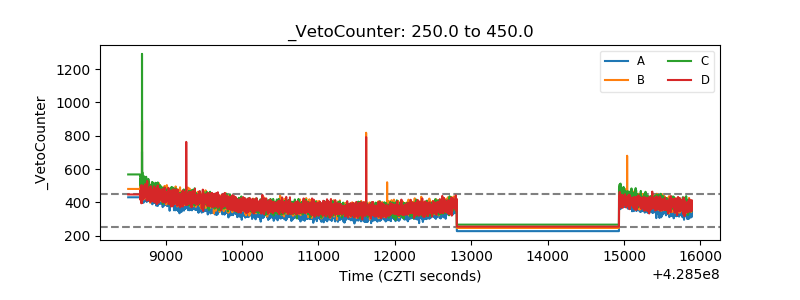 |