| Param | Original file | Final file |
|---|---|---|
| Filename | modeM0/AS1C06_010T01_9000005800_42390cztM0_level2.fits | modeM0/AS1C06_010T01_9000005800_42390cztM0_level2_quad_clean.evt |
| Size (bytes) | 339,577,920 | 82,172,160 |
| Size | 323.8 MB | 78.4 MB |
| Events in quadrant A | 2,853,887 | 568,084 |
| Events in quadrant B | 2,249,154 | 567,758 |
| Events in quadrant C | 3,367,832 | 516,367 |
| Events in quadrant D | 3,704,966 | 481,286 |
| Mode M9 | |||
|---|---|---|---|
| Quadrant | BADHDUFLAG | Total packets | Discarded packets |
| A | 0 | 23 | 0 |
| B | 0 | 24 | 0 |
| C | 0 | 24 | 0 |
| D | 0 | 24 | 0 |
| Mode M0 | |||
|---|---|---|---|
| Quadrant | BADHDUFLAG | Total packets | Discarded packets |
| A | 0 | 11572 | 2 |
| B | 0 | 10367 | 3 |
| C | 0 | 13409 | 2 |
| D | 0 | 14516 | 2 |
| Mode SS | |||
|---|---|---|---|
| Quadrant | BADHDUFLAG | Total packets | Discarded packets |
| A | 0 | 104 | 0 |
| B | 0 | 104 | 0 |
| C | 0 | 104 | 0 |
| D | 0 | 104 | 0 |
| Quadrant | Total seconds | Saturated seconds | Saturation percentage |
|---|---|---|---|
| A | 5057 | 38 | 0.751434% |
| B | 5056 | 12 | 0.237342% |
| C | 5056 | 371 | 7.337816% |
| D | 5056 | 424 | 8.386076% |
Noise dominated data is calculated using 1-second bins in cleaned event files. If a bin has >2000 counts, and if more than 50% of those come from <1% of pixels, then it is considered to be noise-dominated and hence unusable.
| Quadrant | # 1 sec bins | Bins with >0 counts | Bins with >2000 counts | High rate bins dominated by noise | Noise dominated (total time) | Noise dominated (detector-on time) | Marked lightcurve |
|---|---|---|---|---|---|---|---|
| A | 7000 | 5058 | 25 | 25 | 0.36% | 0.49% | 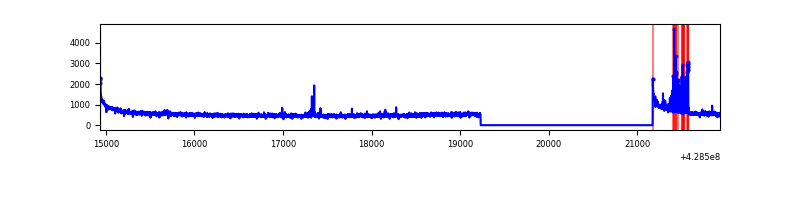 |
| B | 6999 | 5057 | 4 | 4 | 0.06% | 0.08% | 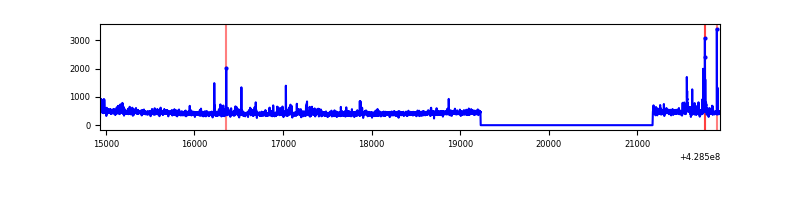 |
| C | 6999 | 5057 | 287 | 287 | 4.10% | 5.68% | 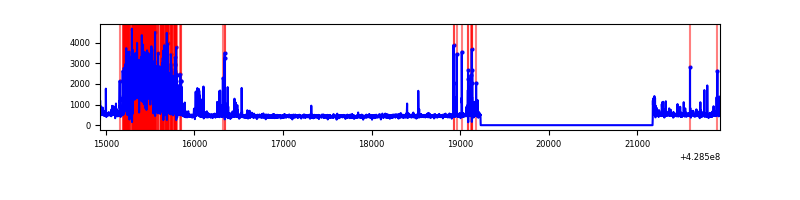 |
| D | 6999 | 5057 | 413 | 413 | 5.90% | 8.17% | 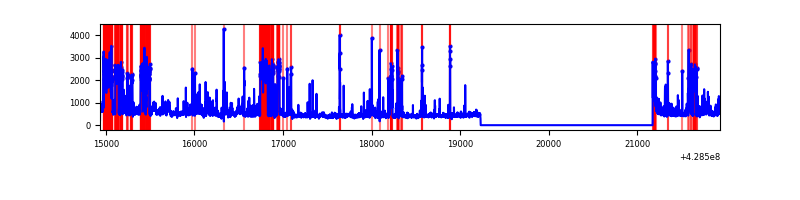 |
Top three noisy pixels from each quadrant. If the there are fewer than three noisy pixels in the level2.evt file, extra rows are filled as -1
| Pixel properties | Quadrant properties | ||||||
|---|---|---|---|---|---|---|---|
| Quadrant | DetID | PixID | Counts | Sigma | Mean | Median | Sigma |
| A | 10 | 83 | 599240 | 5445.75 | 536 | 526 | 109.9 |
| A | 14 | 223 | 134824 | 1221.54 | 536 | 526 | 109.9 |
| A | 15 | 235 | 14731 | 129.2 | 536 | 526 | 109.9 |
| B | 0 | 245 | 44783 | 436.07 | 532 | 518 | 101.5 |
| B | 0 | 230 | 25083 | 242.0 | 532 | 518 | 101.5 |
| B | 5 | 255 | 21319 | 204.92 | 532 | 518 | 101.5 |
| C | 4 | 254 | 1089498 | 9189.43 | 505 | 507 | 118.5 |
| C | 15 | 214 | 205693 | 1731.46 | 505 | 507 | 118.5 |
| C | 14 | 254 | 85547 | 717.61 | 505 | 507 | 118.5 |
| D | 2 | 16 | 907097 | 7068.25 | 520 | 504 | 128.3 |
| D | 1 | 52 | 288146 | 2242.6 | 520 | 504 | 128.3 |
| D | 12 | 233 | 142886 | 1110.08 | 520 | 504 | 128.3 |
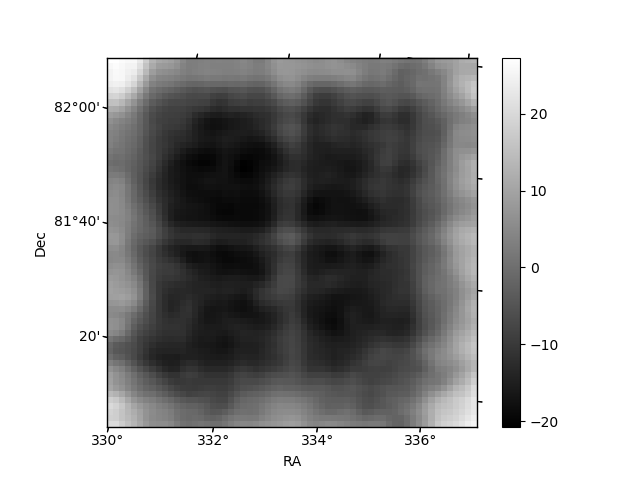
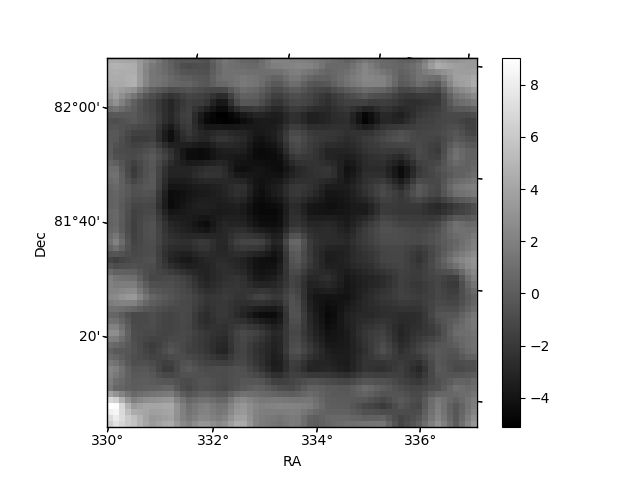
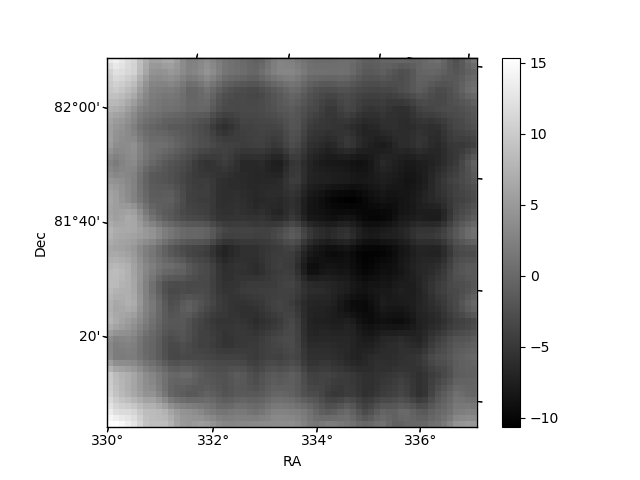
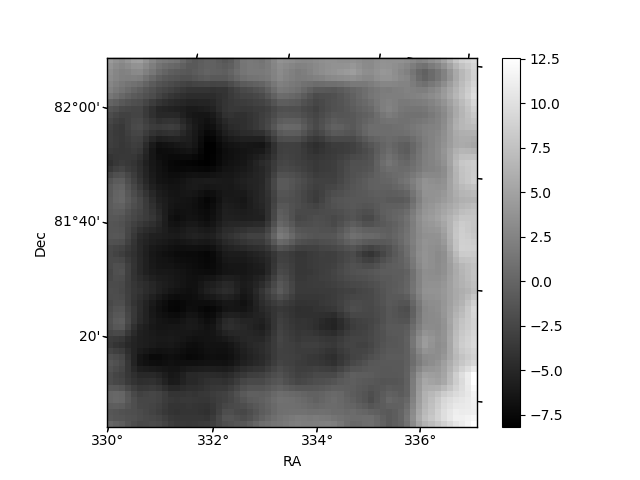
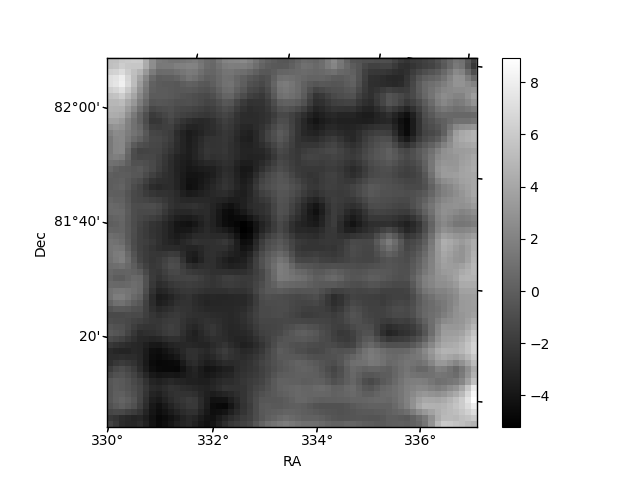
Histogram calculated using DETX and DETY for each event in the final _common_clean file
| Quadrant A | 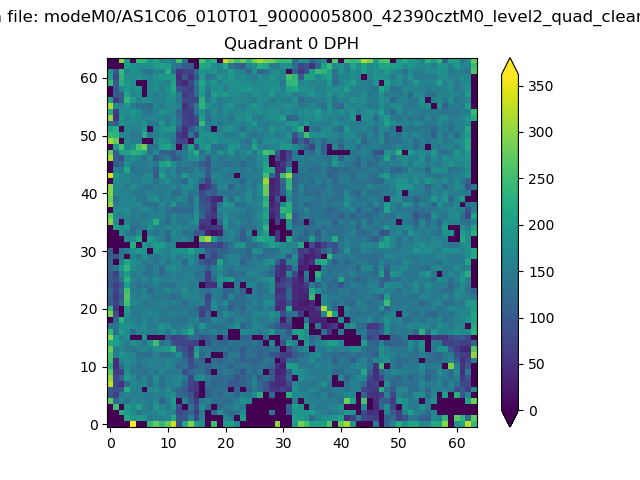 |
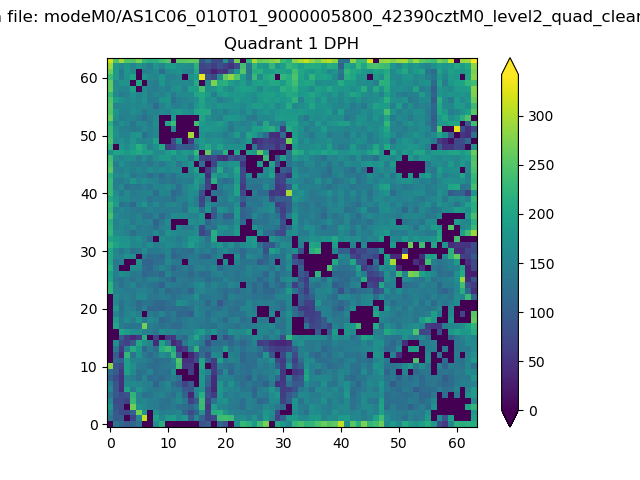 |
Quadrant B |
|---|---|---|---|
| Quadrant D | 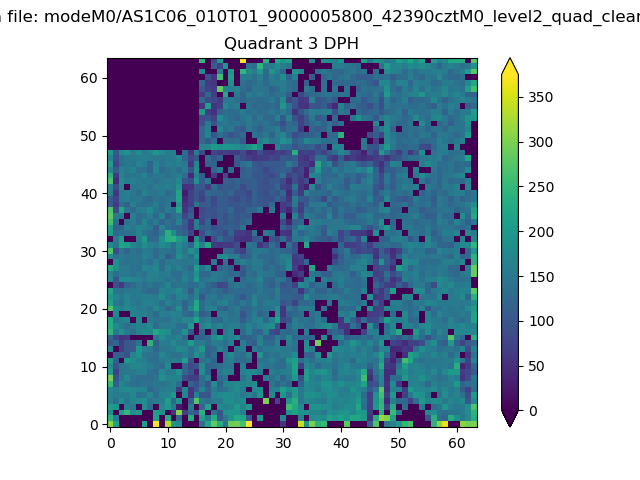 |
 |
Quadrant C |
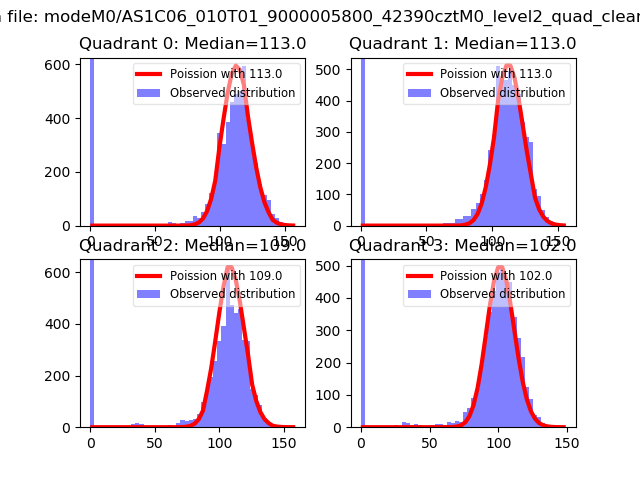
| Plot type | Count rate plots | Images |
|---|---|---|
| Comparison with Poisson distribution Blue bars denote a histogram of data divided into 1 sec bins. Red curve is a Poisson curve with rate = median count rate of data. |
 |
 |
| Quadrant-wise count rates Data is divided into 100 sec bins |
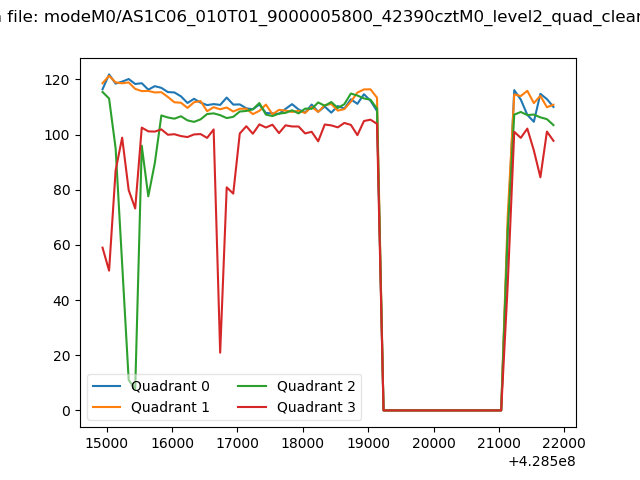 |
|
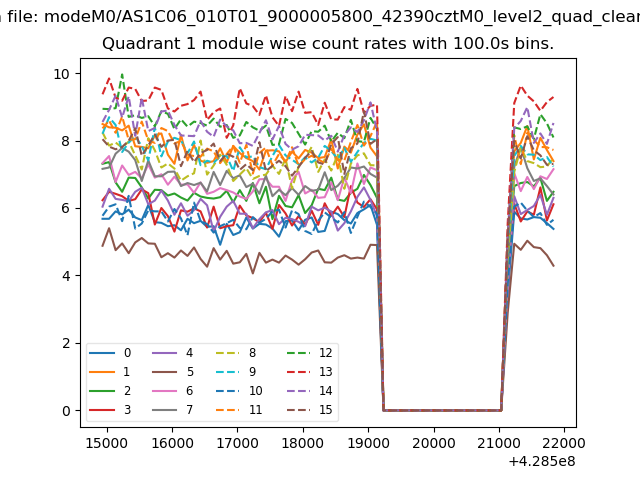
| Module-wise count rates for Quadrant A Data is divided into 100 sec bins |
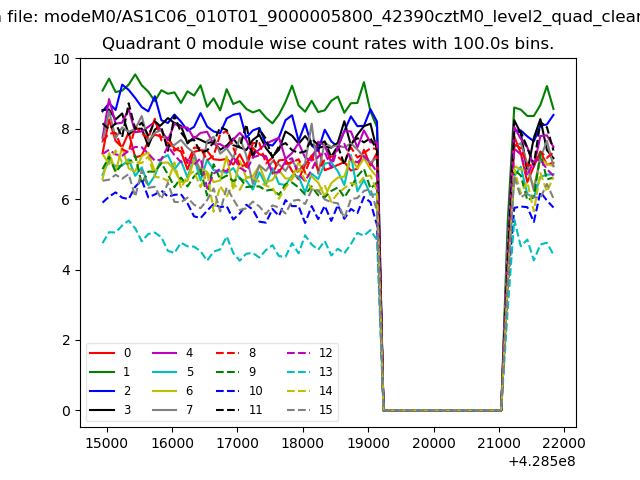 |
 |
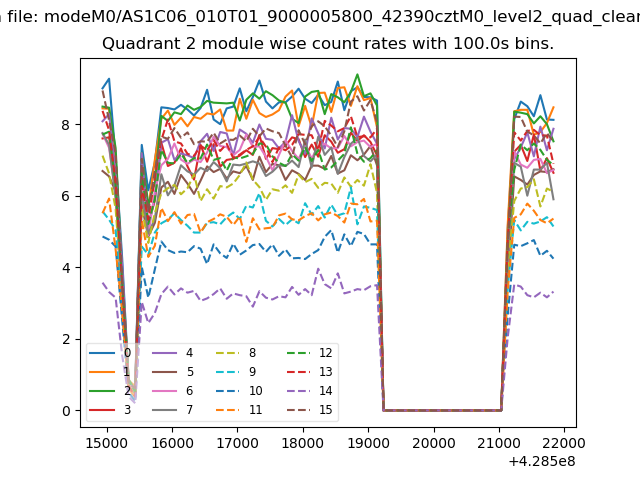
| Module-wise count rates for Quadrant B Data is divided into 100 sec bins |
 |
 |
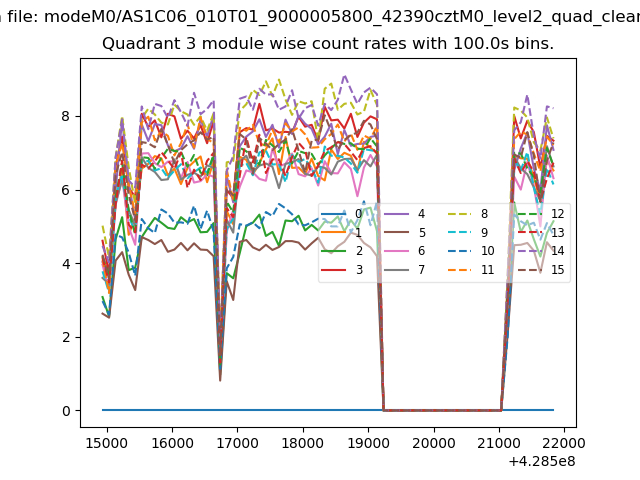
| Module-wise count rates for Quadrant C Data is divided into 100 sec bins |
 |
 |
| Module-wise count rates for Quadrant D Data is divided into 100 sec bins |
 |
 |
| Parameter | Plot |
|---|---|
| CZT HV Monitor | 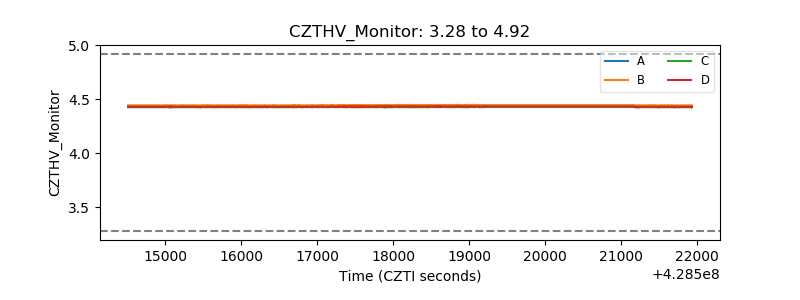 |
| D_VDD | 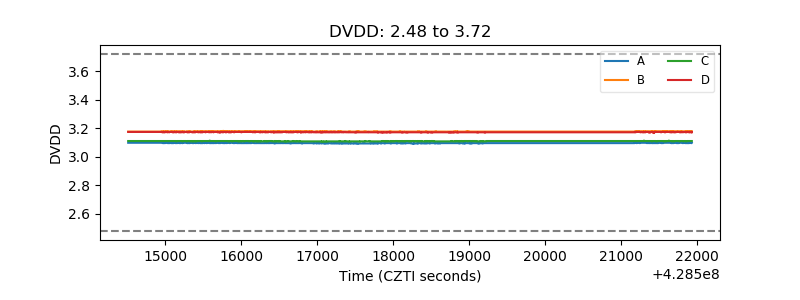 |
| Temperature 1 | 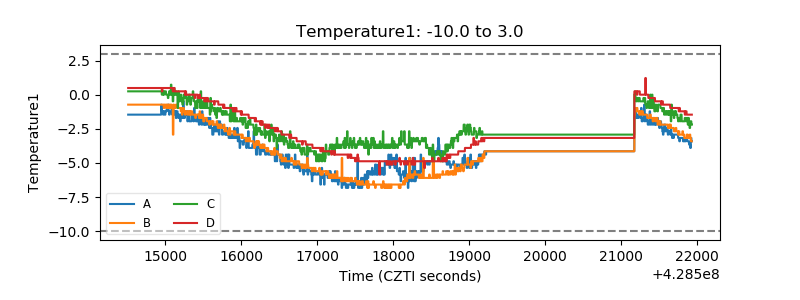 |
| Veto HV Monitor | 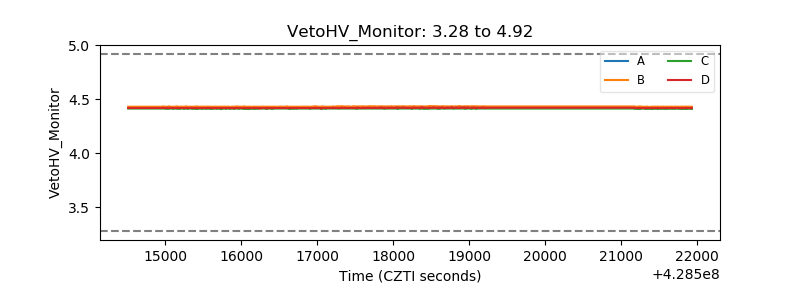 |
| Veto LLD | 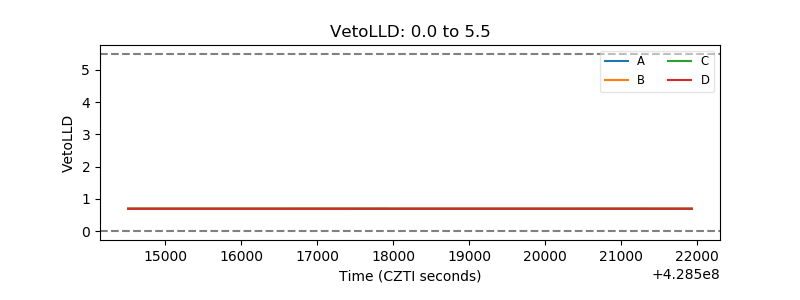 |
| Alpha Counter | 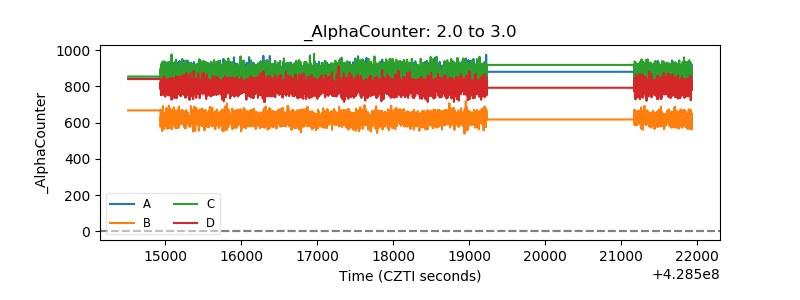 |
| _CPM_Rate | 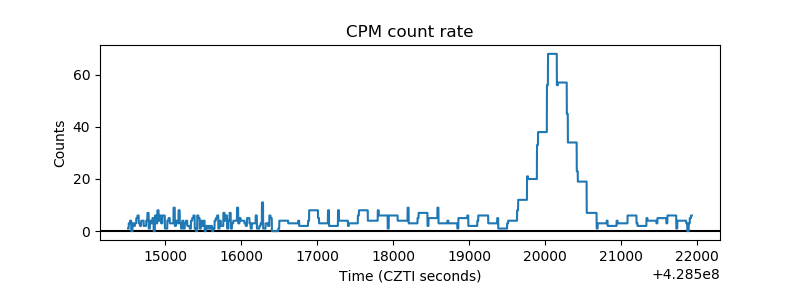 |
| CZT Counter | 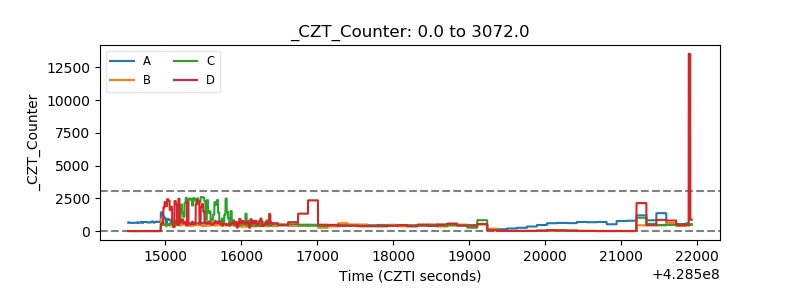 |
| +2.5 Volts monitor | 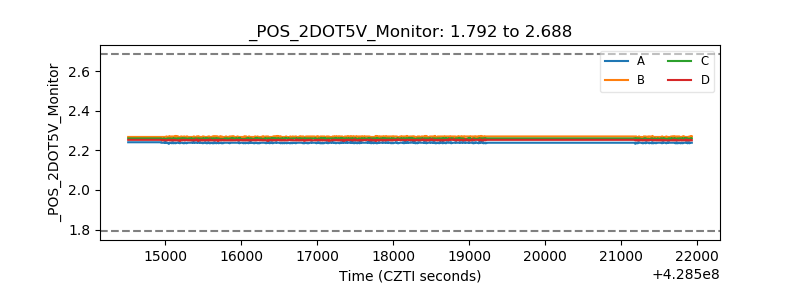 |
| +5 Volts monitor | 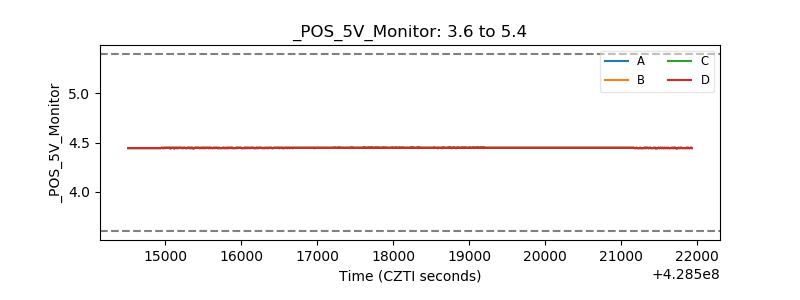 |
| _ROLL_ROT | 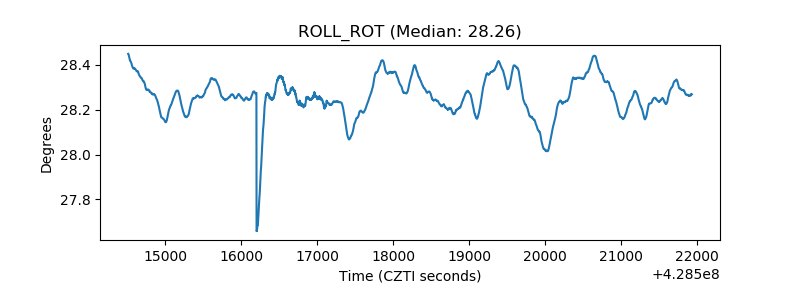 |
| _Roll_DEC | 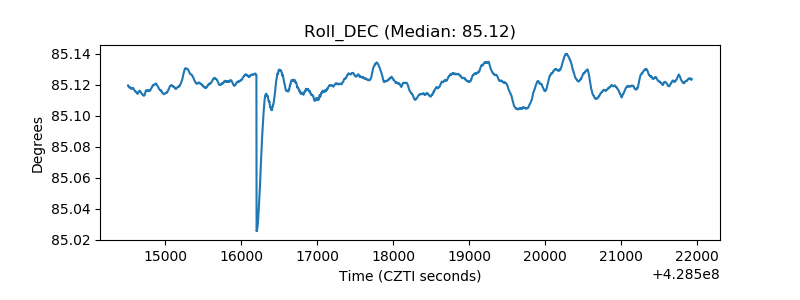 |
| _Roll_RA | 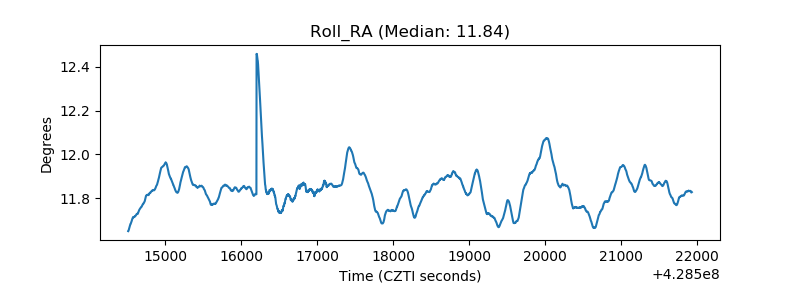 |
| Veto Counter | 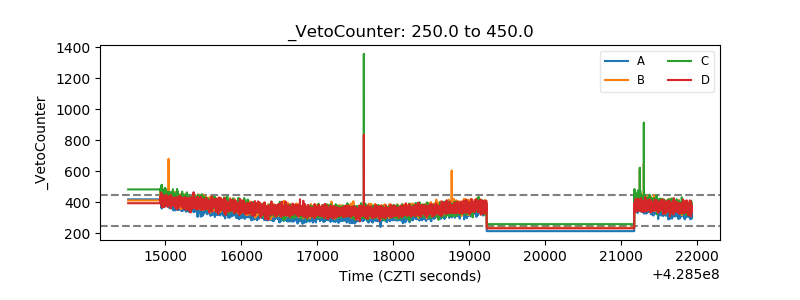 |