| Param | Original file | Final file |
|---|---|---|
| Filename | modeM0/AS1C06_010T01_9000005800_42391cztM0_level2.fits | modeM0/AS1C06_010T01_9000005800_42391cztM0_level2_quad_clean.evt |
| Size (bytes) | 351,014,400 | 90,155,520 |
| Size | 334.8 MB | 86.0 MB |
| Events in quadrant A | 3,117,553 | 603,208 |
| Events in quadrant B | 2,657,734 | 604,107 |
| Events in quadrant C | 3,118,348 | 588,789 |
| Events in quadrant D | 3,667,802 | 545,731 |
| Mode M9 | |||
|---|---|---|---|
| Quadrant | BADHDUFLAG | Total packets | Discarded packets |
| A | 0 | 22 | 0 |
| B | 0 | 23 | 0 |
| C | 0 | 23 | 0 |
| D | 0 | 23 | 0 |
| Mode M0 | |||
|---|---|---|---|
| Quadrant | BADHDUFLAG | Total packets | Discarded packets |
| A | 0 | 12713 | 2 |
| B | 0 | 12019 | 2 |
| C | 0 | 12919 | 2 |
| D | 0 | 14878 | 2 |
| Mode SS | |||
|---|---|---|---|
| Quadrant | BADHDUFLAG | Total packets | Discarded packets |
| A | 0 | 112 | 0 |
| B | 0 | 112 | 0 |
| C | 0 | 112 | 0 |
| D | 0 | 112 | 0 |
| Quadrant | Total seconds | Saturated seconds | Saturation percentage |
|---|---|---|---|
| A | 5547 | 55 | 0.991527% |
| B | 5547 | 61 | 1.099694% |
| C | 5547 | 89 | 1.604471% |
| D | 5546 | 198 | 3.570141% |
Noise dominated data is calculated using 1-second bins in cleaned event files. If a bin has >2000 counts, and if more than 50% of those come from <1% of pixels, then it is considered to be noise-dominated and hence unusable.
| Quadrant | # 1 sec bins | Bins with >0 counts | Bins with >2000 counts | High rate bins dominated by noise | Noise dominated (total time) | Noise dominated (detector-on time) | Marked lightcurve |
|---|---|---|---|---|---|---|---|
| A | 7130 | 5548 | 32 | 32 | 0.45% | 0.58% | 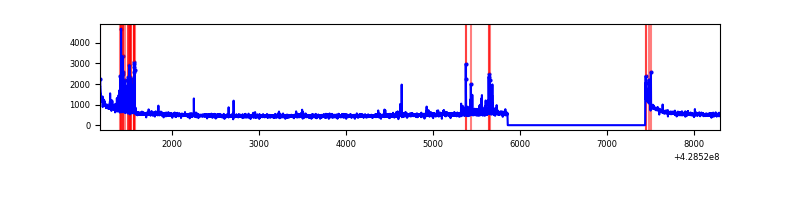 |
| B | 7130 | 5548 | 34 | 34 | 0.48% | 0.61% | 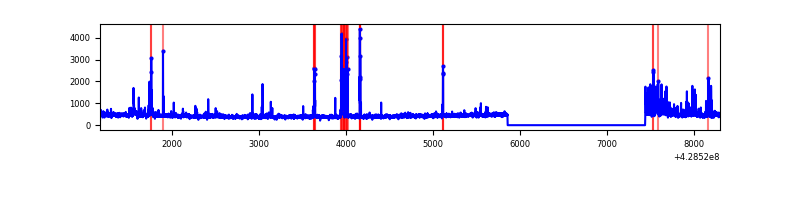 |
| C | 7130 | 5548 | 66 | 66 | 0.93% | 1.19% | 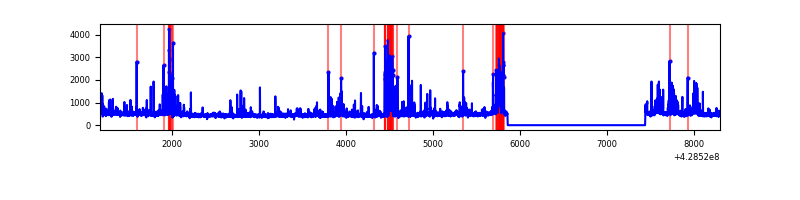 |
| D | 7129 | 5547 | 262 | 262 | 3.68% | 4.72% | 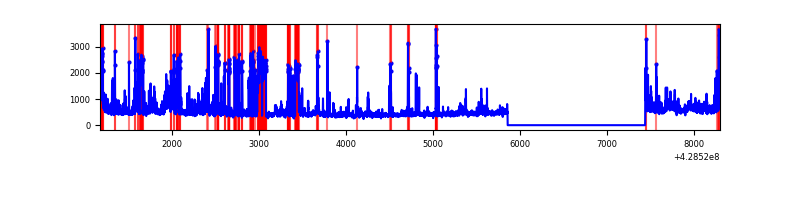 |
Top three noisy pixels from each quadrant. If the there are fewer than three noisy pixels in the level2.evt file, extra rows are filled as -1
| Pixel properties | Quadrant properties | ||||||
|---|---|---|---|---|---|---|---|
| Quadrant | DetID | PixID | Counts | Sigma | Mean | Median | Sigma |
| A | 10 | 83 | 626319 | 5202.06 | 582 | 569 | 120.3 |
| A | 14 | 223 | 216660 | 1796.43 | 582 | 569 | 120.3 |
| A | 13 | 6 | 11358 | 89.69 | 582 | 569 | 120.3 |
| B | 5 | 172 | 136238 | 1224.07 | 578 | 562 | 110.8 |
| B | 5 | 255 | 97425 | 873.9 | 578 | 562 | 110.8 |
| B | 4 | 81 | 57745 | 515.91 | 578 | 562 | 110.8 |
| C | 4 | 254 | 482693 | 3621.03 | 571 | 573 | 133.1 |
| C | 15 | 214 | 229642 | 1720.45 | 571 | 573 | 133.1 |
| C | 14 | 254 | 144272 | 1079.27 | 571 | 573 | 133.1 |
| D | 2 | 16 | 527877 | 3762.01 | 572 | 556 | 140.2 |
| D | 1 | 52 | 386930 | 2756.46 | 572 | 556 | 140.2 |
| D | 12 | 233 | 161798 | 1150.33 | 572 | 556 | 140.2 |
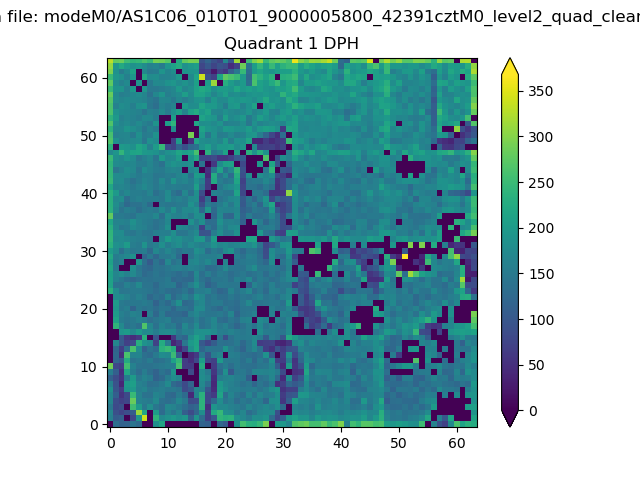
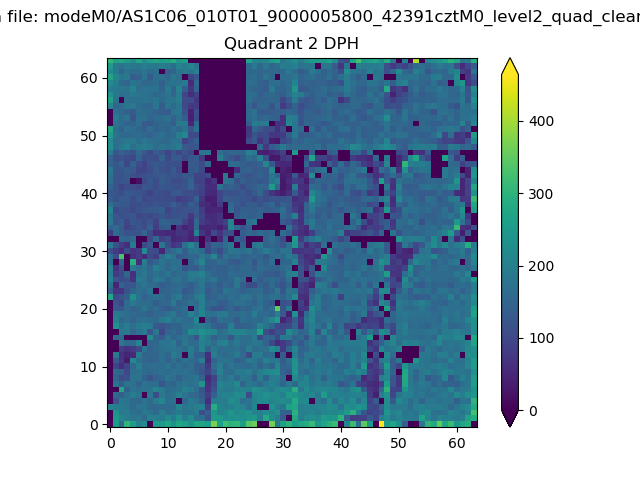
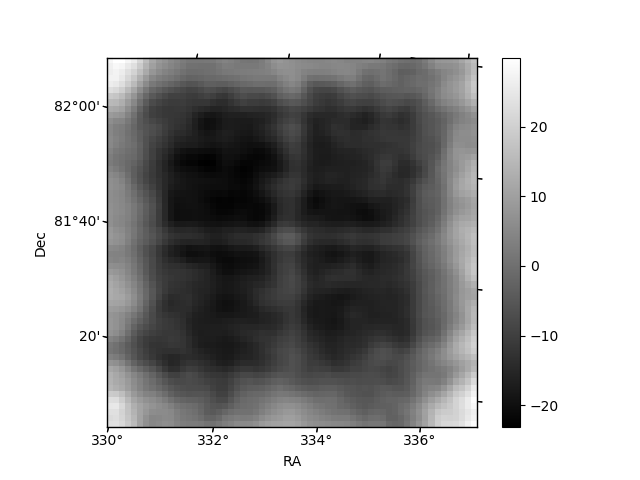
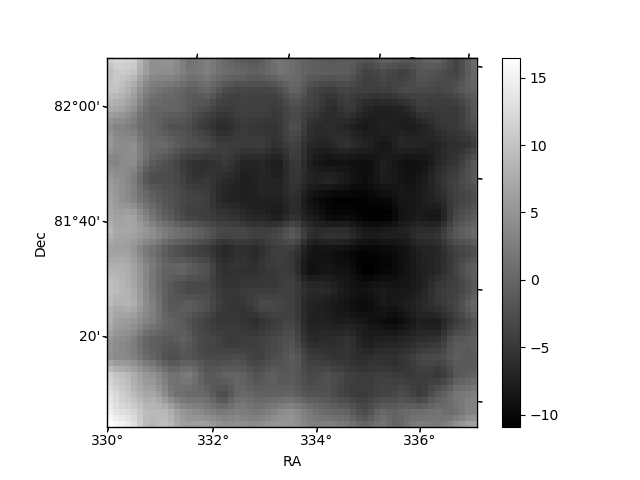
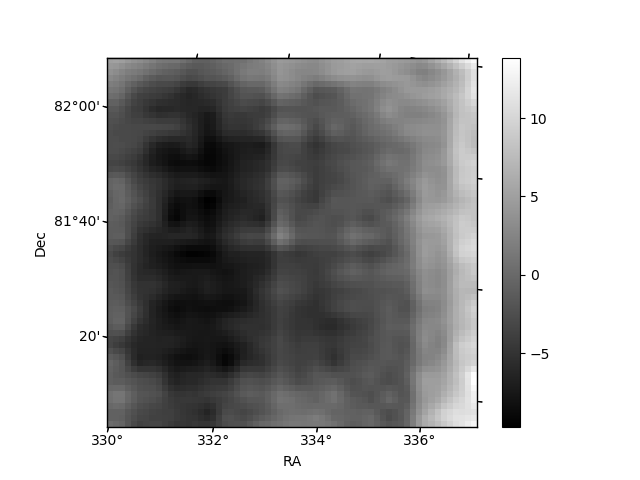
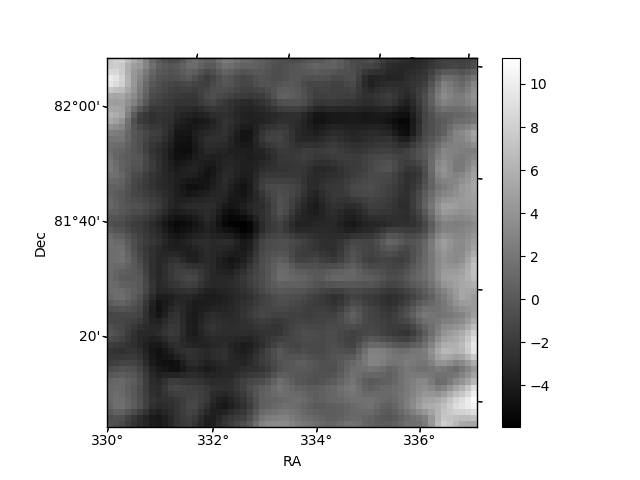
Histogram calculated using DETX and DETY for each event in the final _common_clean file
| Quadrant A | 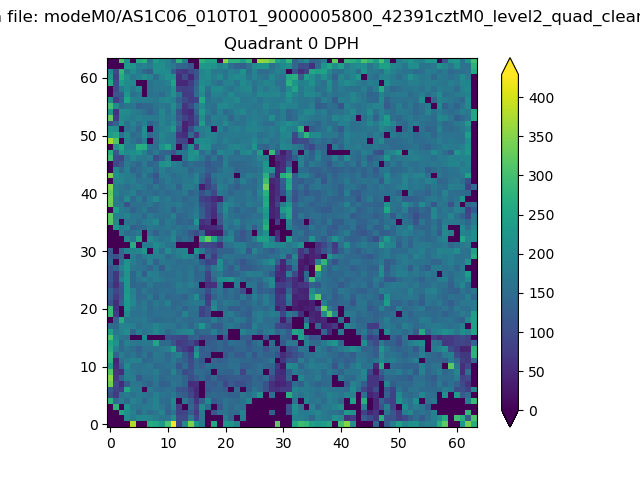 |
 |
Quadrant B |
|---|---|---|---|
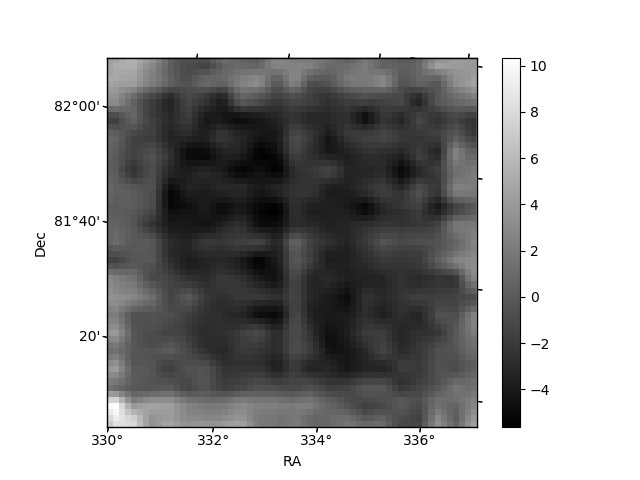
| Quadrant D |  |
 |
Quadrant C |
| Plot type | Count rate plots | Images |
|---|---|---|
| Comparison with Poisson distribution Blue bars denote a histogram of data divided into 1 sec bins. Red curve is a Poisson curve with rate = median count rate of data. |
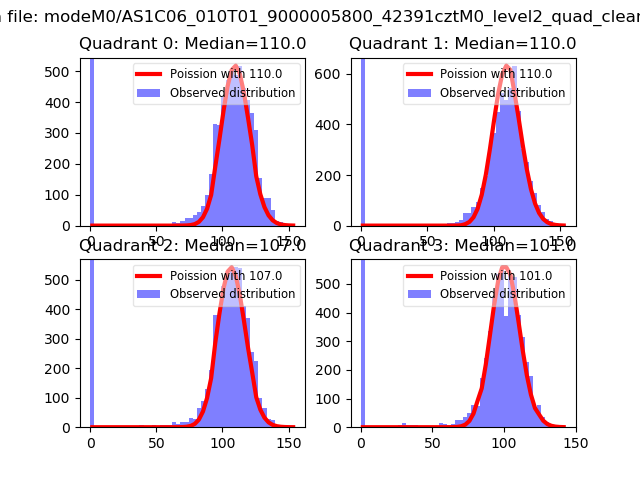 |
 |
| Quadrant-wise count rates Data is divided into 100 sec bins |
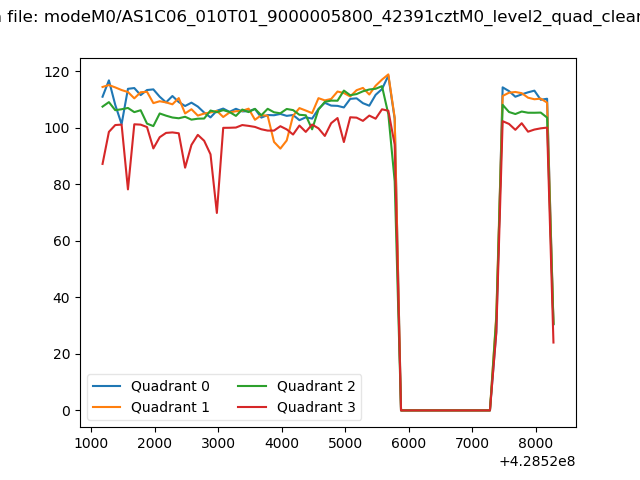 |
|
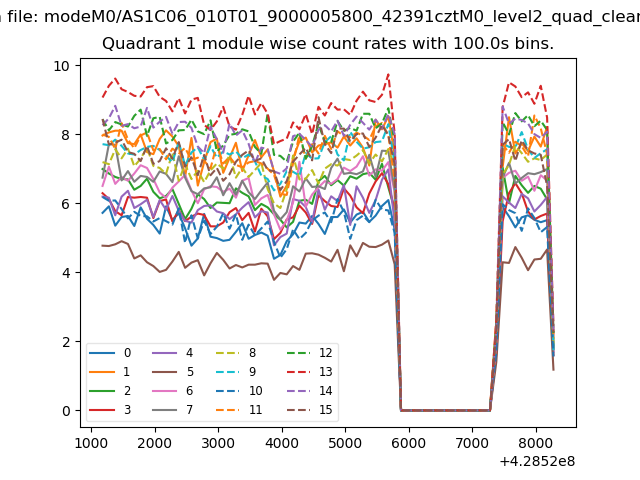
| Module-wise count rates for Quadrant A Data is divided into 100 sec bins |
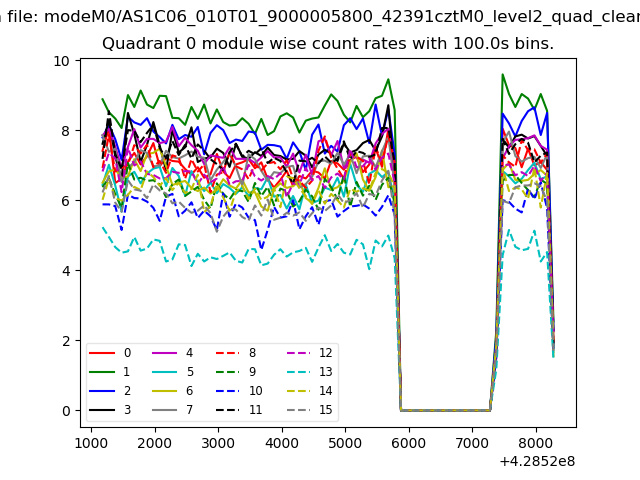 |
 |
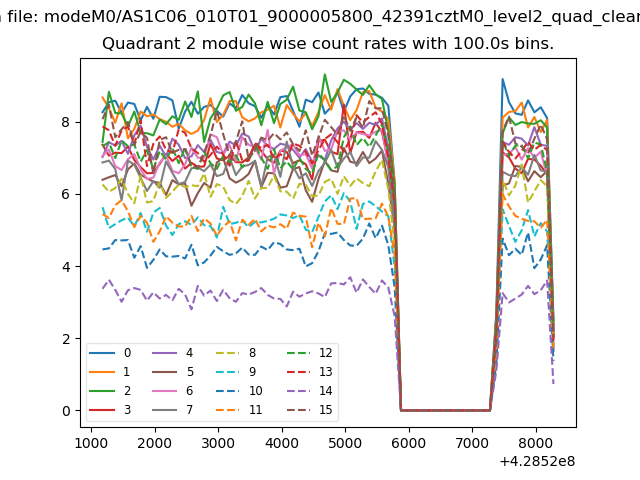
| Module-wise count rates for Quadrant B Data is divided into 100 sec bins |
 |
 |
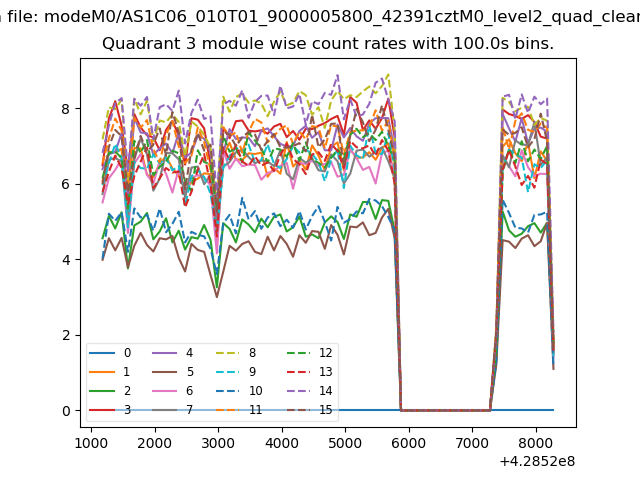
| Module-wise count rates for Quadrant C Data is divided into 100 sec bins |
 |
 |
| Module-wise count rates for Quadrant D Data is divided into 100 sec bins |
 |
 |
| Parameter | Plot |
|---|---|
| CZT HV Monitor | 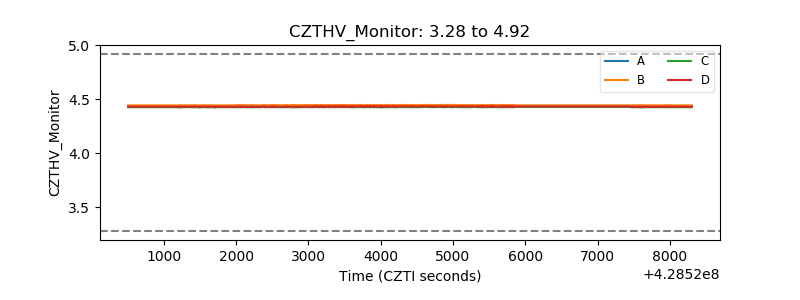 |
| D_VDD | 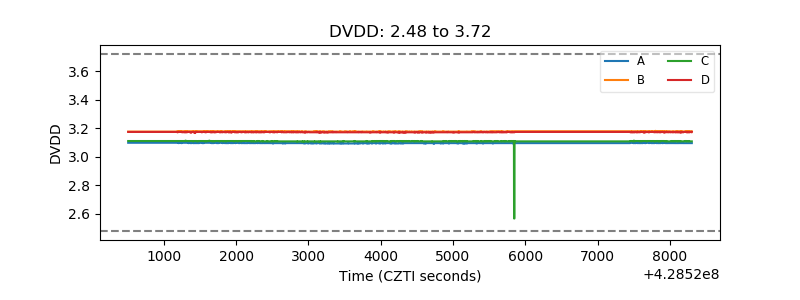 |
| Temperature 1 | 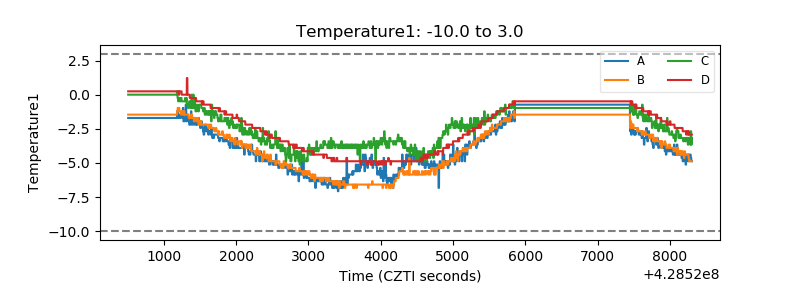 |
| Veto HV Monitor |  |
| Veto LLD | 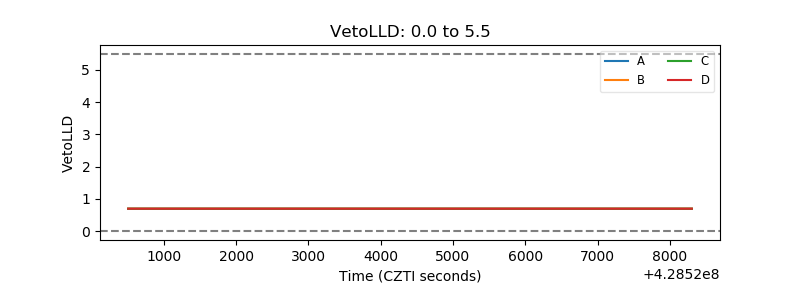 |
| Alpha Counter | 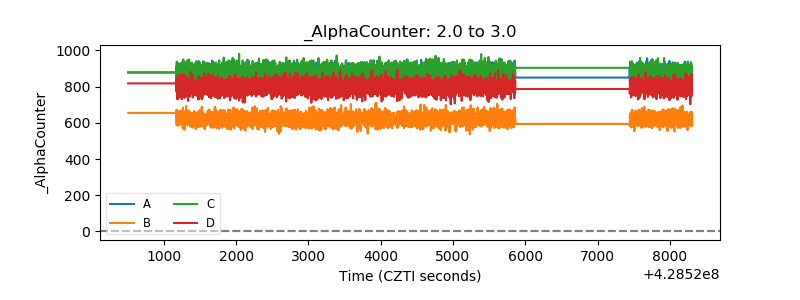 |
| _CPM_Rate | 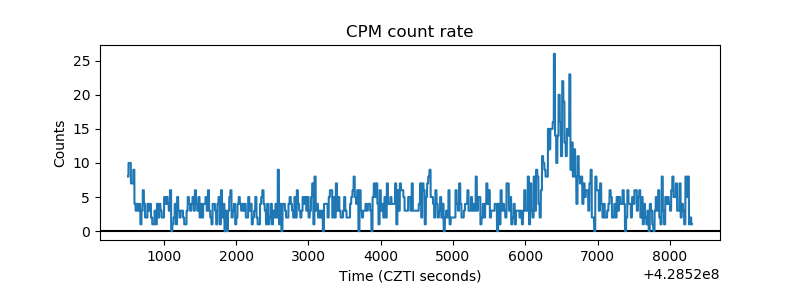 |
| CZT Counter | 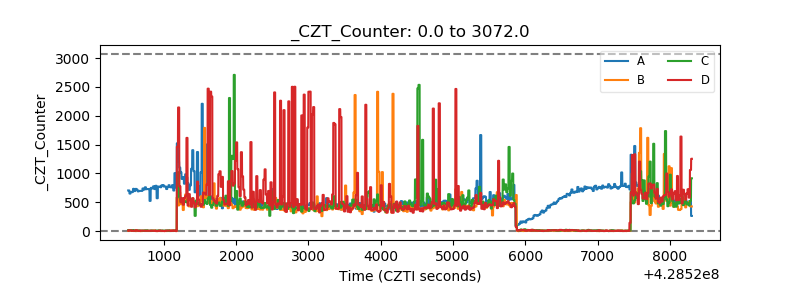 |
| +2.5 Volts monitor | 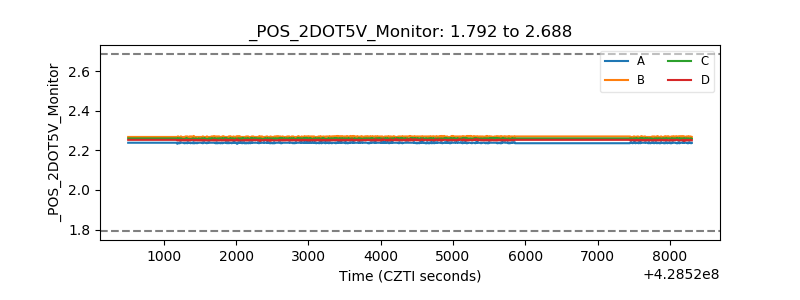 |
| +5 Volts monitor | 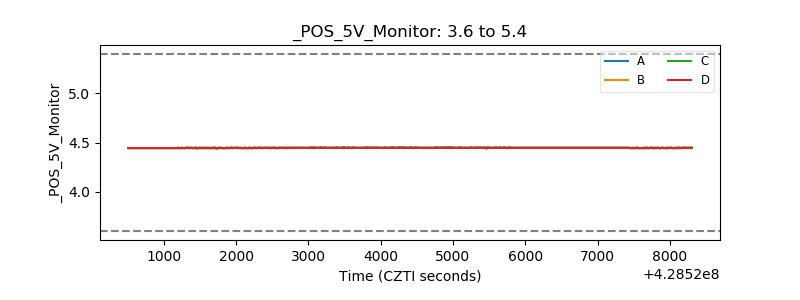 |
| _ROLL_ROT | 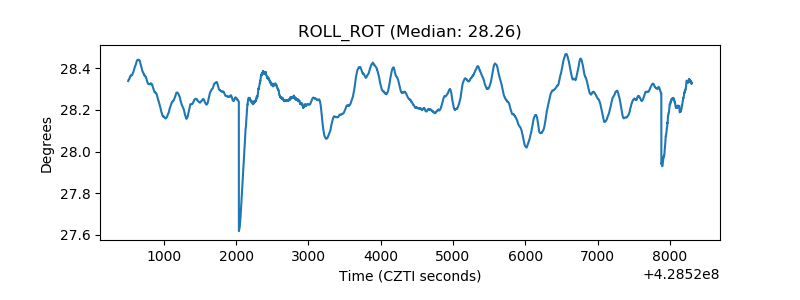 |
| _Roll_DEC | 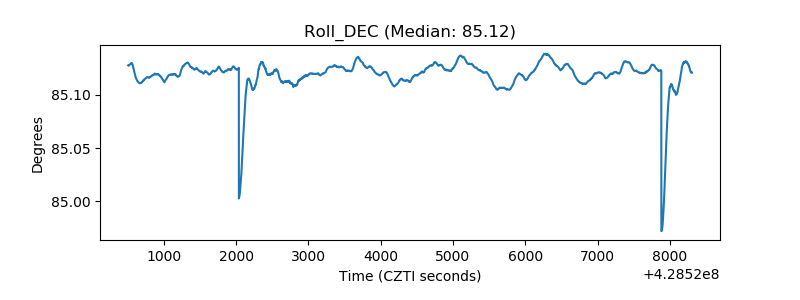 |
| _Roll_RA | 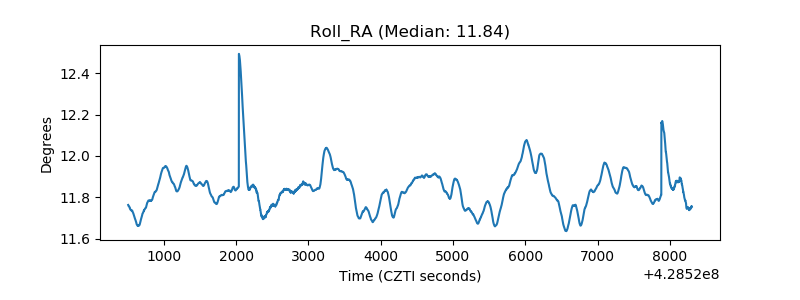 |
| Veto Counter | 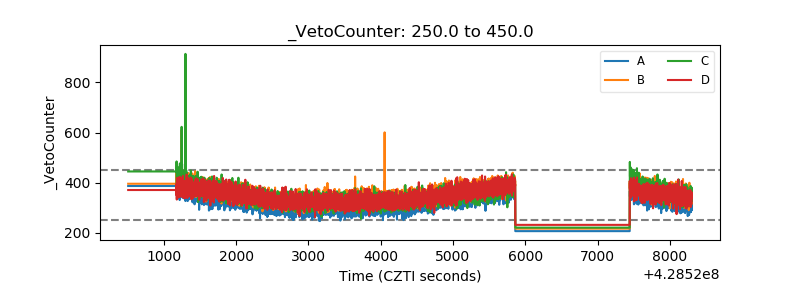 |