| Param | Original file | Final file |
|---|---|---|
| Filename | modeM0/AS1C06_010T01_9000005800_42392cztM0_level2.fits | modeM0/AS1C06_010T01_9000005800_42392cztM0_level2_quad_clean.evt |
| Size (bytes) | 338,178,240 | 92,062,080 |
| Size | 322.5 MB | 87.8 MB |
| Events in quadrant A | 3,037,762 | 614,414 |
| Events in quadrant B | 2,806,907 | 613,468 |
| Events in quadrant C | 3,136,890 | 601,683 |
| Events in quadrant D | 3,095,791 | 562,233 |
| Mode M9 | |||
|---|---|---|---|
| Quadrant | BADHDUFLAG | Total packets | Discarded packets |
| A | 0 | 24 | 0 |
| B | 0 | 25 | 0 |
| C | 0 | 25 | 0 |
| D | 0 | 25 | 0 |
| Mode M0 | |||
|---|---|---|---|
| Quadrant | BADHDUFLAG | Total packets | Discarded packets |
| A | 0 | 12666 | 2 |
| B | 0 | 12465 | 2 |
| C | 0 | 13026 | 2 |
| D | 0 | 13270 | 2 |
| Mode SS | |||
|---|---|---|---|
| Quadrant | BADHDUFLAG | Total packets | Discarded packets |
| A | 0 | 114 | 0 |
| B | 0 | 114 | 0 |
| C | 0 | 114 | 0 |
| D | 0 | 114 | 0 |
| Quadrant | Total seconds | Saturated seconds | Saturation percentage |
|---|---|---|---|
| A | 5660 | 22 | 0.388693% |
| B | 5660 | 75 | 1.325088% |
| C | 5660 | 52 | 0.918728% |
| D | 5660 | 66 | 1.166078% |
Noise dominated data is calculated using 1-second bins in cleaned event files. If a bin has >2000 counts, and if more than 50% of those come from <1% of pixels, then it is considered to be noise-dominated and hence unusable.
| Quadrant | # 1 sec bins | Bins with >0 counts | Bins with >2000 counts | High rate bins dominated by noise | Noise dominated (total time) | Noise dominated (detector-on time) | Marked lightcurve |
|---|---|---|---|---|---|---|---|
| A | 7033 | 5661 | 7 | 7 | 0.10% | 0.12% | 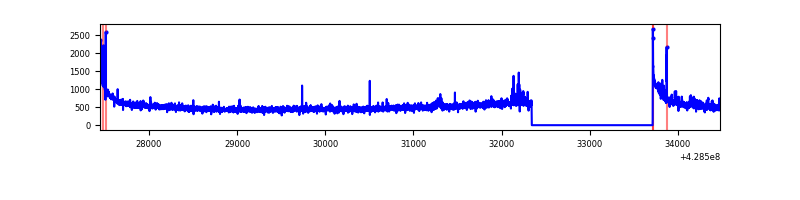 |
| B | 7033 | 5661 | 41 | 41 | 0.58% | 0.72% | 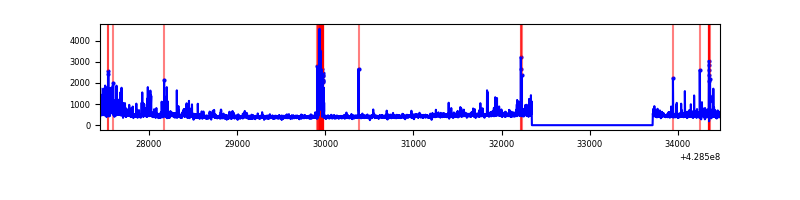 |
| C | 7033 | 5661 | 42 | 42 | 0.60% | 0.74% | 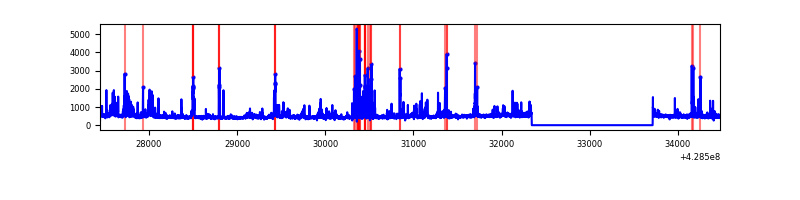 |
| D | 7033 | 5661 | 46 | 46 | 0.65% | 0.81% | 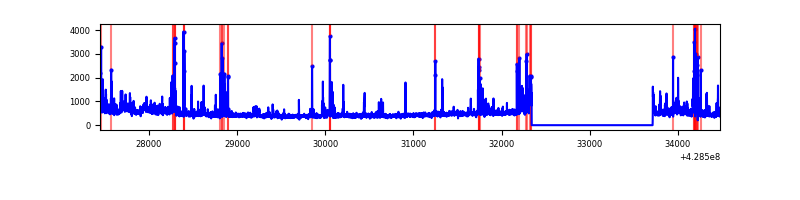 |
Top three noisy pixels from each quadrant. If the there are fewer than three noisy pixels in the level2.evt file, extra rows are filled as -1
| Pixel properties | Quadrant properties | ||||||
|---|---|---|---|---|---|---|---|
| Quadrant | DetID | PixID | Counts | Sigma | Mean | Median | Sigma |
| A | 10 | 83 | 618214 | 4951.76 | 598 | 585 | 124.7 |
| A | 14 | 223 | 54050 | 428.64 | 598 | 585 | 124.7 |
| A | 3 | 1 | 16533 | 127.86 | 598 | 585 | 124.7 |
| B | 5 | 172 | 169946 | 1489.97 | 590 | 573 | 113.7 |
| B | 5 | 255 | 73809 | 644.26 | 590 | 573 | 113.7 |
| B | 15 | 35 | 68271 | 595.54 | 590 | 573 | 113.7 |
| C | 4 | 254 | 543067 | 3965.27 | 583 | 586 | 136.8 |
| C | 15 | 214 | 232712 | 1696.73 | 583 | 586 | 136.8 |
| C | 14 | 254 | 61689 | 446.63 | 583 | 586 | 136.8 |
| D | 1 | 52 | 305725 | 2144.06 | 586 | 570 | 142.3 |
| D | 1 | 47 | 84036 | 586.44 | 586 | 570 | 142.3 |
| D | 12 | 233 | 66409 | 462.59 | 586 | 570 | 142.3 |
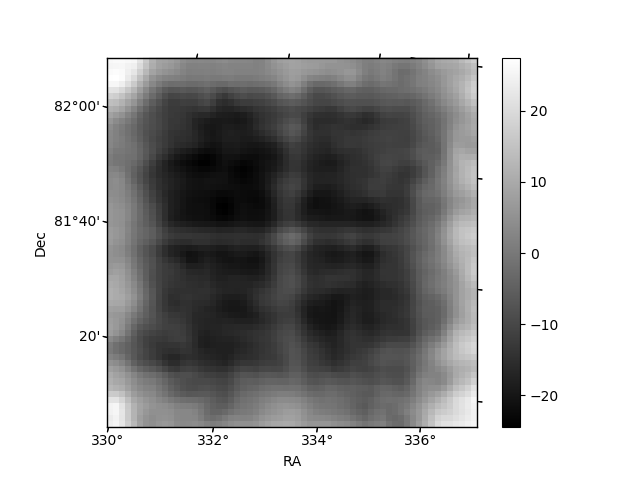
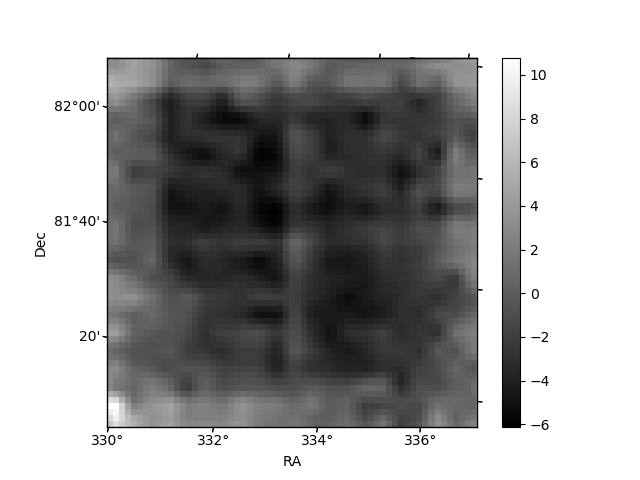
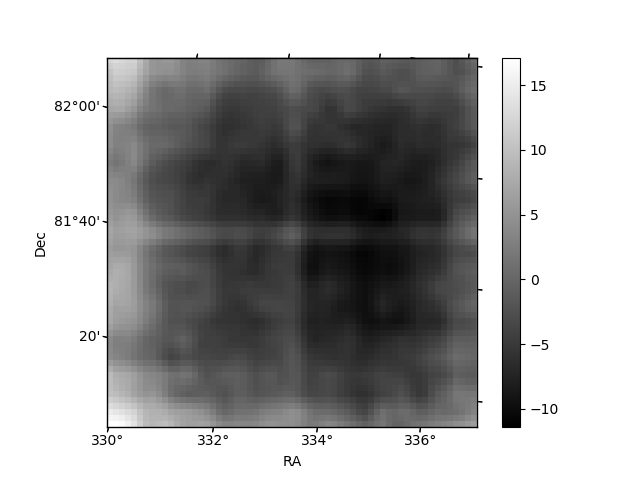
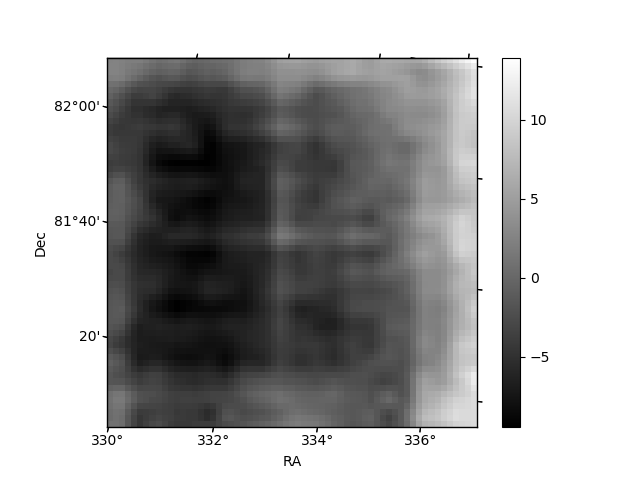
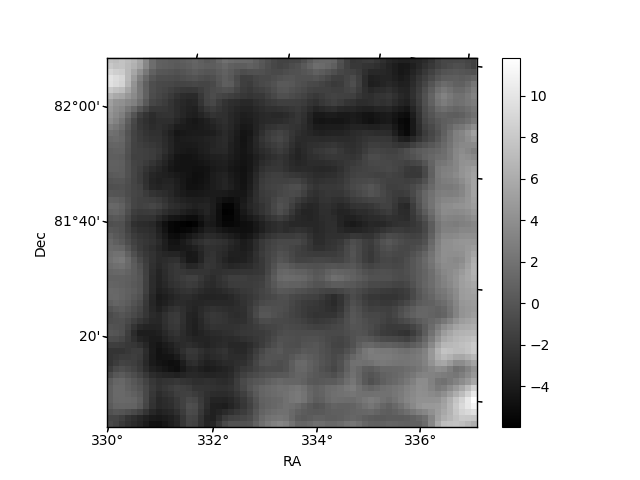
Histogram calculated using DETX and DETY for each event in the final _common_clean file
| Quadrant A | 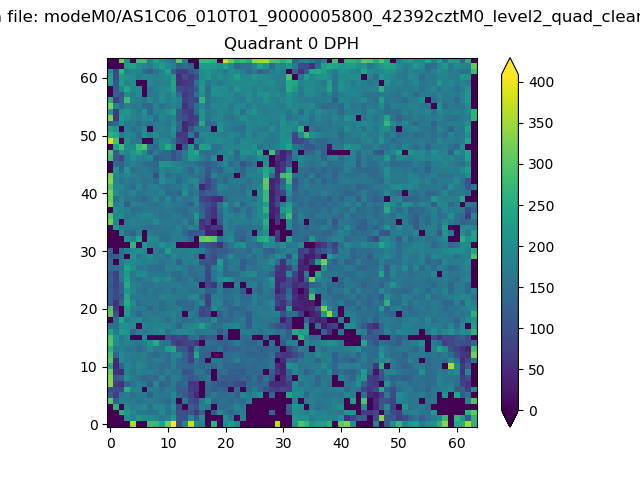 |
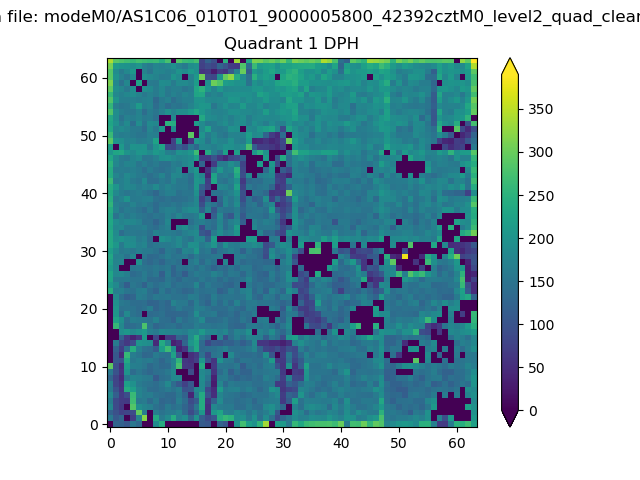 |
Quadrant B |
|---|---|---|---|
| Quadrant D |  |
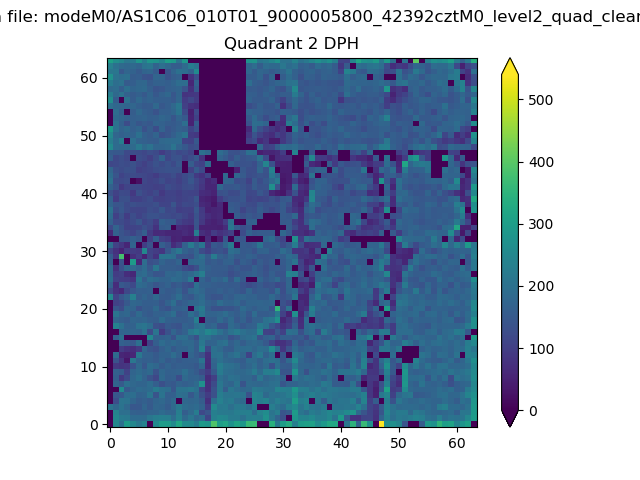 |
Quadrant C |
| Plot type | Count rate plots | Images |
|---|---|---|
| Comparison with Poisson distribution Blue bars denote a histogram of data divided into 1 sec bins. Red curve is a Poisson curve with rate = median count rate of data. |
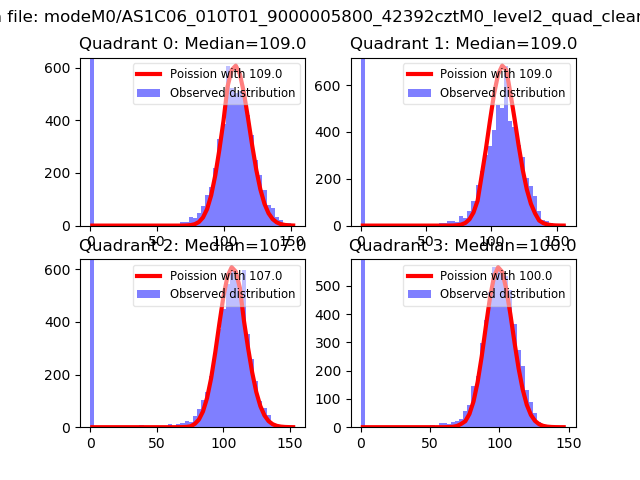 |
 |
| Quadrant-wise count rates Data is divided into 100 sec bins |
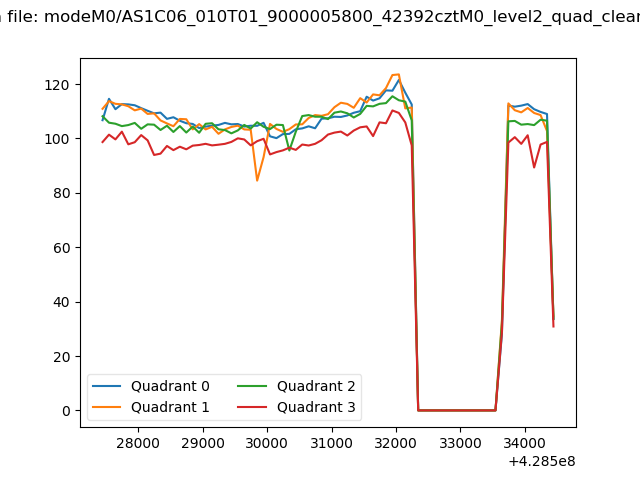 |
|
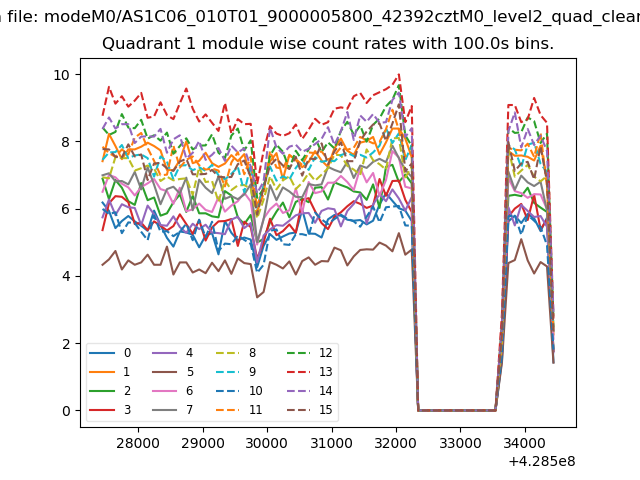
| Module-wise count rates for Quadrant A Data is divided into 100 sec bins |
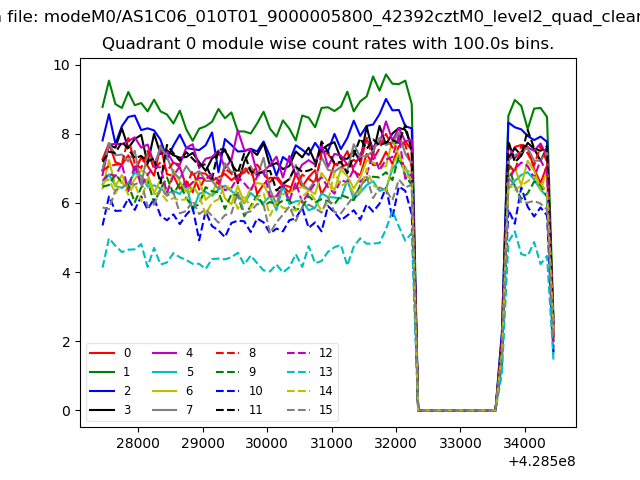 |
 |
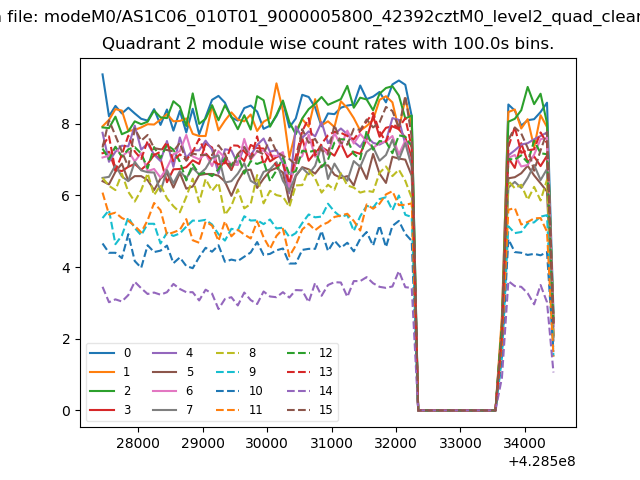
| Module-wise count rates for Quadrant B Data is divided into 100 sec bins |
 |
 |
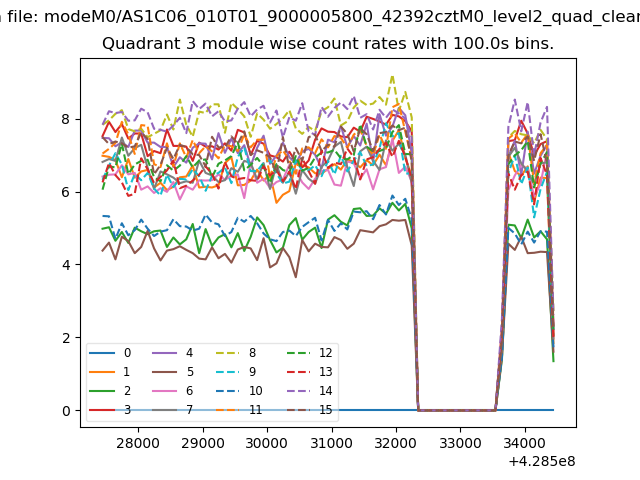
| Module-wise count rates for Quadrant C Data is divided into 100 sec bins |
 |
 |
| Module-wise count rates for Quadrant D Data is divided into 100 sec bins |
 |
 |
| Parameter | Plot |
|---|---|
| CZT HV Monitor | 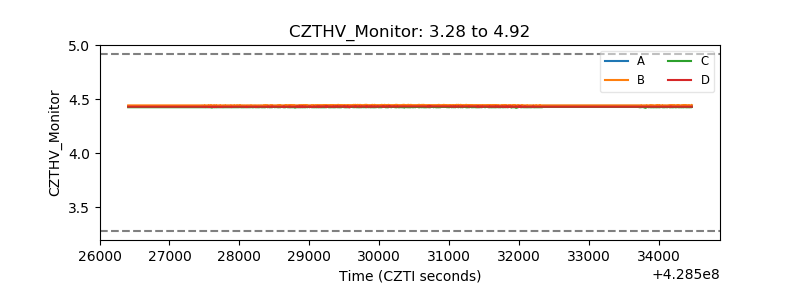 |
| D_VDD | 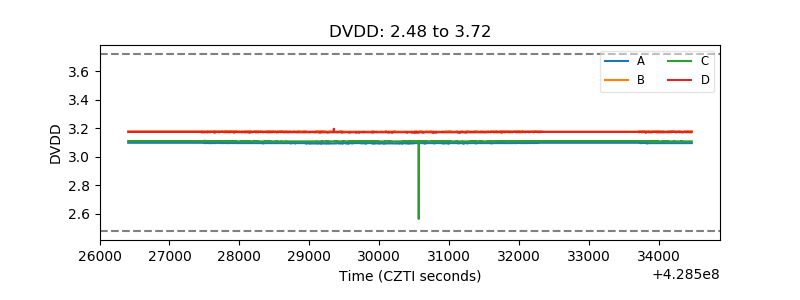 |
| Temperature 1 | 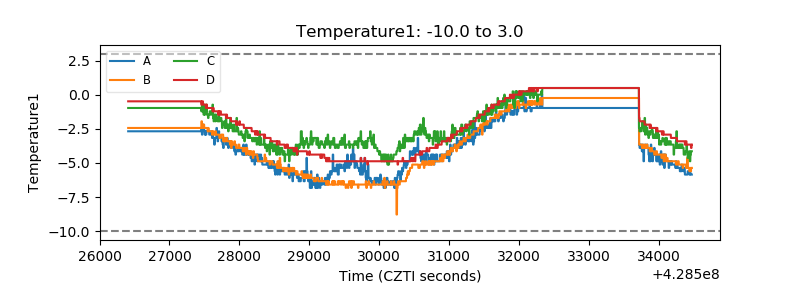 |
| Veto HV Monitor |  |
| Veto LLD | 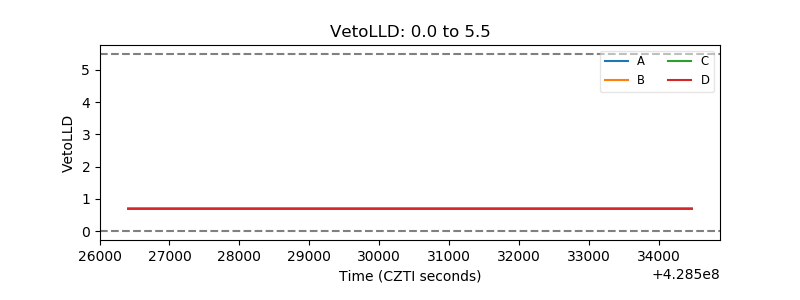 |
| Alpha Counter | 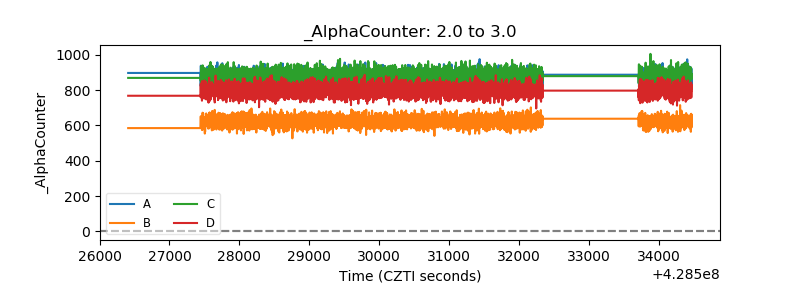 |
| _CPM_Rate | 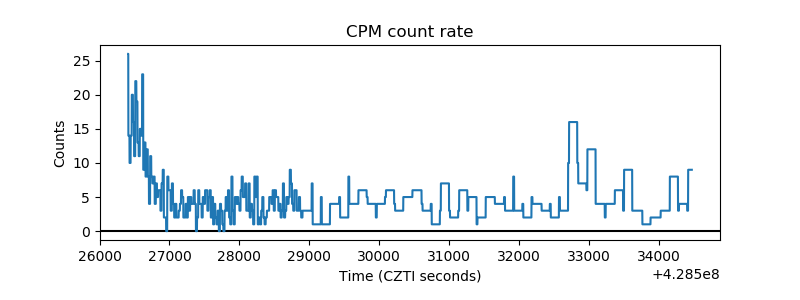 |
| CZT Counter | 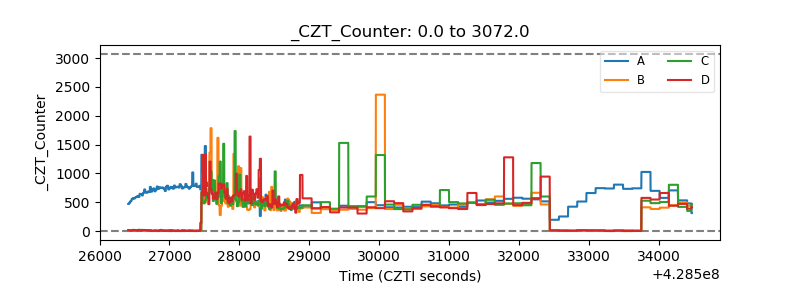 |
| +2.5 Volts monitor | 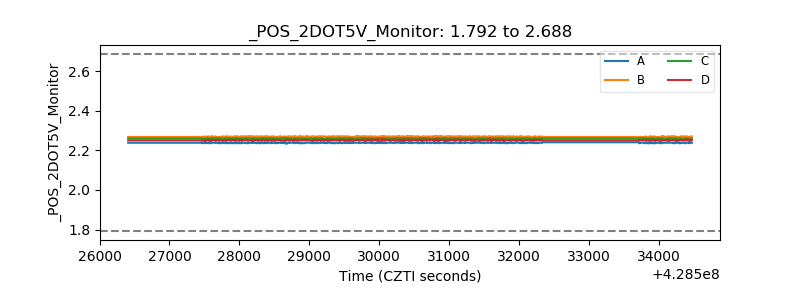 |
| +5 Volts monitor | 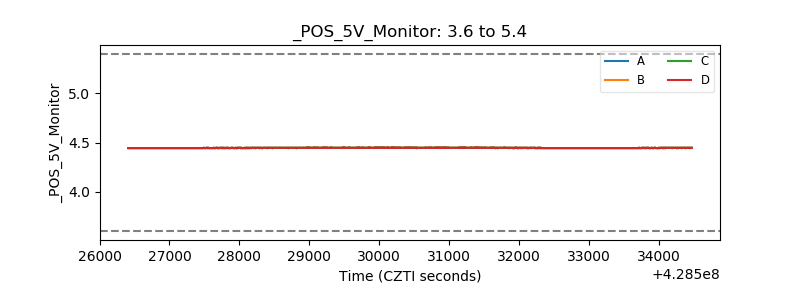 |
| _ROLL_ROT | 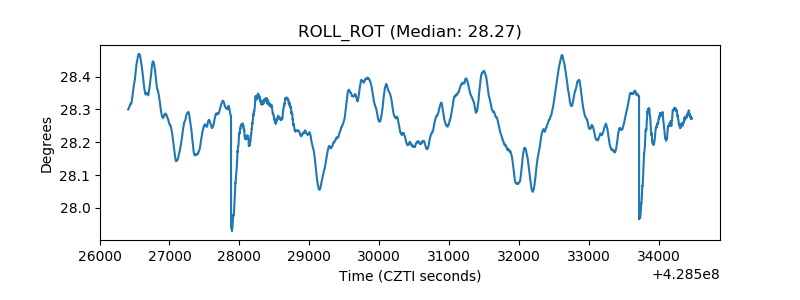 |
| _Roll_DEC | 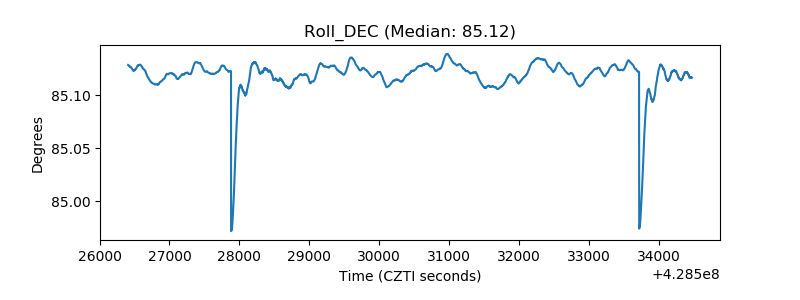 |
| _Roll_RA | 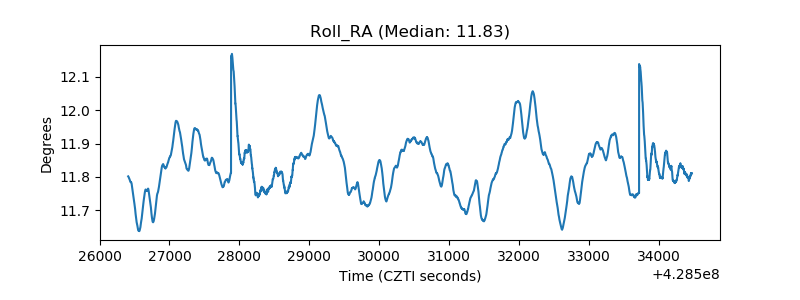 |
| Veto Counter | 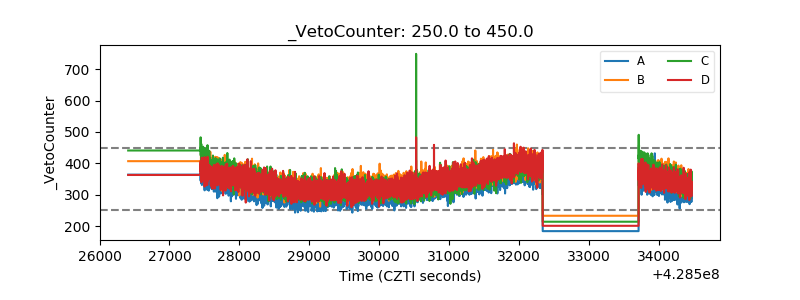 |