| Param | Original file | Final file |
|---|---|---|
| Filename | modeM0/AS1C06_010T01_9000005800_42393cztM0_level2.fits | modeM0/AS1C06_010T01_9000005800_42393cztM0_level2_quad_clean.evt |
| Size (bytes) | 335,571,840 | 95,901,120 |
| Size | 320.0 MB | 91.5 MB |
| Events in quadrant A | 3,164,687 | 635,882 |
| Events in quadrant B | 2,827,068 | 638,669 |
| Events in quadrant C | 2,943,457 | 629,567 |
| Events in quadrant D | 3,026,701 | 587,060 |
| Mode M9 | |||
|---|---|---|---|
| Quadrant | BADHDUFLAG | Total packets | Discarded packets |
| A | 0 | 27 | 0 |
| B | 0 | 27 | 0 |
| C | 0 | 27 | 0 |
| D | 0 | 27 | 0 |
| Mode M0 | |||
|---|---|---|---|
| Quadrant | BADHDUFLAG | Total packets | Discarded packets |
| A | 0 | 13274 | 2 |
| B | 0 | 12773 | 2 |
| C | 0 | 12646 | 2 |
| D | 0 | 13318 | 2 |
| Mode SS | |||
|---|---|---|---|
| Quadrant | BADHDUFLAG | Total packets | Discarded packets |
| A | 0 | 122 | 0 |
| B | 0 | 122 | 0 |
| C | 0 | 122 | 0 |
| D | 0 | 122 | 0 |
| Quadrant | Total seconds | Saturated seconds | Saturation percentage |
|---|---|---|---|
| A | 5903 | 21 | 0.355751% |
| B | 5904 | 63 | 1.067073% |
| C | 5904 | 37 | 0.626694% |
| D | 5904 | 47 | 0.796070% |
Noise dominated data is calculated using 1-second bins in cleaned event files. If a bin has >2000 counts, and if more than 50% of those come from <1% of pixels, then it is considered to be noise-dominated and hence unusable.
| Quadrant | # 1 sec bins | Bins with >0 counts | Bins with >2000 counts | High rate bins dominated by noise | Noise dominated (total time) | Noise dominated (detector-on time) | Marked lightcurve |
|---|---|---|---|---|---|---|---|
| A | 8589 | 5905 | 9 | 9 | 0.10% | 0.15% |  |
| B | 8590 | 5906 | 33 | 33 | 0.38% | 0.56% | 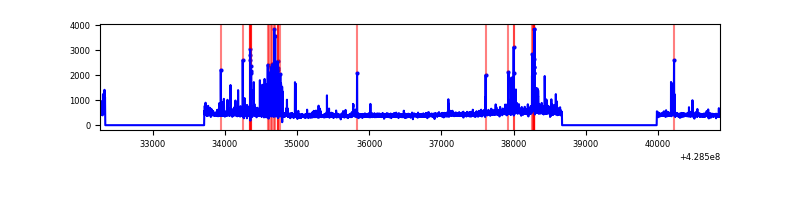 |
| C | 8590 | 5906 | 27 | 27 | 0.31% | 0.46% | 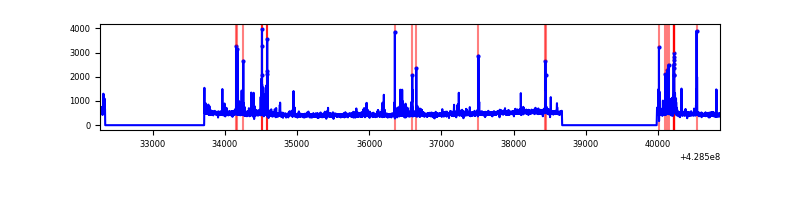 |
| D | 8590 | 5906 | 32 | 32 | 0.37% | 0.54% | 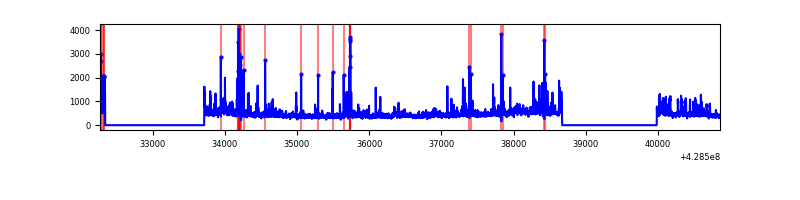 |
Top three noisy pixels from each quadrant. If the there are fewer than three noisy pixels in the level2.evt file, extra rows are filled as -1
| Pixel properties | Quadrant properties | ||||||
|---|---|---|---|---|---|---|---|
| Quadrant | DetID | PixID | Counts | Sigma | Mean | Median | Sigma |
| A | 10 | 83 | 611340 | 4779.82 | 626 | 614 | 127.8 |
| A | 14 | 223 | 38925 | 299.84 | 626 | 614 | 127.8 |
| A | 3 | 1 | 37318 | 287.26 | 626 | 614 | 127.8 |
| B | 5 | 172 | 155669 | 1286.22 | 620 | 602 | 120.6 |
| B | 0 | 245 | 64509 | 530.08 | 620 | 602 | 120.6 |
| B | 15 | 35 | 47719 | 390.82 | 620 | 602 | 120.6 |
| C | 15 | 214 | 243942 | 1697.54 | 613 | 619 | 143.3 |
| C | 4 | 254 | 216725 | 1507.66 | 613 | 619 | 143.3 |
| C | 14 | 254 | 49909 | 343.87 | 613 | 619 | 143.3 |
| D | 1 | 52 | 202385 | 1351.05 | 615 | 596 | 149.4 |
| D | 2 | 16 | 90509 | 602.0 | 615 | 596 | 149.4 |
| D | 12 | 6 | 74132 | 492.35 | 615 | 596 | 149.4 |
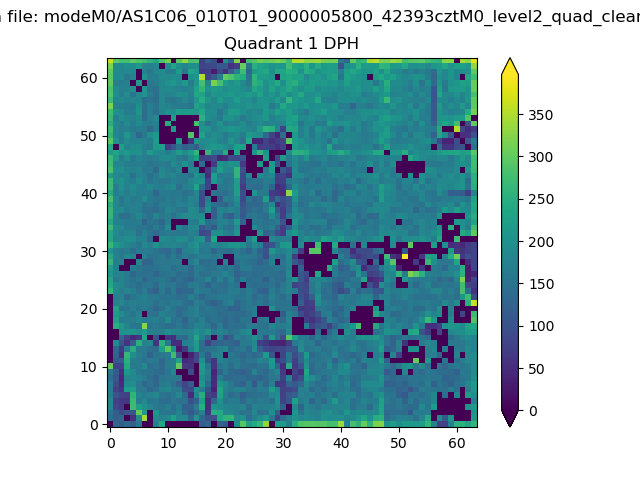
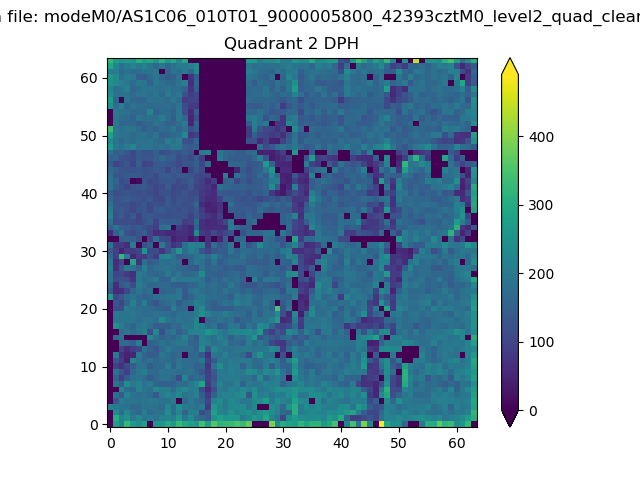
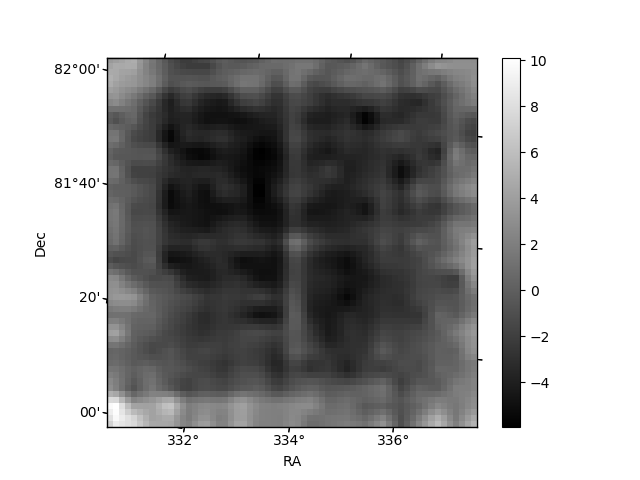
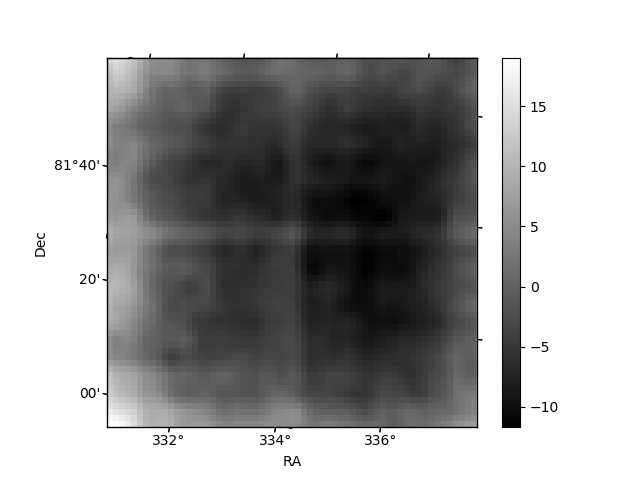
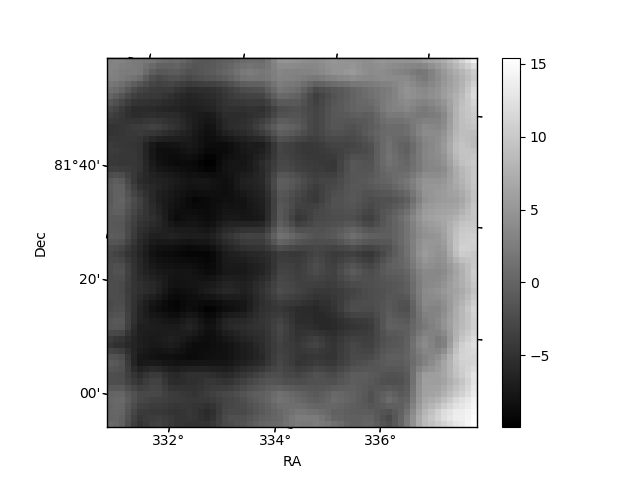
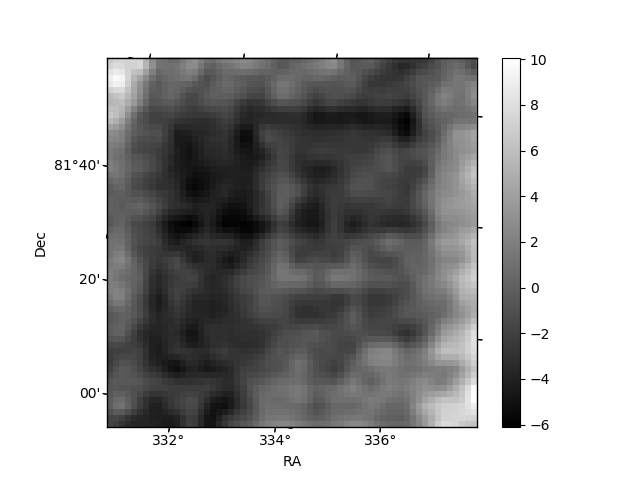
Histogram calculated using DETX and DETY for each event in the final _common_clean file
| Quadrant A | 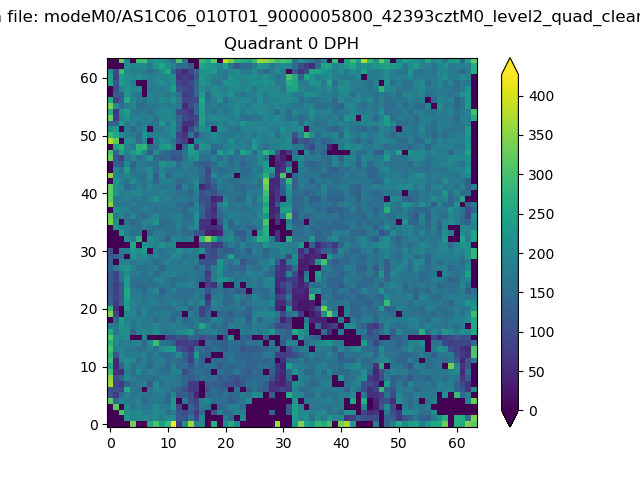 |
 |
Quadrant B |
|---|---|---|---|
| Quadrant D | 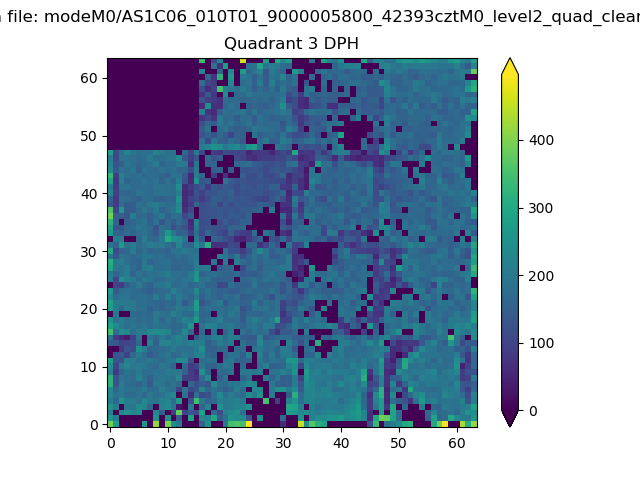 |
 |
Quadrant C |
| Plot type | Count rate plots | Images |
|---|---|---|
| Comparison with Poisson distribution Blue bars denote a histogram of data divided into 1 sec bins. Red curve is a Poisson curve with rate = median count rate of data. |
 |
 |
| Quadrant-wise count rates Data is divided into 100 sec bins |
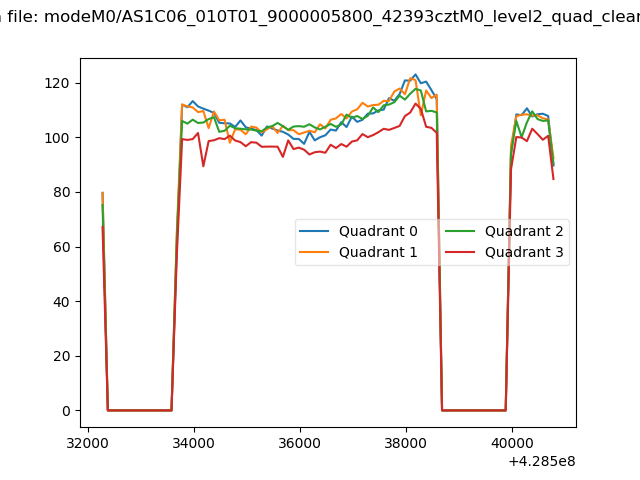 |
|
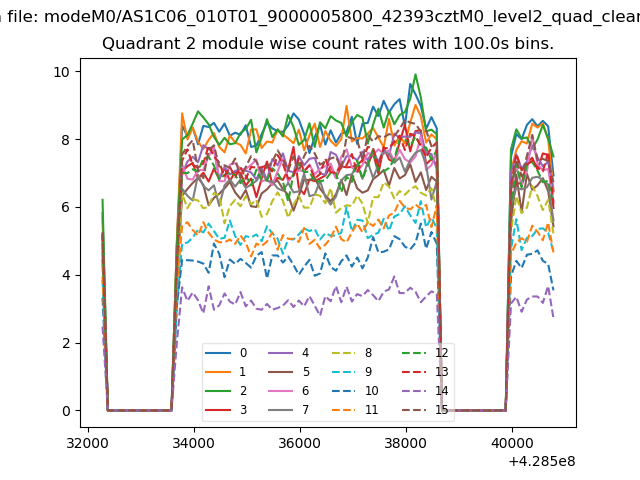
| Module-wise count rates for Quadrant A Data is divided into 100 sec bins |
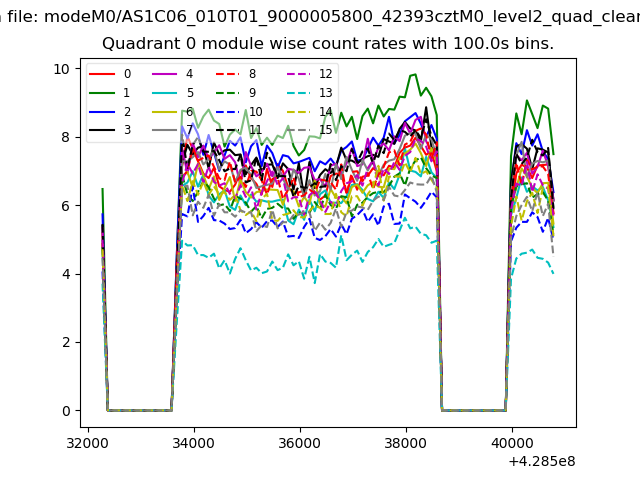 |
 |
| Module-wise count rates for Quadrant B Data is divided into 100 sec bins |
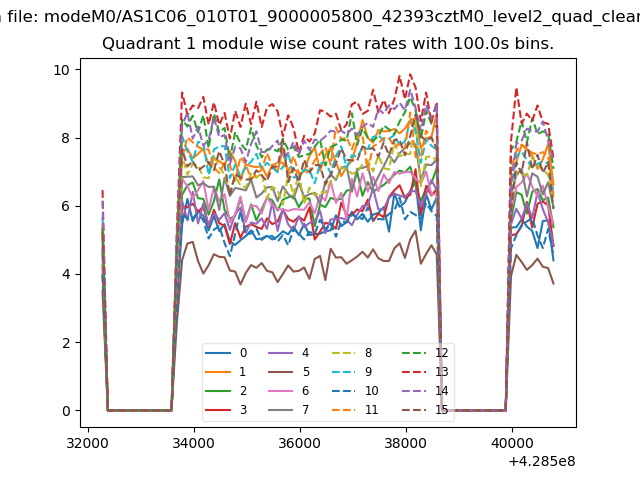 |
 |
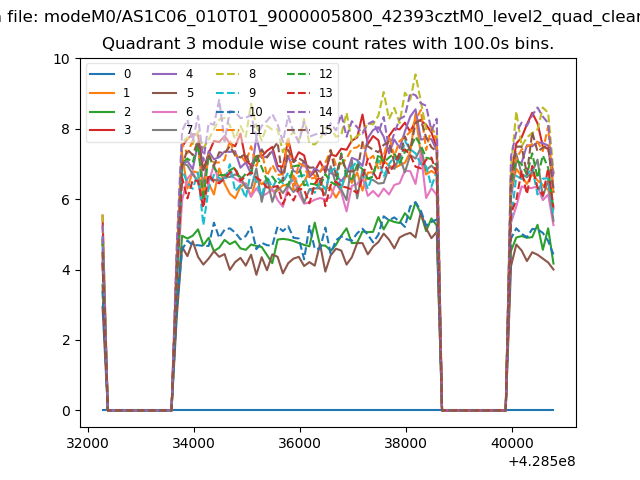
| Module-wise count rates for Quadrant C Data is divided into 100 sec bins |
 |
 |
| Module-wise count rates for Quadrant D Data is divided into 100 sec bins |
 |
 |
| Parameter | Plot |
|---|---|
| CZT HV Monitor | 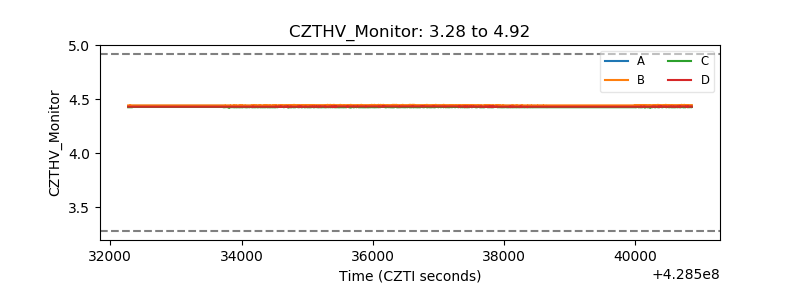 |
| D_VDD | 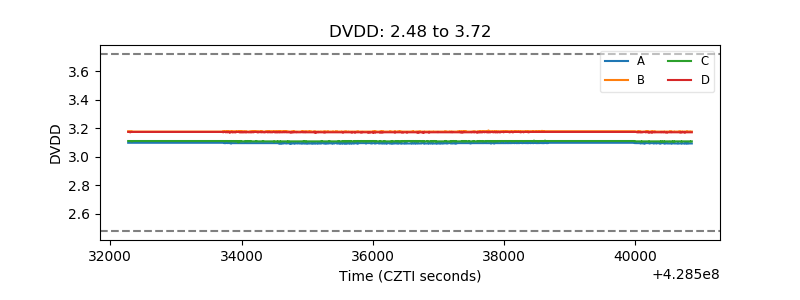 |
| Temperature 1 | 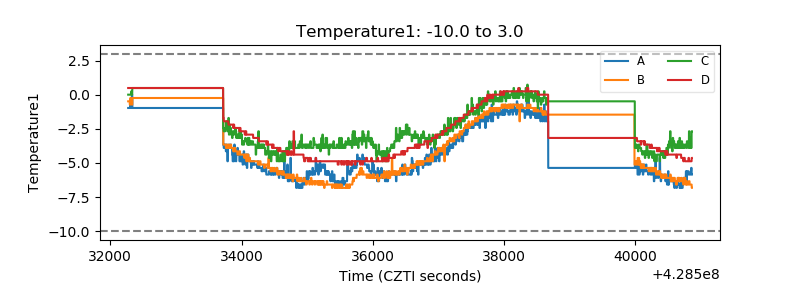 |
| Veto HV Monitor | 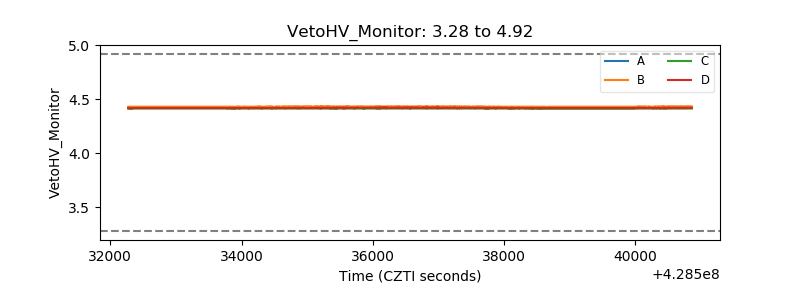 |
| Veto LLD | 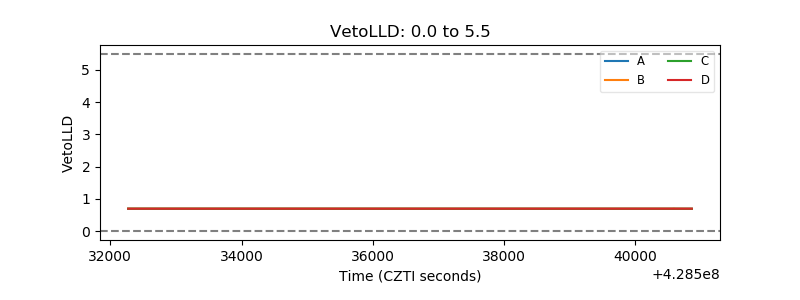 |
| Alpha Counter | 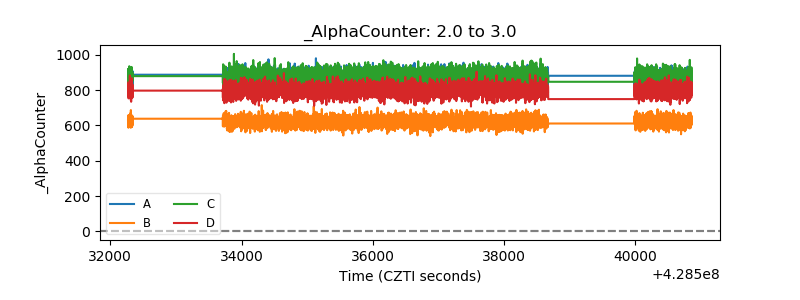 |
| _CPM_Rate | 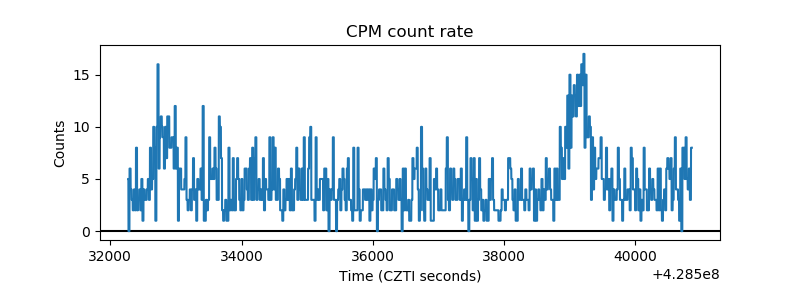 |
| CZT Counter | 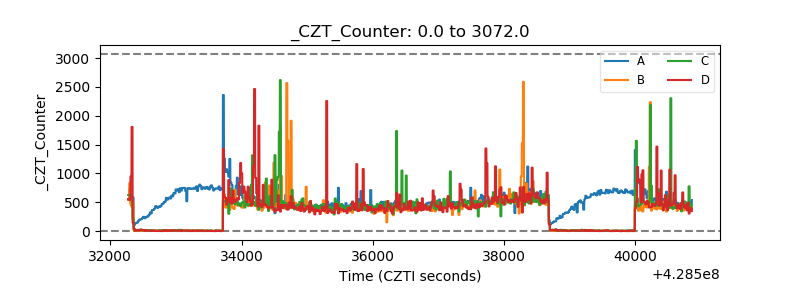 |
| +2.5 Volts monitor | 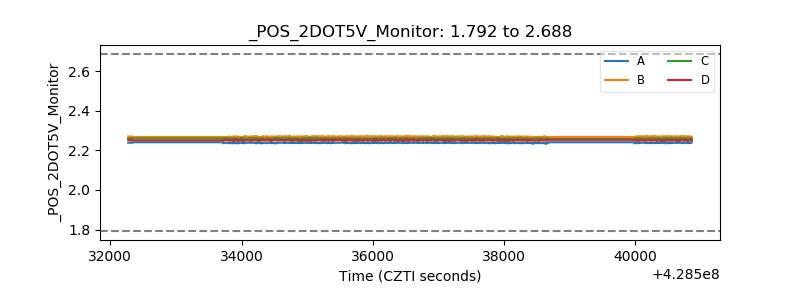 |
| +5 Volts monitor | 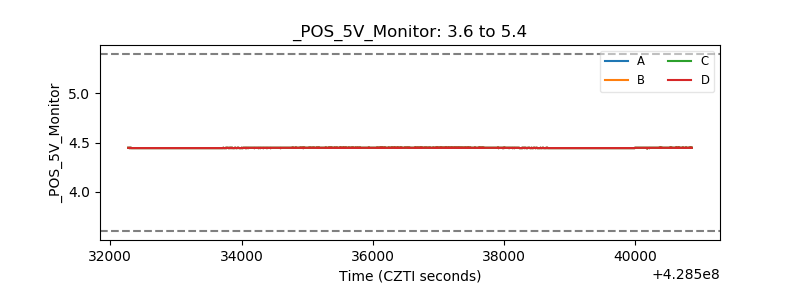 |
| _ROLL_ROT | 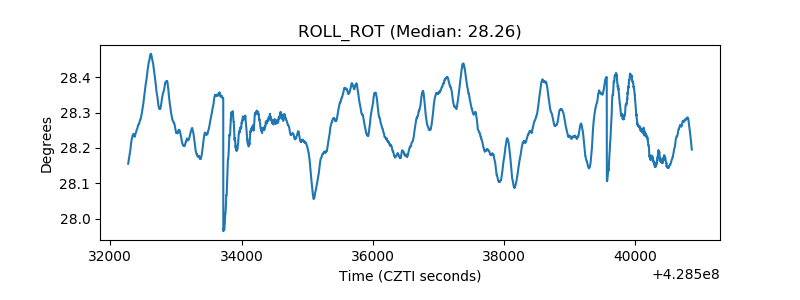 |
| _Roll_DEC | 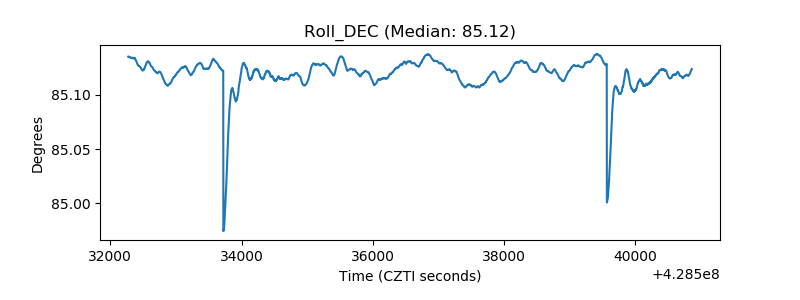 |
| _Roll_RA | 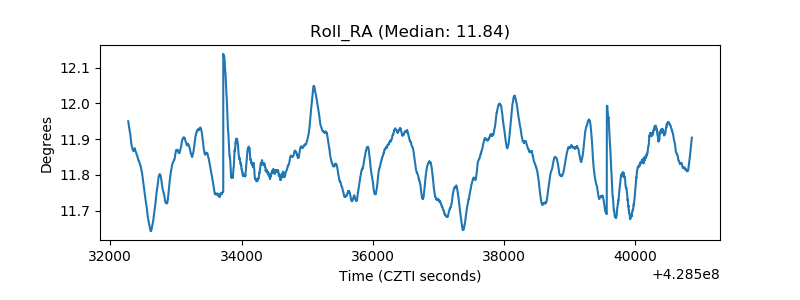 |
| Veto Counter | 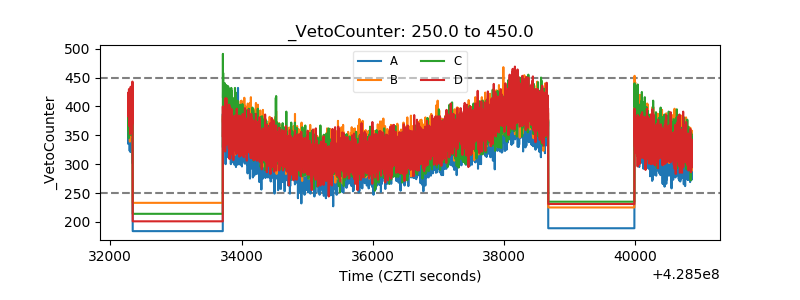 |