| Param | Original file | Final file |
|---|---|---|
| Filename | modeM0/AS1C06_010T01_9000005800_42396cztM0_level2.fits | modeM0/AS1C06_010T01_9000005800_42396cztM0_level2_quad_clean.evt |
| Size (bytes) | 594,835,200 | 167,849,280 |
| Size | 567.3 MB | 160.1 MB |
| Events in quadrant A | 5,458,647 | 1,114,938 |
| Events in quadrant B | 4,904,015 | 1,121,620 |
| Events in quadrant C | 5,148,209 | 1,104,967 |
| Events in quadrant D | 5,701,924 | 1,020,866 |
| Mode M9 | |||
|---|---|---|---|
| Quadrant | BADHDUFLAG | Total packets | Discarded packets |
| A | 0 | 40 | 0 |
| B | 0 | 40 | 0 |
| C | 0 | 40 | 0 |
| D | 0 | 40 | 0 |
| Mode M0 | |||
|---|---|---|---|
| Quadrant | BADHDUFLAG | Total packets | Discarded packets |
| A | 0 | 22950 | 3 |
| B | 0 | 22342 | 3 |
| C | 0 | 22144 | 3 |
| D | 0 | 24541 | 3 |
| Mode SS | |||
|---|---|---|---|
| Quadrant | BADHDUFLAG | Total packets | Discarded packets |
| A | 0 | 216 | 0 |
| B | 0 | 216 | 0 |
| C | 0 | 216 | 0 |
| D | 0 | 216 | 0 |
| Quadrant | Total seconds | Saturated seconds | Saturation percentage |
|---|---|---|---|
| A | 10382 | 21 | 0.202273% |
| B | 10383 | 86 | 0.828277% |
| C | 10383 | 57 | 0.548974% |
| D | 10383 | 186 | 1.791390% |
Noise dominated data is calculated using 1-second bins in cleaned event files. If a bin has >2000 counts, and if more than 50% of those come from <1% of pixels, then it is considered to be noise-dominated and hence unusable.
| Quadrant | # 1 sec bins | Bins with >0 counts | Bins with >2000 counts | High rate bins dominated by noise | Noise dominated (total time) | Noise dominated (detector-on time) | Marked lightcurve |
|---|---|---|---|---|---|---|---|
| A | 14410 | 10385 | 10 | 10 | 0.07% | 0.10% | 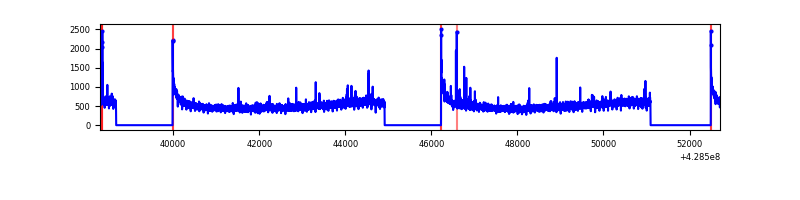 |
| B | 14411 | 10386 | 50 | 50 | 0.35% | 0.48% | 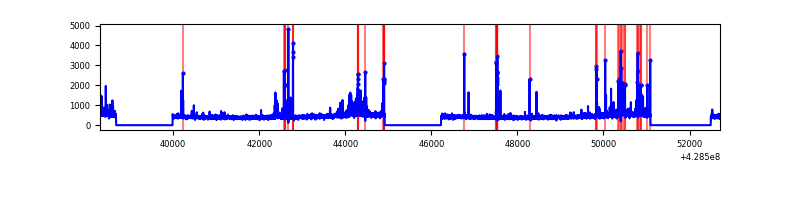 |
| C | 14411 | 10386 | 39 | 39 | 0.27% | 0.38% | 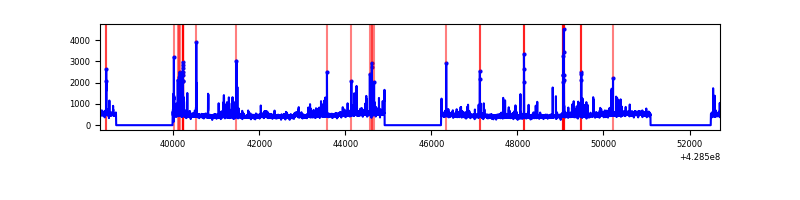 |
| D | 14411 | 10386 | 143 | 143 | 0.99% | 1.38% | 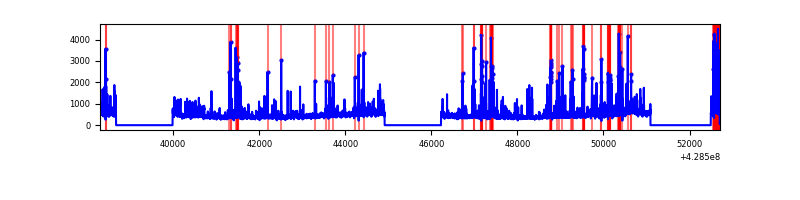 |
Top three noisy pixels from each quadrant. If the there are fewer than three noisy pixels in the level2.evt file, extra rows are filled as -1
| Pixel properties | Quadrant properties | ||||||
|---|---|---|---|---|---|---|---|
| Quadrant | DetID | PixID | Counts | Sigma | Mean | Median | Sigma |
| A | 10 | 83 | 1010107 | 4416.03 | 1118 | 1094 | 228.5 |
| A | 13 | 248 | 49928 | 213.73 | 1118 | 1094 | 228.5 |
| A | 13 | 6 | 28624 | 120.49 | 1118 | 1094 | 228.5 |
| B | 5 | 172 | 301893 | 1419.24 | 1104 | 1073 | 212.0 |
| B | 0 | 245 | 100866 | 470.81 | 1104 | 1073 | 212.0 |
| B | 4 | 141 | 62331 | 289.01 | 1104 | 1073 | 212.0 |
| C | 15 | 214 | 428393 | 1687.45 | 1090 | 1096 | 253.2 |
| C | 4 | 254 | 287001 | 1129.07 | 1090 | 1096 | 253.2 |
| C | 14 | 254 | 137368 | 538.15 | 1090 | 1096 | 253.2 |
| D | 2 | 249 | 285860 | 1067.95 | 1094 | 1062 | 266.7 |
| D | 1 | 52 | 284236 | 1061.86 | 1094 | 1062 | 266.7 |
| D | 12 | 6 | 267180 | 997.91 | 1094 | 1062 | 266.7 |
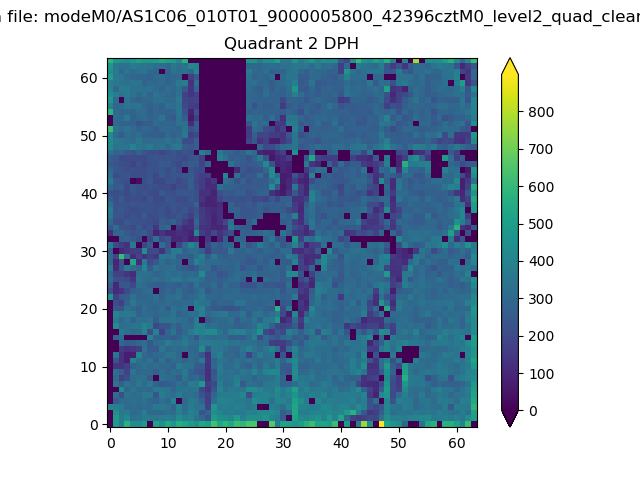
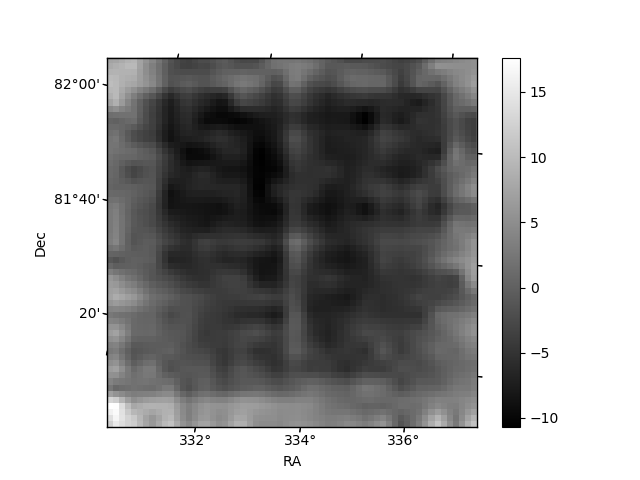
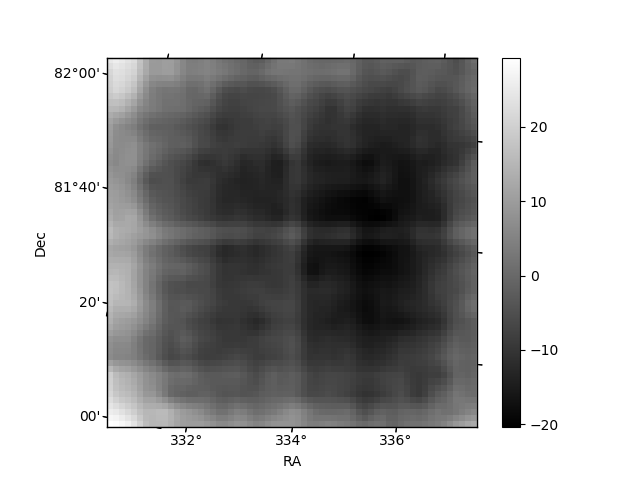
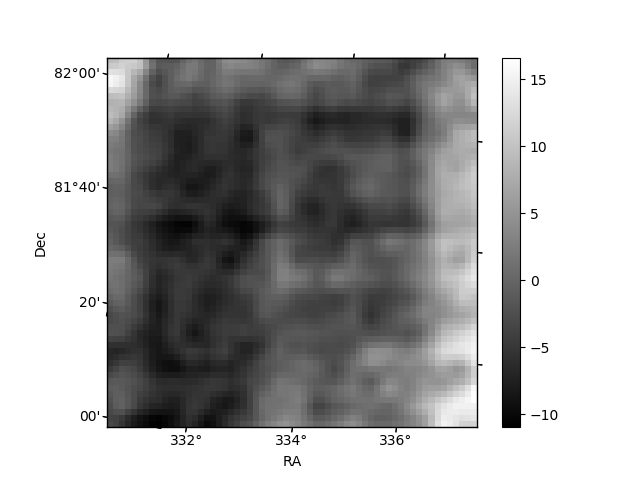
Histogram calculated using DETX and DETY for each event in the final _common_clean file
| Quadrant A | 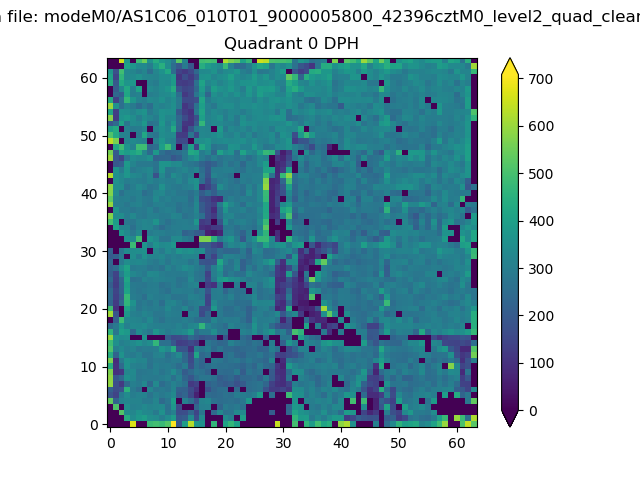 |
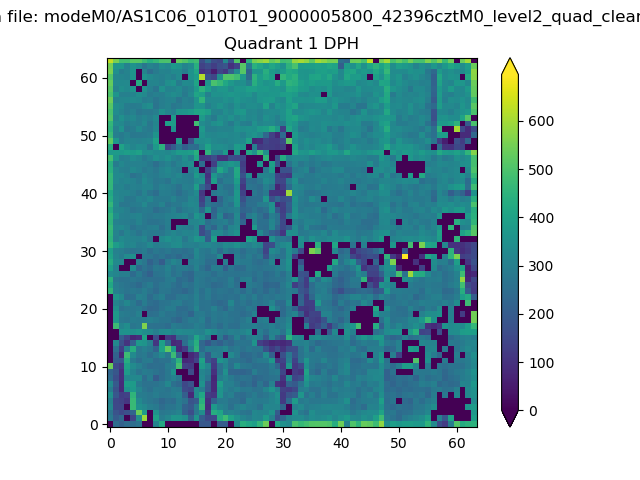 |
Quadrant B |
|---|---|---|---|
| Quadrant D | 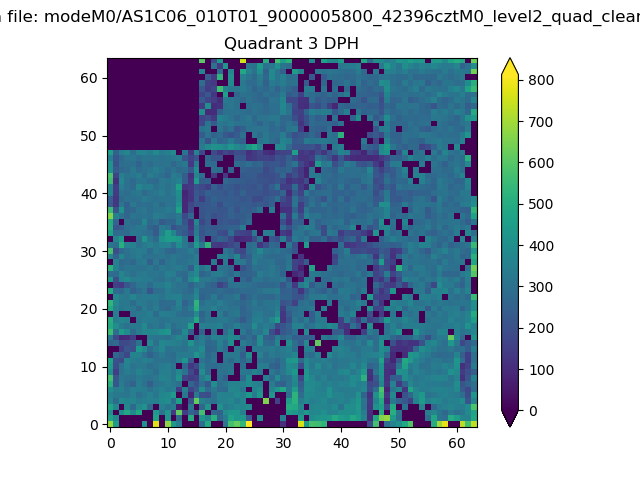 |
 |
Quadrant C |
| Plot type | Count rate plots | Images |
|---|---|---|
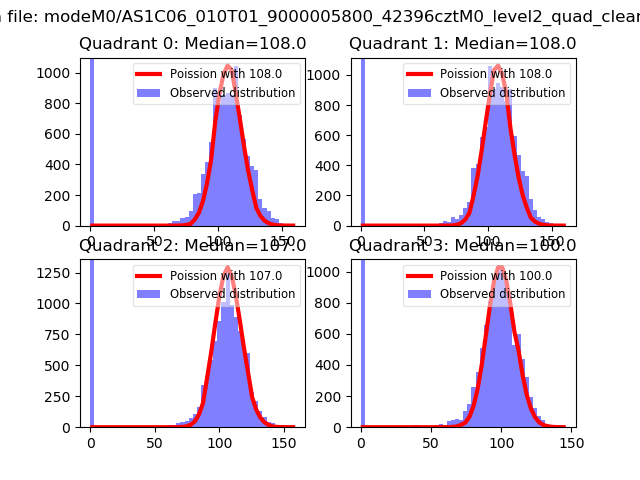
| Comparison with Poisson distribution Blue bars denote a histogram of data divided into 1 sec bins. Red curve is a Poisson curve with rate = median count rate of data. |
 |
 |
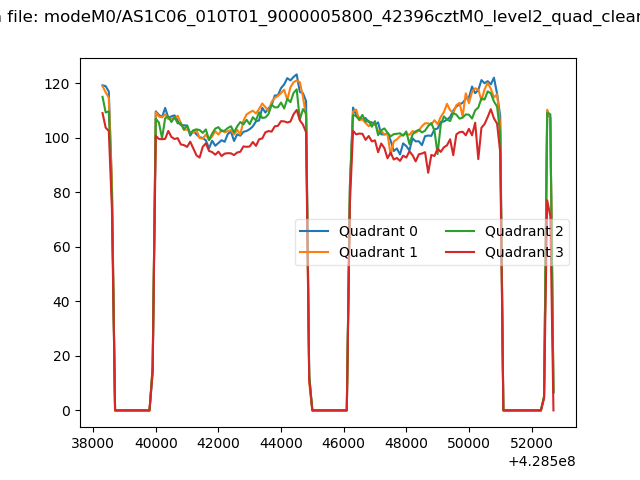
| Quadrant-wise count rates Data is divided into 100 sec bins |
 |
|
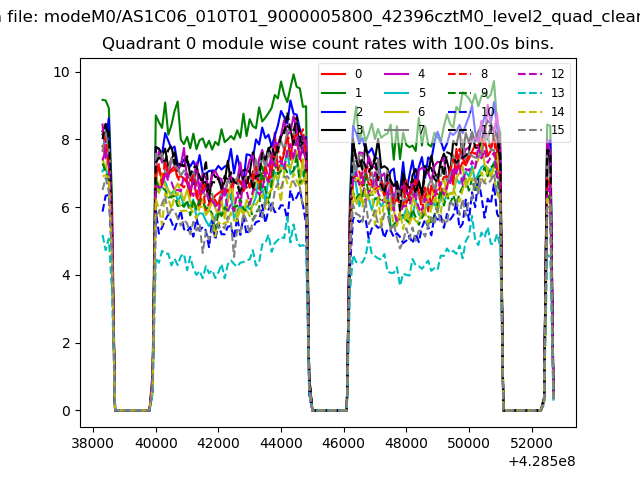
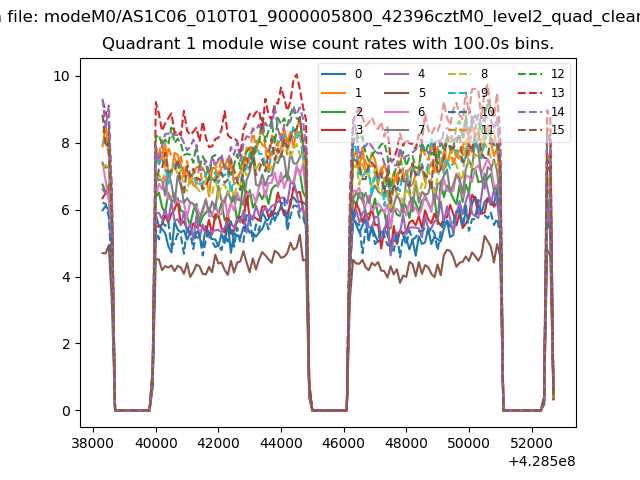
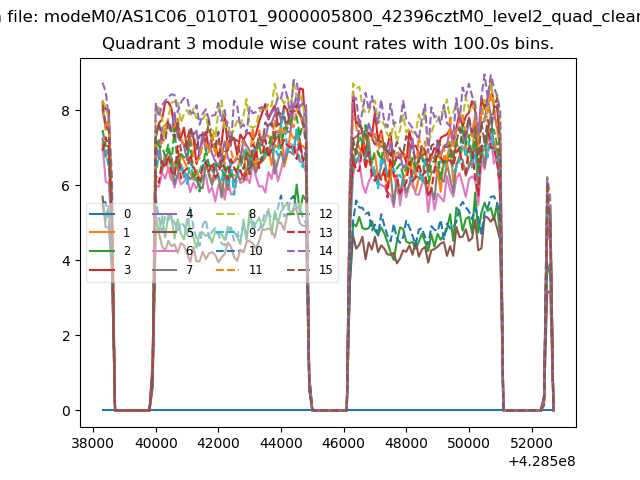
| Module-wise count rates for Quadrant A Data is divided into 100 sec bins |
 |
 |
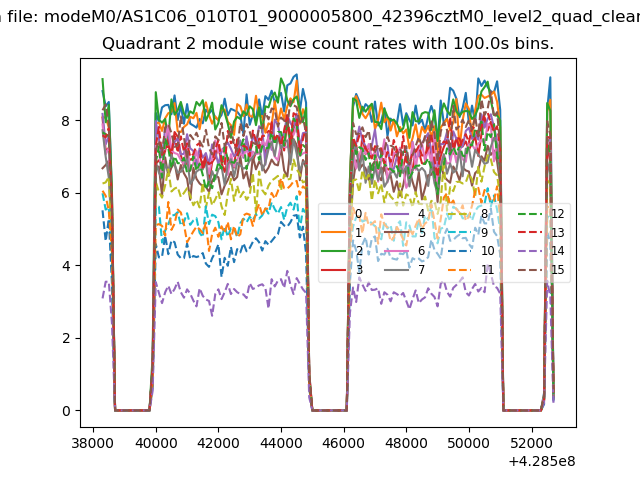
| Module-wise count rates for Quadrant B Data is divided into 100 sec bins |
 |
 |
| Module-wise count rates for Quadrant C Data is divided into 100 sec bins |
 |
 |
| Module-wise count rates for Quadrant D Data is divided into 100 sec bins |
 |
 |
| Parameter | Plot |
|---|---|
| CZT HV Monitor | 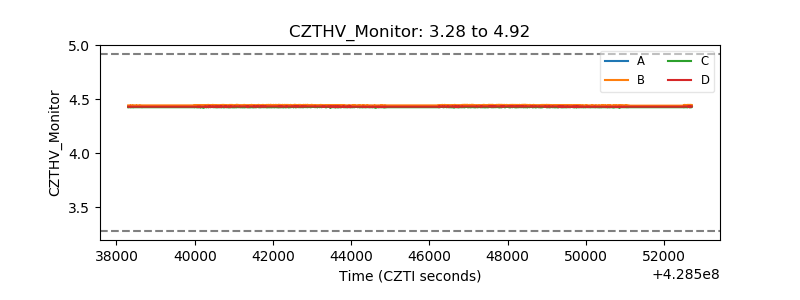 |
| D_VDD | 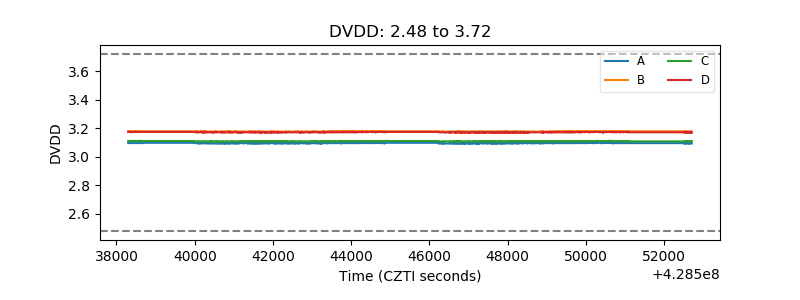 |
| Temperature 1 |  |
| Veto HV Monitor |  |
| Veto LLD | 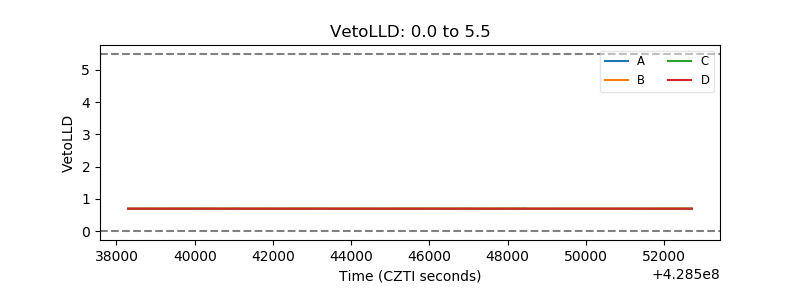 |
| Alpha Counter | 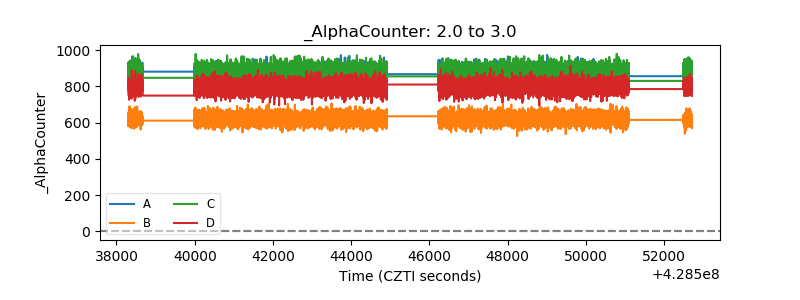 |
| _CPM_Rate |  |
| CZT Counter |  |
| +2.5 Volts monitor | 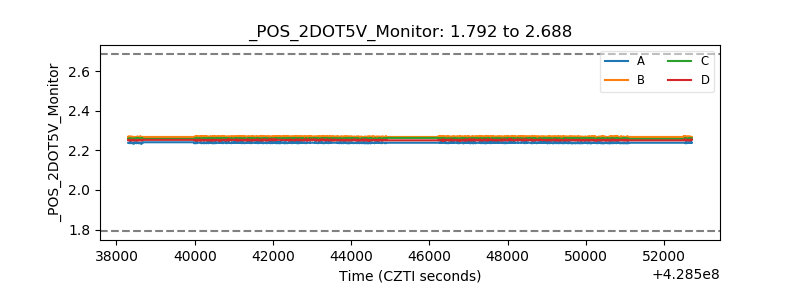 |
| +5 Volts monitor | 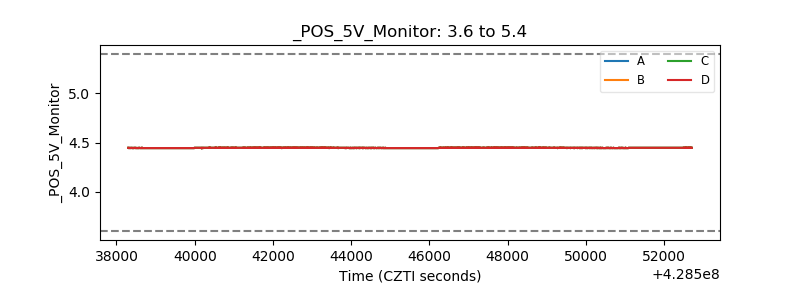 |
| _ROLL_ROT | 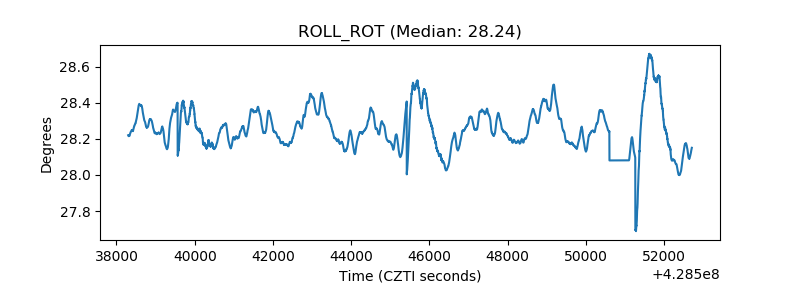 |
| _Roll_DEC | 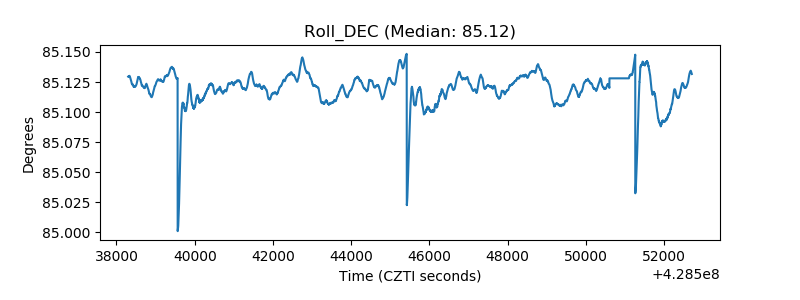 |
| _Roll_RA | 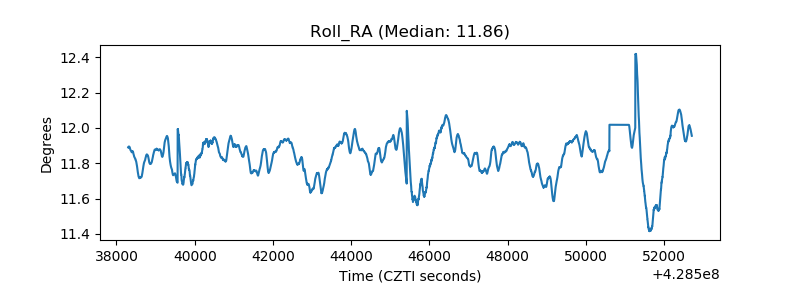 |
| Veto Counter | 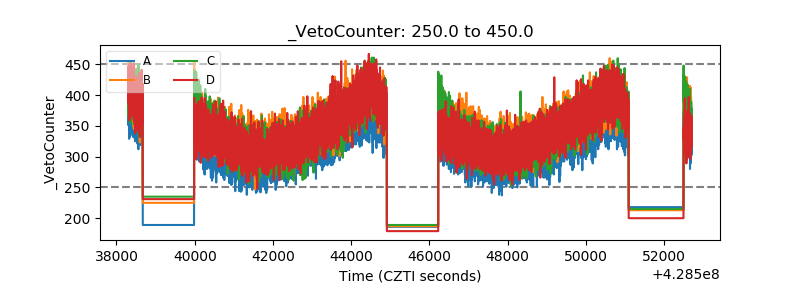 |