| Param | Original file | Final file |
|---|---|---|
| Filename | modeM0/AS1T05_138T01_9000005802_42397cztM0_level2.fits | modeM0/AS1T05_138T01_9000005802_42397cztM0_level2_quad_clean.evt |
| Size (bytes) | 369,544,320 | 99,054,720 |
| Size | 352.4 MB | 94.5 MB |
| Events in quadrant A | 3,315,972 | 661,961 |
| Events in quadrant B | 2,938,489 | 676,781 |
| Events in quadrant C | 2,947,770 | 647,843 |
| Events in quadrant D | 4,002,102 | 586,506 |
| Mode M9 | |||
|---|---|---|---|
| Quadrant | BADHDUFLAG | Total packets | Discarded packets |
| A | 0 | 32 | 0 |
| B | 0 | 32 | 0 |
| C | 0 | 32 | 0 |
| D | 0 | 32 | 0 |
| Mode M0 | |||
|---|---|---|---|
| Quadrant | BADHDUFLAG | Total packets | Discarded packets |
| A | 0 | 13351 | 2 |
| B | 0 | 13050 | 2 |
| C | 0 | 12598 | 2 |
| D | 0 | 16117 | 2 |
| Mode SS | |||
|---|---|---|---|
| Quadrant | BADHDUFLAG | Total packets | Discarded packets |
| A | 0 | 126 | 0 |
| B | 0 | 126 | 0 |
| C | 0 | 126 | 0 |
| D | 0 | 126 | 0 |
| Quadrant | Total seconds | Saturated seconds | Saturation percentage |
|---|---|---|---|
| A | 6101 | 22 | 0.360597% |
| B | 6102 | 70 | 1.147165% |
| C | 6102 | 10 | 0.163881% |
| D | 6102 | 141 | 2.310718% |
Noise dominated data is calculated using 1-second bins in cleaned event files. If a bin has >2000 counts, and if more than 50% of those come from <1% of pixels, then it is considered to be noise-dominated and hence unusable.
| Quadrant | # 1 sec bins | Bins with >0 counts | Bins with >2000 counts | High rate bins dominated by noise | Noise dominated (total time) | Noise dominated (detector-on time) | Marked lightcurve |
|---|---|---|---|---|---|---|---|
| A | 9297 | 6103 | 7 | 7 | 0.08% | 0.11% | 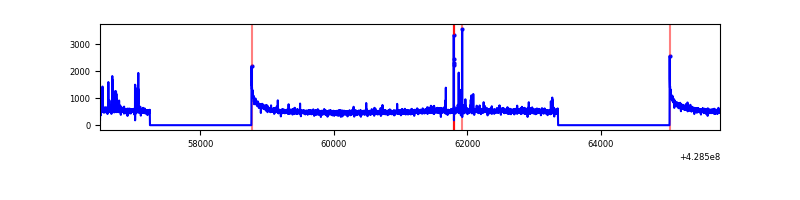 |
| B | 9298 | 6104 | 43 | 43 | 0.46% | 0.70% | 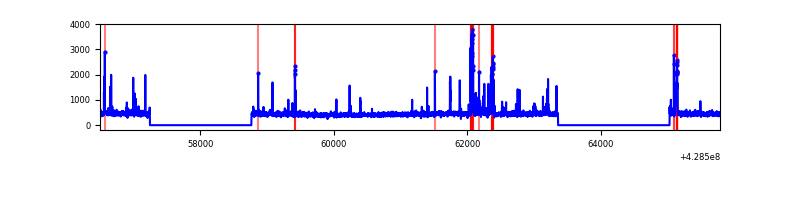 |
| C | 9298 | 6104 | 7 | 7 | 0.08% | 0.11% | 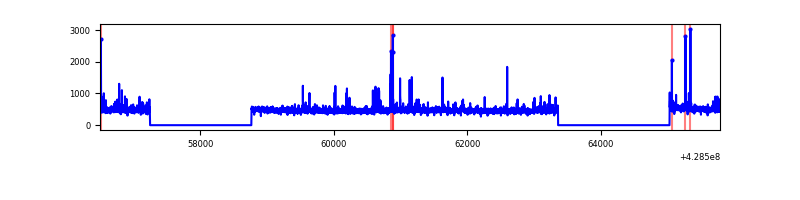 |
| D | 9298 | 6104 | 120 | 120 | 1.29% | 1.97% | 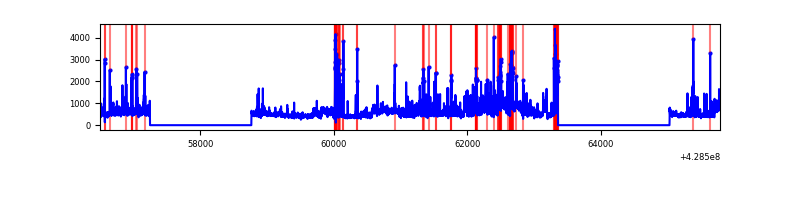 |
Top three noisy pixels from each quadrant. If the there are fewer than three noisy pixels in the level2.evt file, extra rows are filled as -1
| Pixel properties | Quadrant properties | ||||||
|---|---|---|---|---|---|---|---|
| Quadrant | DetID | PixID | Counts | Sigma | Mean | Median | Sigma |
| A | 10 | 83 | 625947 | 4567.46 | 669 | 654 | 136.9 |
| A | 14 | 223 | 59652 | 430.95 | 669 | 654 | 136.9 |
| A | 13 | 6 | 20791 | 147.09 | 669 | 654 | 136.9 |
| B | 15 | 85 | 115968 | 899.4 | 663 | 645 | 128.2 |
| B | 5 | 172 | 80629 | 623.79 | 663 | 645 | 128.2 |
| B | 4 | 141 | 45636 | 350.88 | 663 | 645 | 128.2 |
| C | 15 | 214 | 258796 | 1703.91 | 649 | 653 | 151.5 |
| C | 4 | 254 | 117478 | 771.12 | 649 | 653 | 151.5 |
| C | 14 | 254 | 28050 | 180.84 | 649 | 653 | 151.5 |
| D | 2 | 16 | 459727 | 2889.78 | 643 | 622 | 158.9 |
| D | 1 | 47 | 367937 | 2312.02 | 643 | 622 | 158.9 |
| D | 1 | 52 | 252524 | 1585.56 | 643 | 622 | 158.9 |
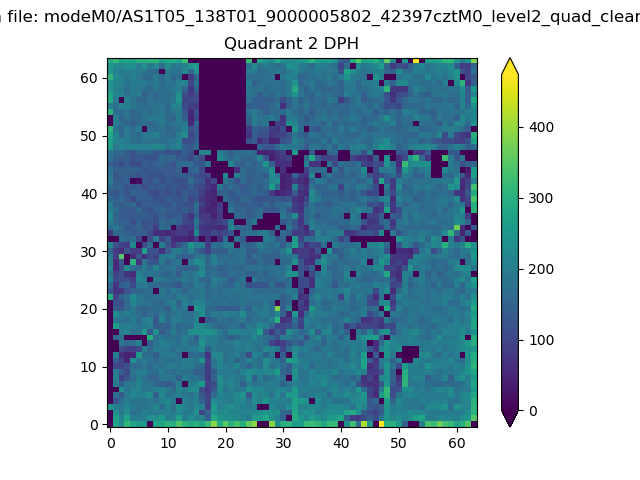
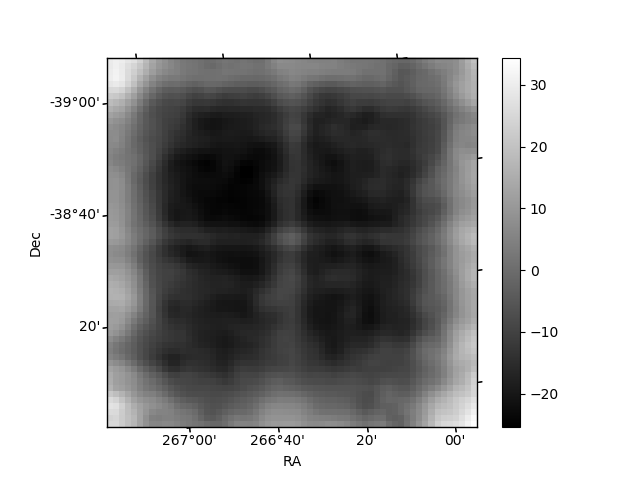
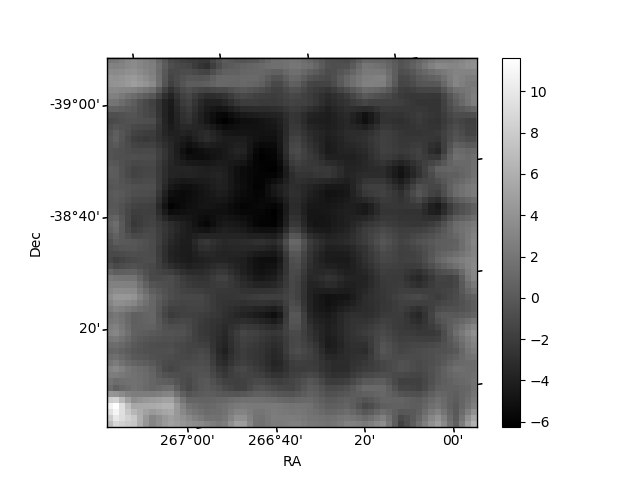
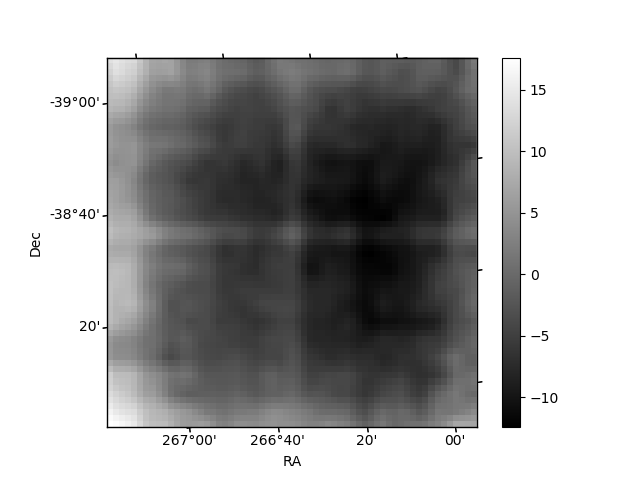
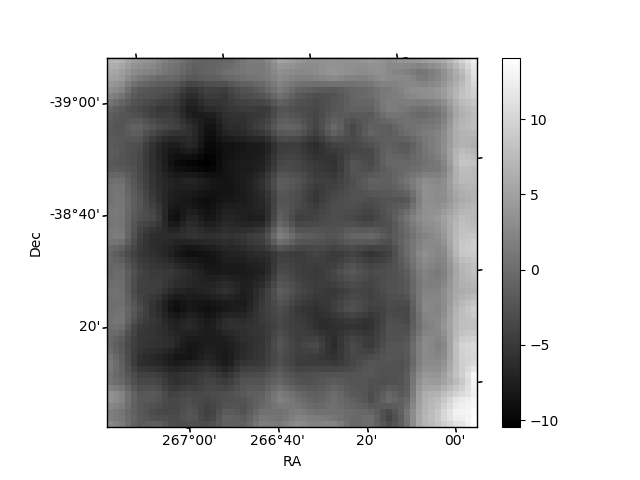
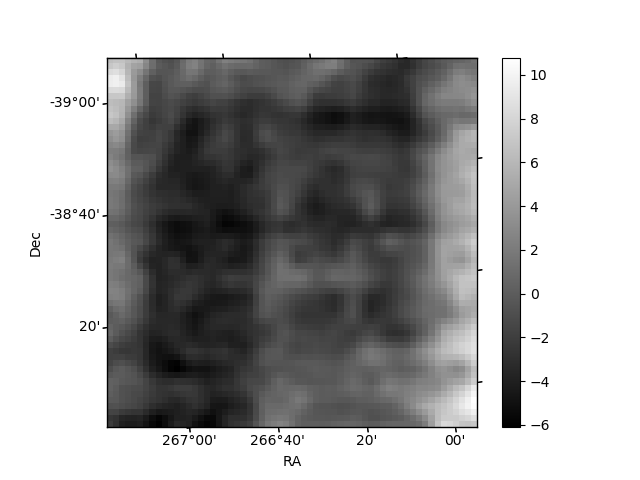
Histogram calculated using DETX and DETY for each event in the final _common_clean file
| Quadrant A | 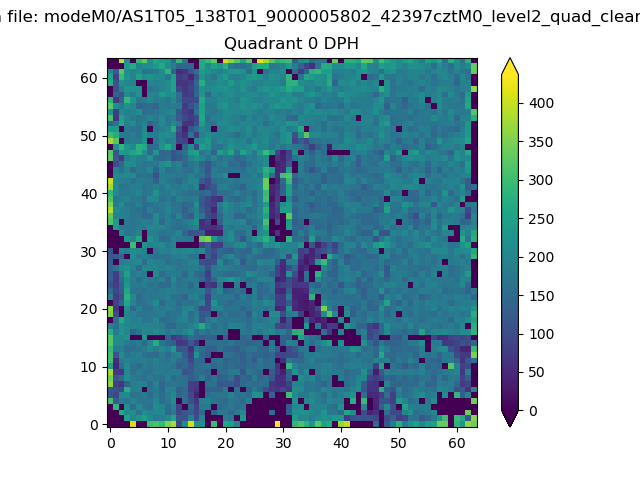 |
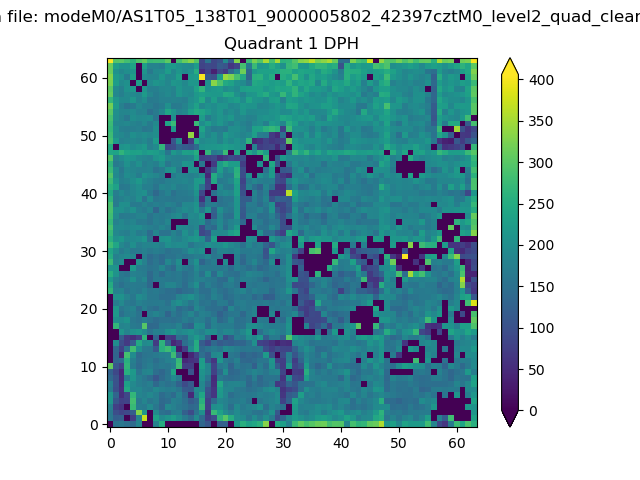 |
Quadrant B |
|---|---|---|---|
| Quadrant D | 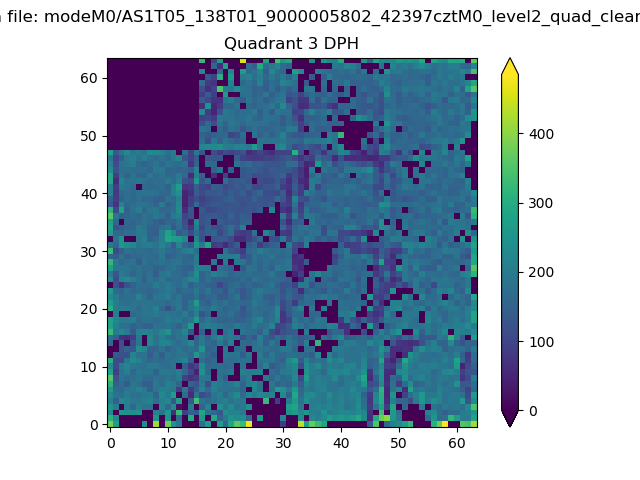 |
 |
Quadrant C |
| Plot type | Count rate plots | Images |
|---|---|---|
| Comparison with Poisson distribution Blue bars denote a histogram of data divided into 1 sec bins. Red curve is a Poisson curve with rate = median count rate of data. |
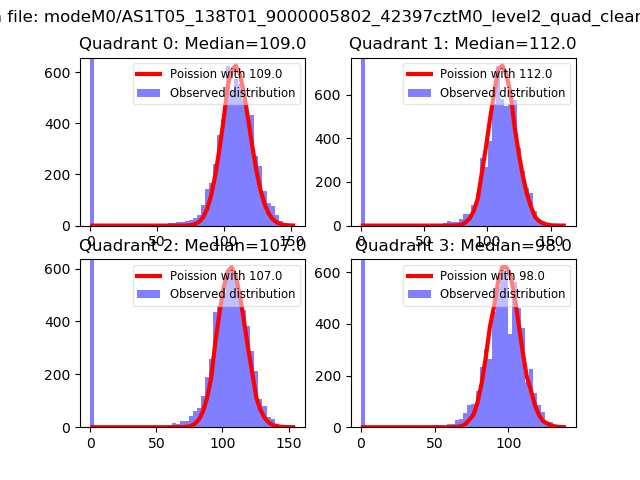 |
 |
| Quadrant-wise count rates Data is divided into 100 sec bins |
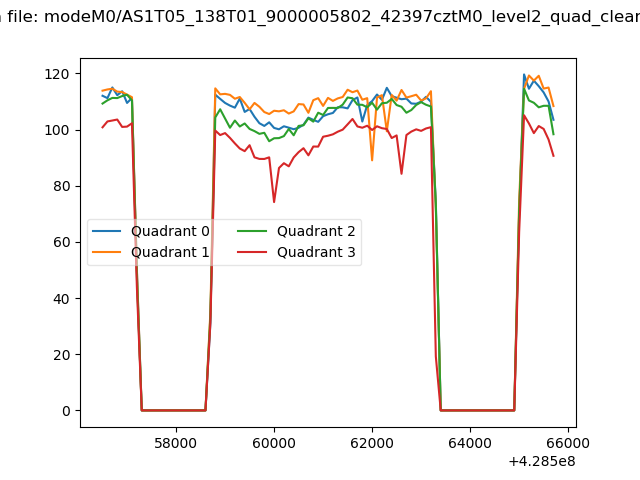 |
|
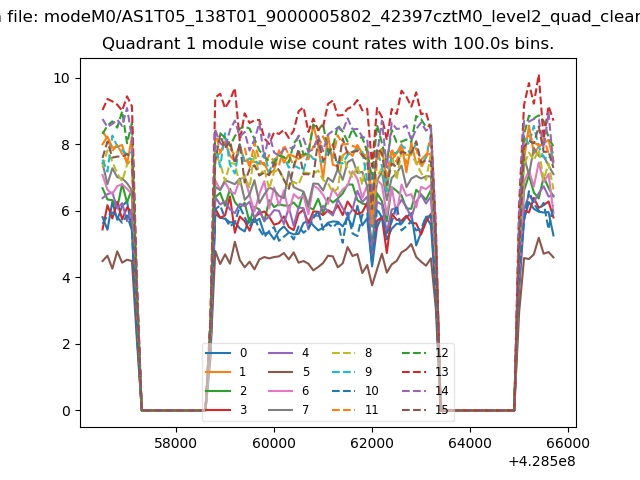
| Module-wise count rates for Quadrant A Data is divided into 100 sec bins |
 |
 |
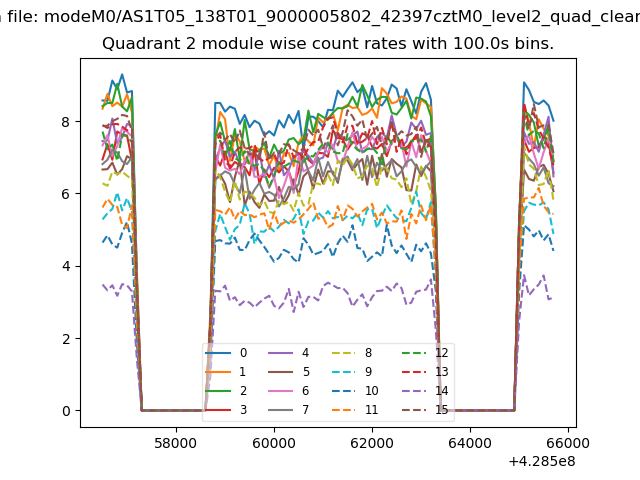
| Module-wise count rates for Quadrant B Data is divided into 100 sec bins |
 |
 |
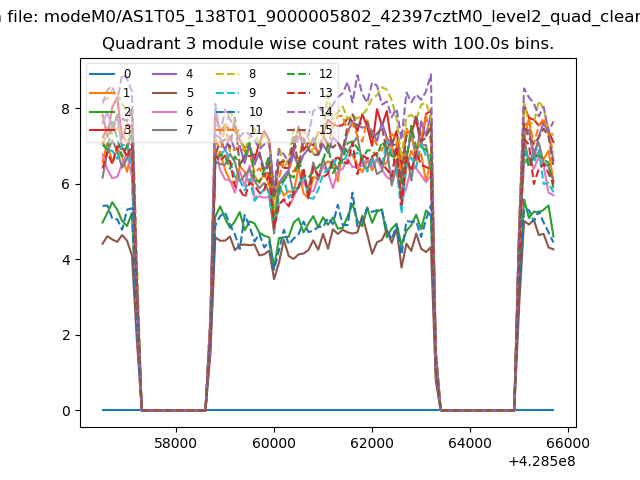
| Module-wise count rates for Quadrant C Data is divided into 100 sec bins |
 |
 |
| Module-wise count rates for Quadrant D Data is divided into 100 sec bins |
 |
 |
| Parameter | Plot |
|---|---|
| CZT HV Monitor | 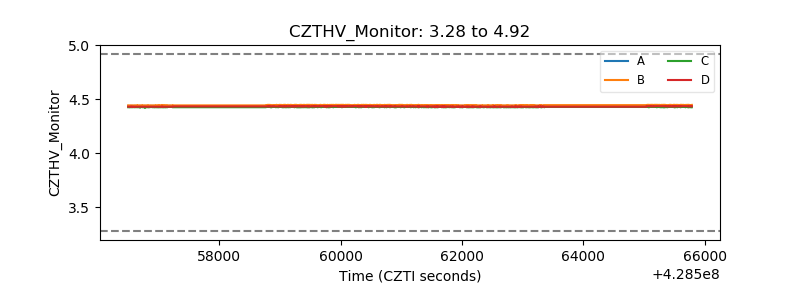 |
| D_VDD | 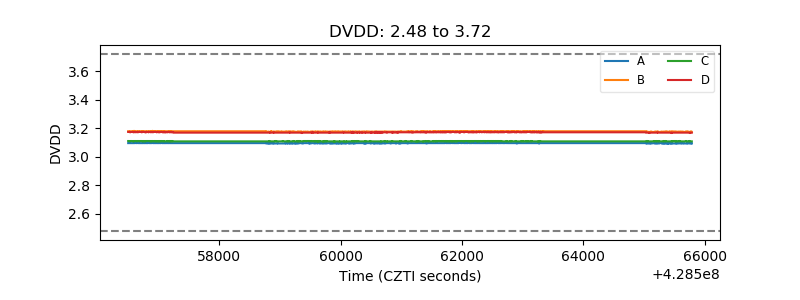 |
| Temperature 1 | 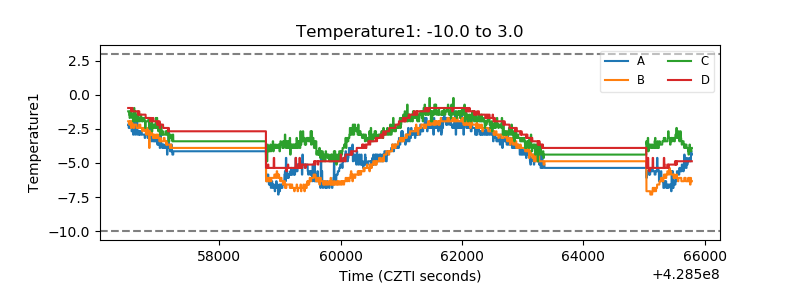 |
| Veto HV Monitor | 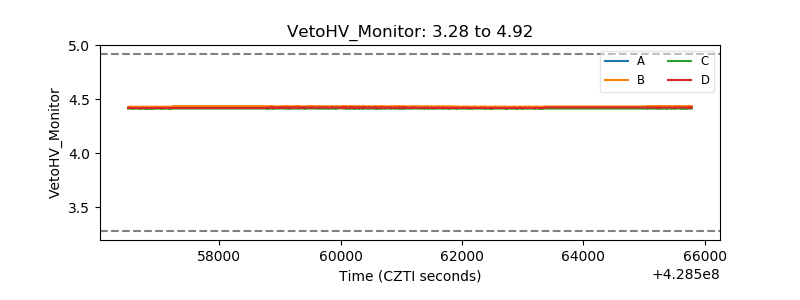 |
| Veto LLD | 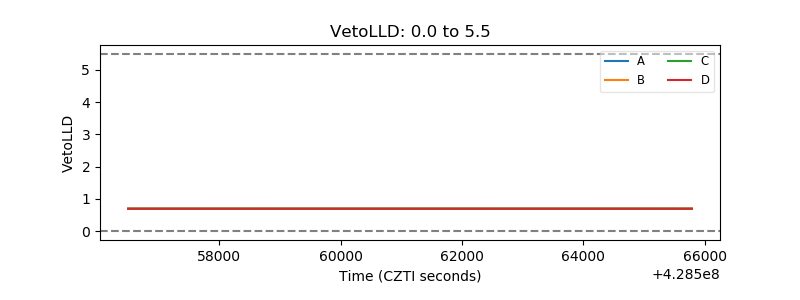 |
| Alpha Counter | 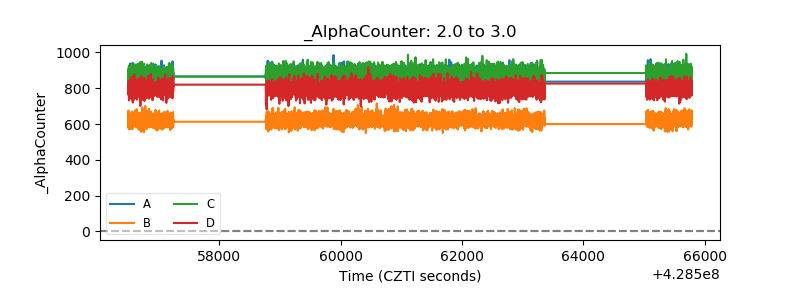 |
| _CPM_Rate | 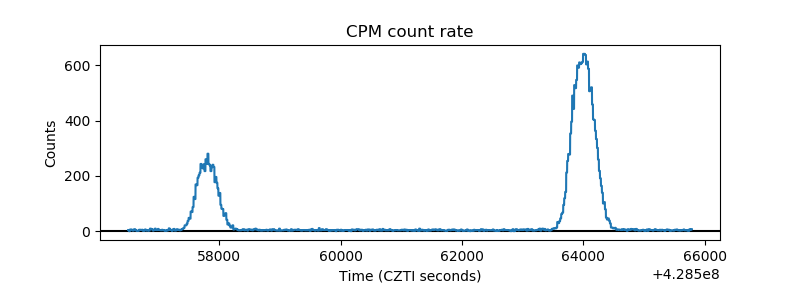 |
| CZT Counter | 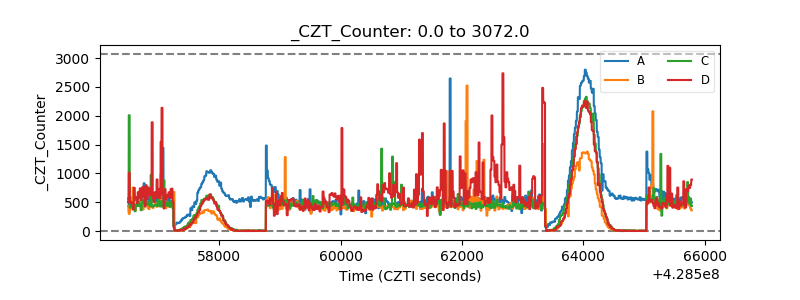 |
| +2.5 Volts monitor | 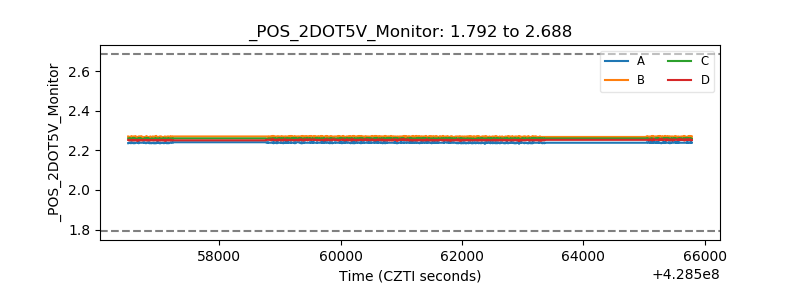 |
| +5 Volts monitor | 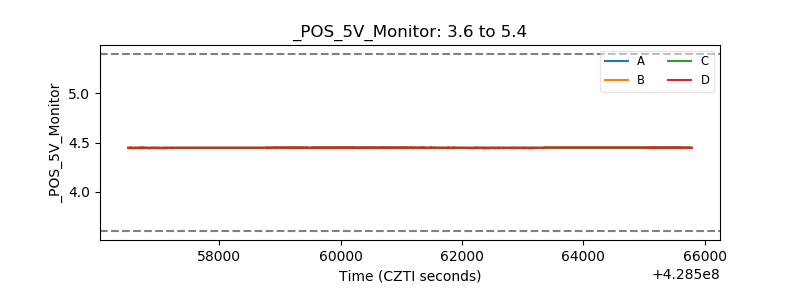 |
| _ROLL_ROT | 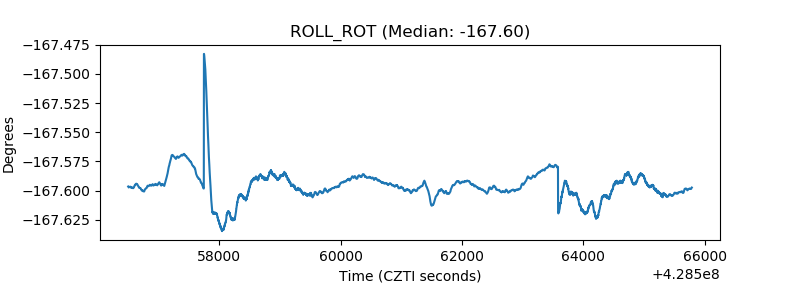 |
| _Roll_DEC | 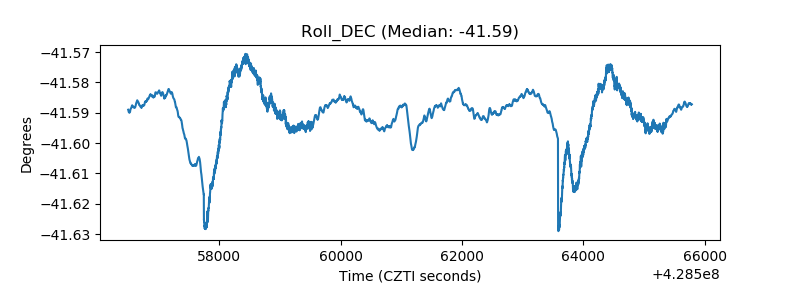 |
| _Roll_RA | 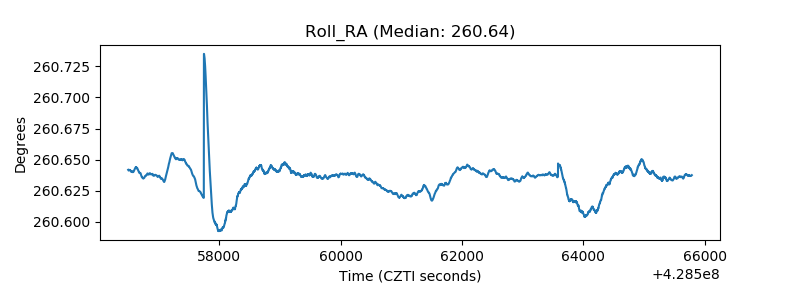 |
| Veto Counter | 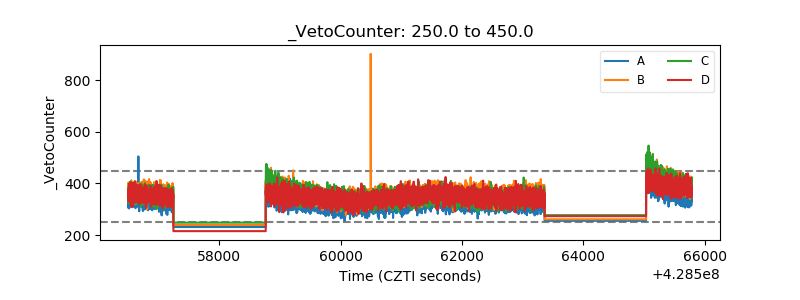 |