| Param | Original file | Final file |
|---|---|---|
| Filename | modeM0/AS1T05_138T01_9000005802_42399cztM0_level2.fits | modeM0/AS1T05_138T01_9000005802_42399cztM0_level2_quad_clean.evt |
| Size (bytes) | 347,811,840 | 93,680,640 |
| Size | 331.7 MB | 89.3 MB |
| Events in quadrant A | 3,032,931 | 633,988 |
| Events in quadrant B | 2,710,727 | 648,855 |
| Events in quadrant C | 3,308,413 | 602,921 |
| Events in quadrant D | 3,385,109 | 558,067 |
| Mode M9 | |||
|---|---|---|---|
| Quadrant | BADHDUFLAG | Total packets | Discarded packets |
| A | 0 | 34 | 0 |
| B | 0 | 34 | 0 |
| C | 0 | 34 | 0 |
| D | 0 | 34 | 0 |
| Mode M0 | |||
|---|---|---|---|
| Quadrant | BADHDUFLAG | Total packets | Discarded packets |
| A | 0 | 12246 | 2 |
| B | 0 | 11963 | 2 |
| C | 0 | 13320 | 2 |
| D | 0 | 13915 | 2 |
| Mode SS | |||
|---|---|---|---|
| Quadrant | BADHDUFLAG | Total packets | Discarded packets |
| A | 0 | 116 | 0 |
| B | 0 | 116 | 0 |
| C | 0 | 116 | 0 |
| D | 0 | 116 | 0 |
| Quadrant | Total seconds | Saturated seconds | Saturation percentage |
|---|---|---|---|
| A | 5618 | 12 | 0.213599% |
| B | 5618 | 47 | 0.836597% |
| C | 5618 | 195 | 3.470986% |
| D | 5619 | 138 | 2.455953% |
Noise dominated data is calculated using 1-second bins in cleaned event files. If a bin has >2000 counts, and if more than 50% of those come from <1% of pixels, then it is considered to be noise-dominated and hence unusable.
| Quadrant | # 1 sec bins | Bins with >0 counts | Bins with >2000 counts | High rate bins dominated by noise | Noise dominated (total time) | Noise dominated (detector-on time) | Marked lightcurve |
|---|---|---|---|---|---|---|---|
| A | 9055 | 5620 | 3 | 3 | 0.03% | 0.05% | 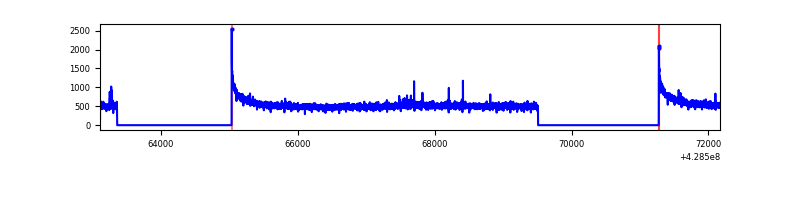 |
| B | 9055 | 5620 | 30 | 30 | 0.33% | 0.53% | 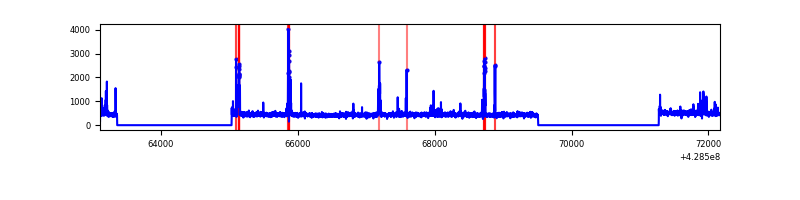 |
| C | 9055 | 5620 | 147 | 147 | 1.62% | 2.62% | 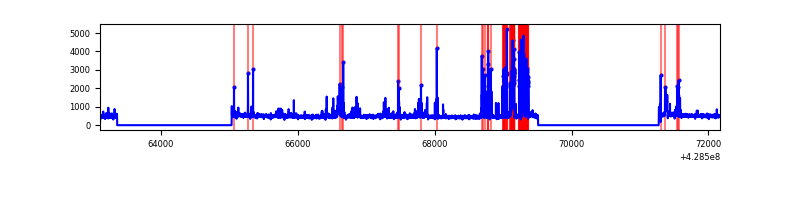 |
| D | 9056 | 5621 | 88 | 88 | 0.97% | 1.57% | 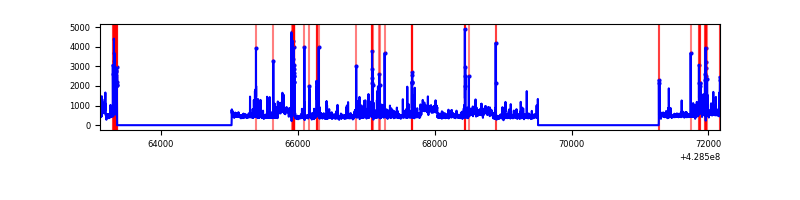 |
Top three noisy pixels from each quadrant. If the there are fewer than three noisy pixels in the level2.evt file, extra rows are filled as -1
| Pixel properties | Quadrant properties | ||||||
|---|---|---|---|---|---|---|---|
| Quadrant | DetID | PixID | Counts | Sigma | Mean | Median | Sigma |
| A | 10 | 83 | 577742 | 4494.43 | 627 | 614 | 128.4 |
| A | 13 | 6 | 16470 | 123.48 | 627 | 614 | 128.4 |
| A | 13 | 248 | 8007 | 57.57 | 627 | 614 | 128.4 |
| B | 5 | 172 | 80381 | 668.6 | 621 | 605 | 119.3 |
| B | 5 | 255 | 80050 | 665.82 | 621 | 605 | 119.3 |
| B | 0 | 245 | 42611 | 352.05 | 621 | 605 | 119.3 |
| C | 4 | 254 | 716035 | 5105.59 | 599 | 601 | 140.1 |
| C | 15 | 214 | 232897 | 1657.75 | 599 | 601 | 140.1 |
| C | 14 | 254 | 13383 | 91.22 | 599 | 601 | 140.1 |
| D | 2 | 16 | 369180 | 2513.3 | 602 | 585 | 146.7 |
| D | 2 | 249 | 130349 | 884.81 | 602 | 585 | 146.7 |
| D | 1 | 52 | 127832 | 867.65 | 602 | 585 | 146.7 |
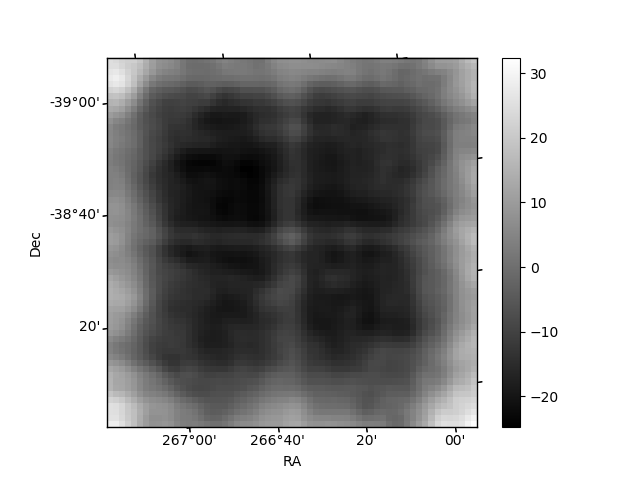
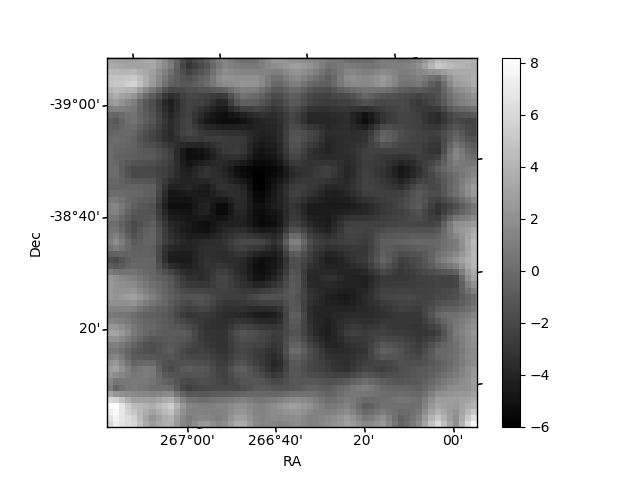
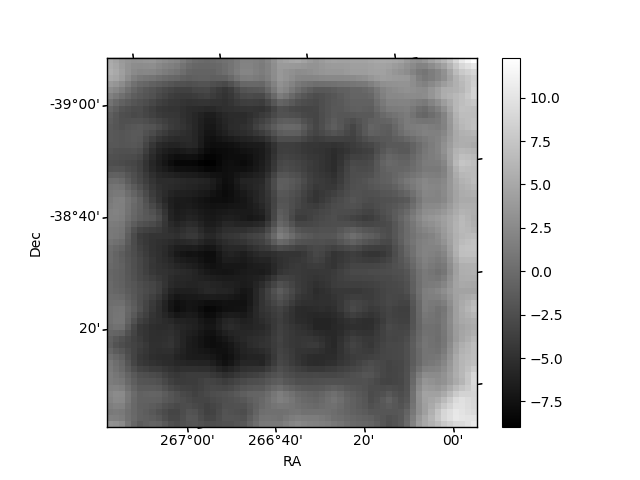
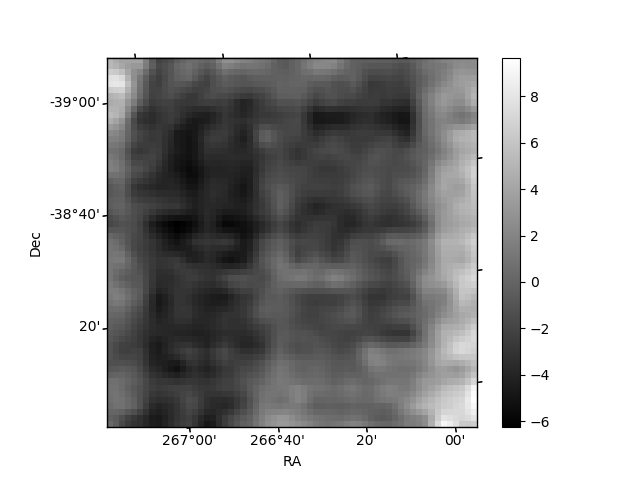
Histogram calculated using DETX and DETY for each event in the final _common_clean file
| Quadrant A | 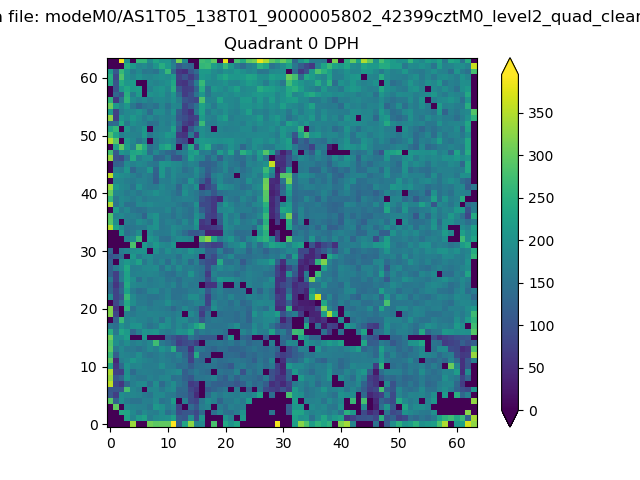 |
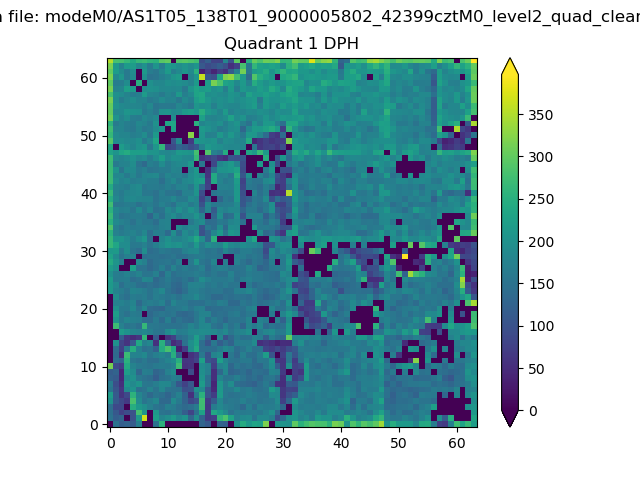 |
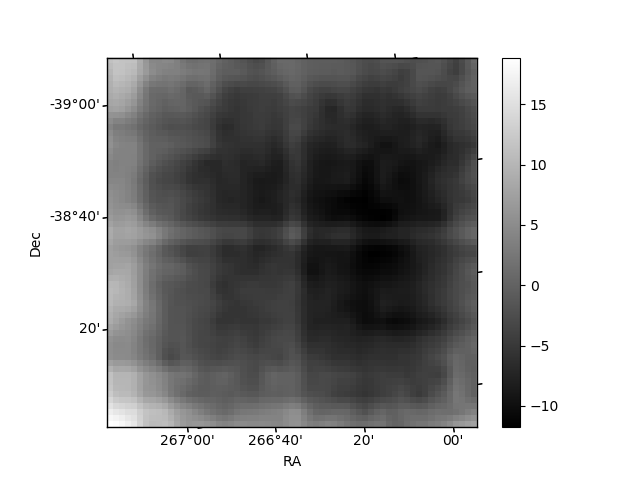
Quadrant B |
|---|---|---|---|
| Quadrant D | 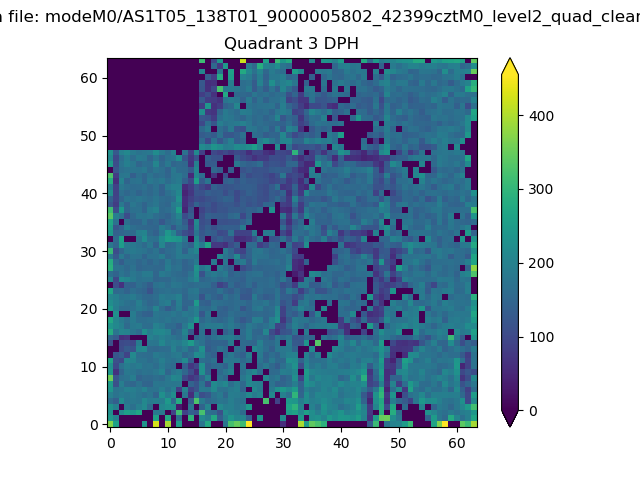 |
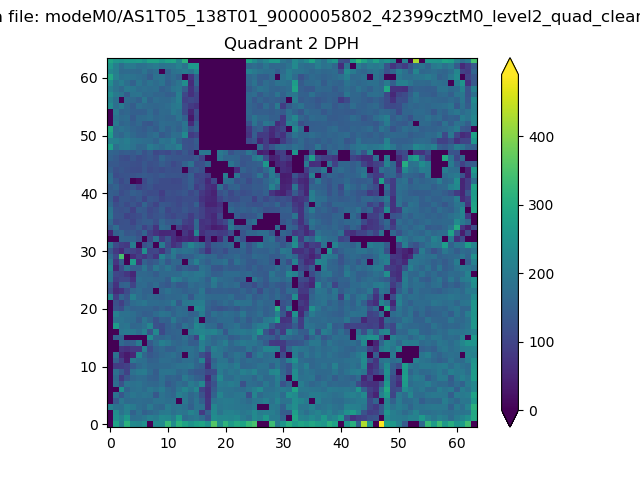 |
Quadrant C |
| Plot type | Count rate plots | Images |
|---|---|---|
| Comparison with Poisson distribution Blue bars denote a histogram of data divided into 1 sec bins. Red curve is a Poisson curve with rate = median count rate of data. |
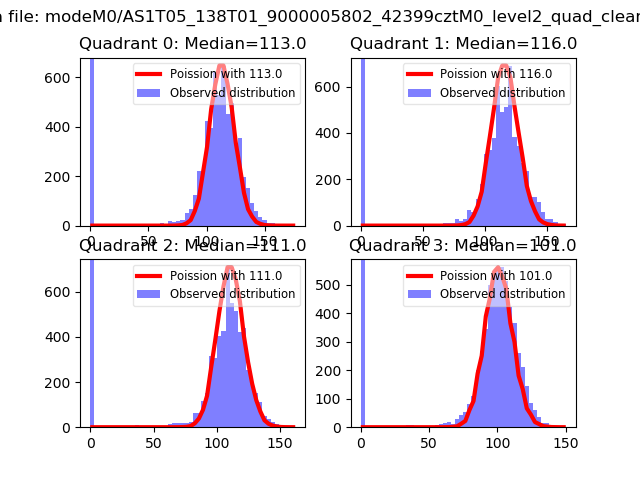 |
 |
| Quadrant-wise count rates Data is divided into 100 sec bins |
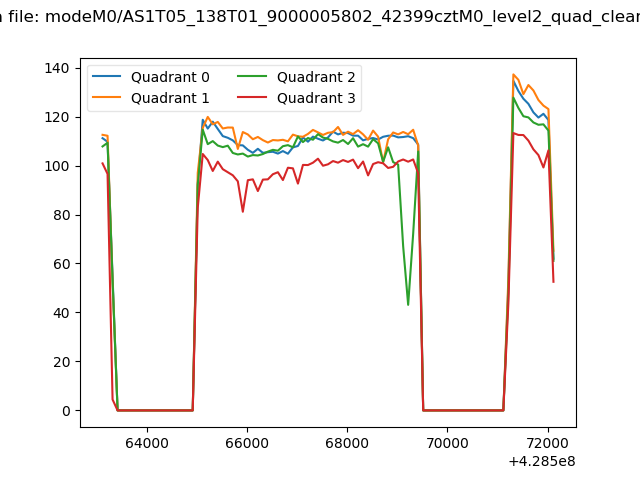 |
|
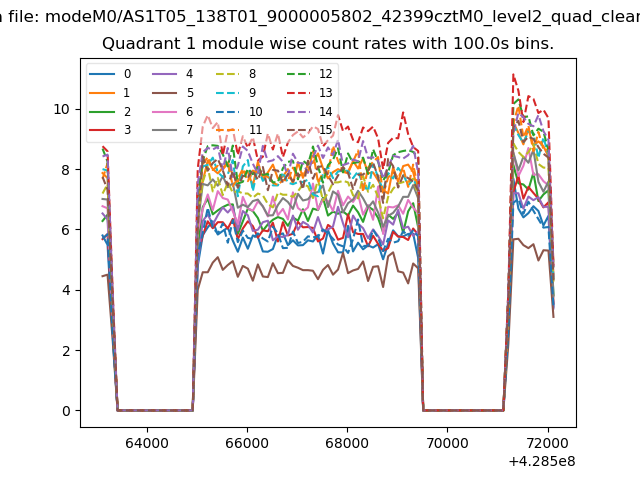
| Module-wise count rates for Quadrant A Data is divided into 100 sec bins |
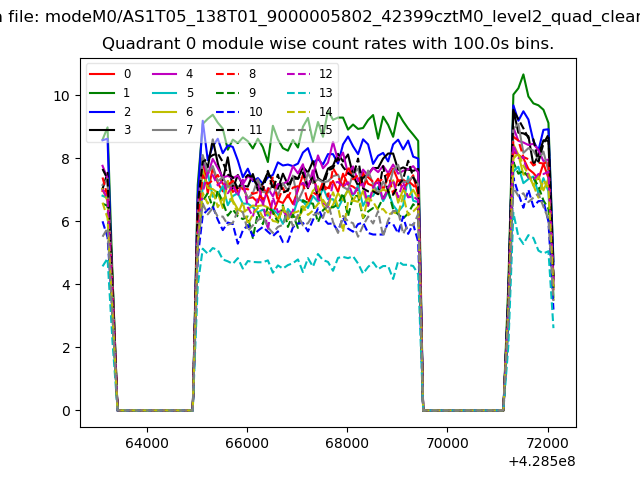 |
 |
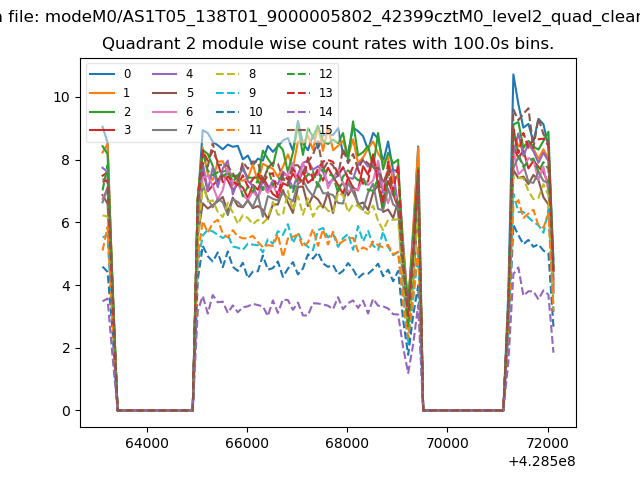
| Module-wise count rates for Quadrant B Data is divided into 100 sec bins |
 |
 |
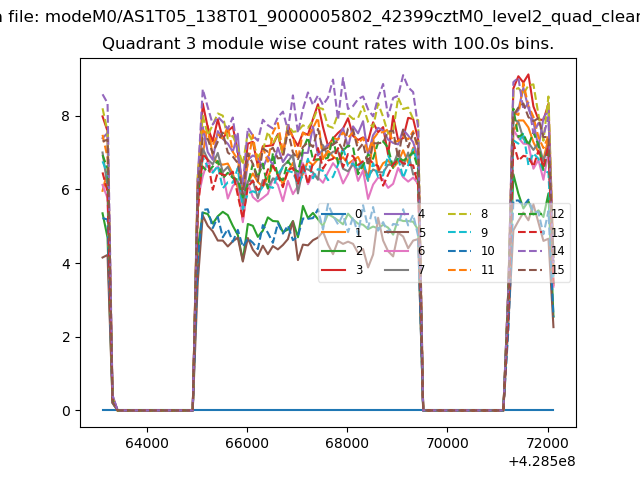
| Module-wise count rates for Quadrant C Data is divided into 100 sec bins |
 |
 |
| Module-wise count rates for Quadrant D Data is divided into 100 sec bins |
 |
 |
| Parameter | Plot |
|---|---|
| CZT HV Monitor | 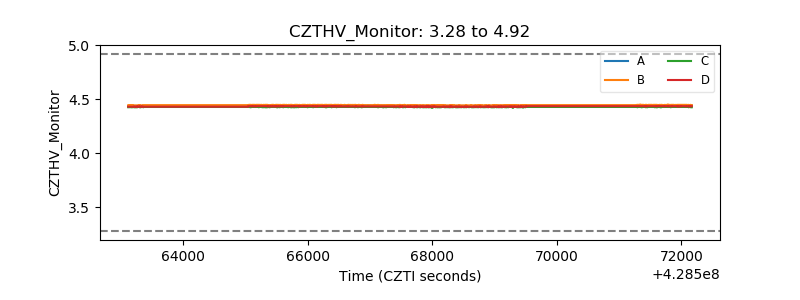 |
| D_VDD | 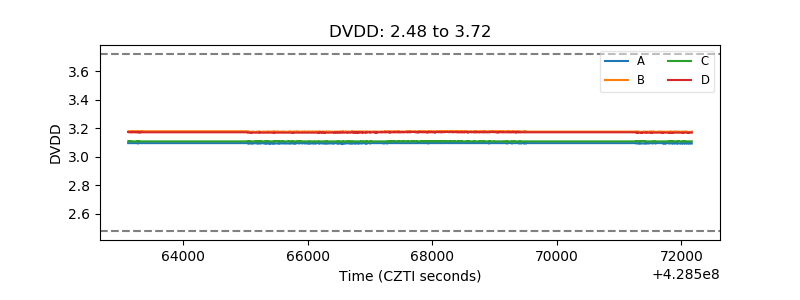 |
| Temperature 1 | 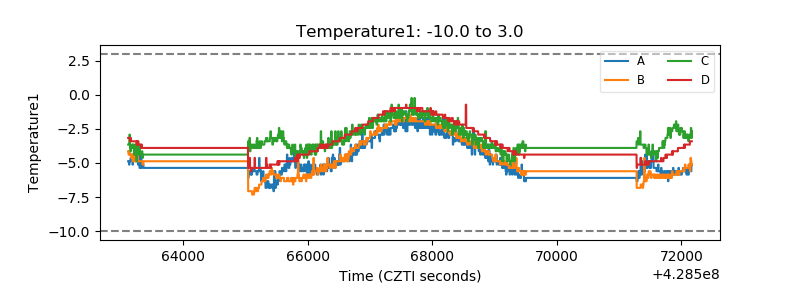 |
| Veto HV Monitor | 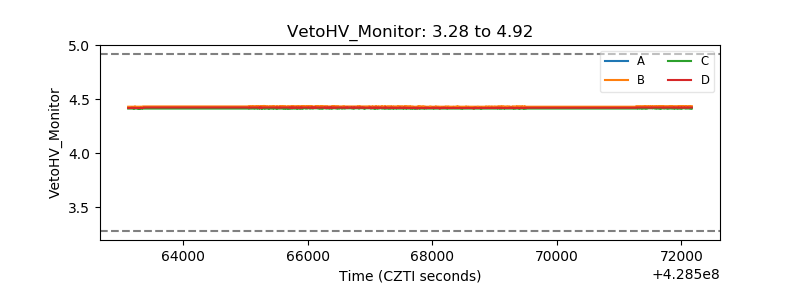 |
| Veto LLD | 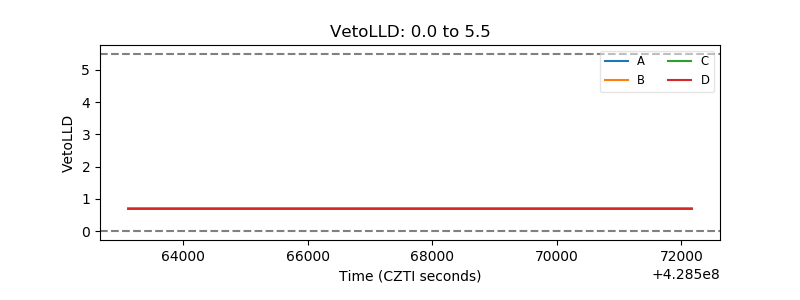 |
| Alpha Counter | 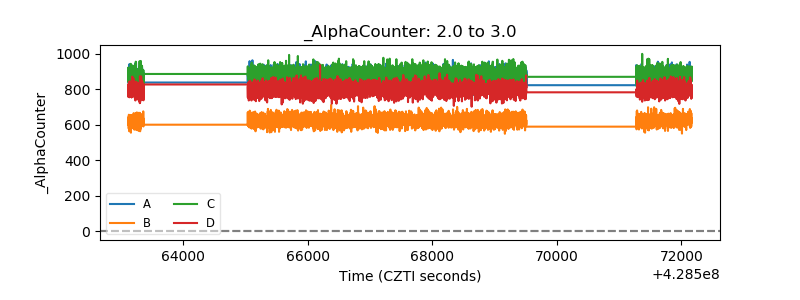 |
| _CPM_Rate | 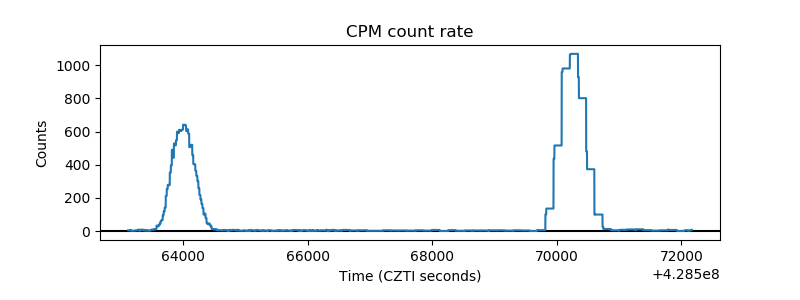 |
| CZT Counter | 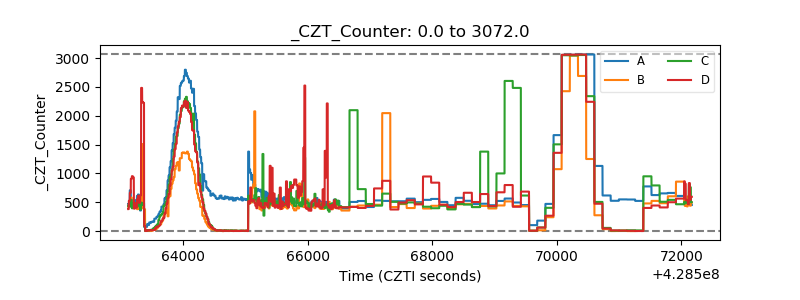 |
| +2.5 Volts monitor | 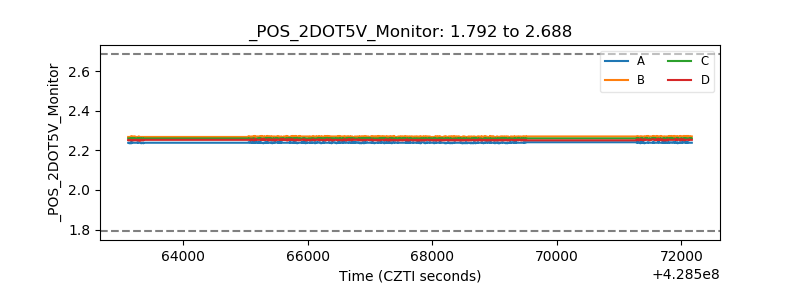 |
| +5 Volts monitor |  |
| _ROLL_ROT |  |
| _Roll_DEC | 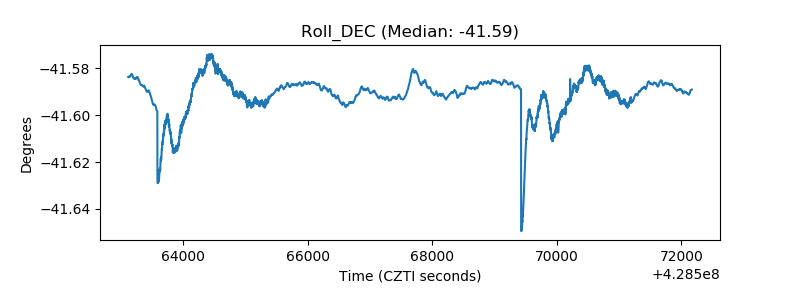 |
| _Roll_RA | 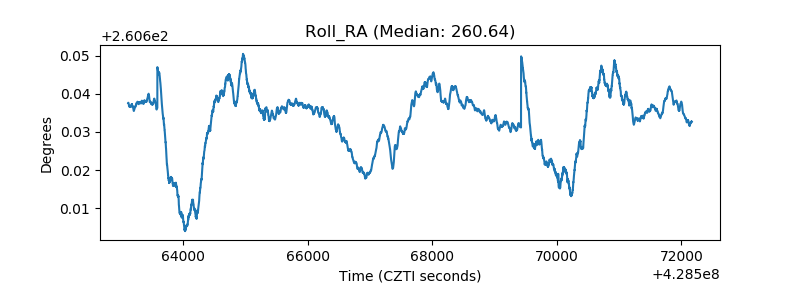 |
| Veto Counter | 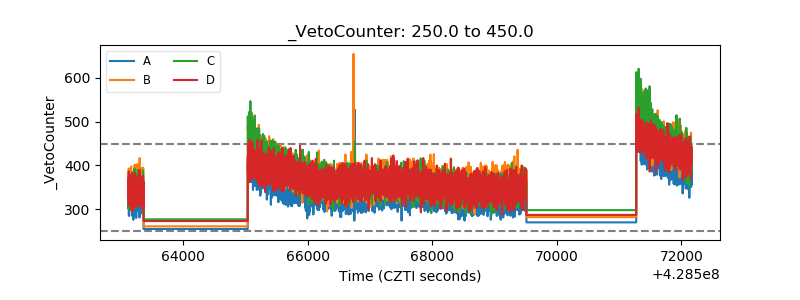 |