| Param | Original file | Final file |
|---|---|---|
| Filename | modeM0/AS1A12_101T04_9000005804_42417cztM0_level2.fits | modeM0/AS1A12_101T04_9000005804_42417cztM0_level2_quad_clean.evt |
| Size (bytes) | 61,839,360 | 14,425,920 |
| Size | 59.0 MB | 13.8 MB |
| Events in quadrant A | 527,911 | 102,114 |
| Events in quadrant B | 386,253 | 103,831 |
| Events in quadrant C | 438,275 | 93,269 |
| Events in quadrant D | 872,154 | 75,549 |
| Mode M0 | |||
|---|---|---|---|
| Quadrant | BADHDUFLAG | Total packets | Discarded packets |
| A | 0 | 2123 | 1 |
| B | 0 | 1582 | 1 |
| C | 0 | 1738 | 1 |
| D | 0 | 3114 | 1 |
| Mode M9 | |||
|---|---|---|---|
| Quadrant | BADHDUFLAG | Total packets | Discarded packets |
| A | 0 | 19 | 0 |
| B | 0 | 19 | 0 |
| C | 0 | 19 | 0 |
| D | 0 | 19 | 0 |
| Mode SS | |||
|---|---|---|---|
| Quadrant | BADHDUFLAG | Total packets | Discarded packets |
| A | 0 | 16 | 0 |
| B | 0 | 16 | 0 |
| C | 0 | 16 | 0 |
| D | 0 | 16 | 0 |
| Quadrant | Total seconds | Saturated seconds | Saturation percentage |
|---|---|---|---|
| A | 787 | 4 | 0.508259% |
| B | 787 | 2 | 0.254130% |
| C | 787 | 3 | 0.381194% |
| D | 787 | 133 | 16.899619% |
Noise dominated data is calculated using 1-second bins in cleaned event files. If a bin has >2000 counts, and if more than 50% of those come from <1% of pixels, then it is considered to be noise-dominated and hence unusable.
| Quadrant | # 1 sec bins | Bins with >0 counts | Bins with >2000 counts | High rate bins dominated by noise | Noise dominated (total time) | Noise dominated (detector-on time) | Marked lightcurve |
|---|---|---|---|---|---|---|---|
| A | 787 | 787 | 1 | 1 | 0.13% | 0.13% | 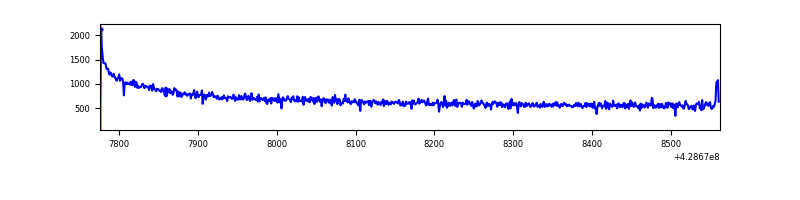 |
| B | 787 | 787 | 0 | 0 | 0.00% | 0.00% | 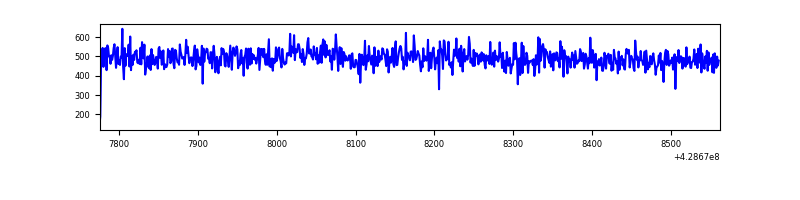 |
| C | 787 | 787 | 4 | 4 | 0.51% | 0.51% | 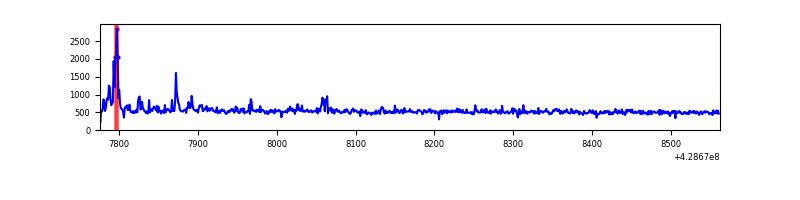 |
| D | 787 | 787 | 106 | 106 | 13.47% | 13.47% | 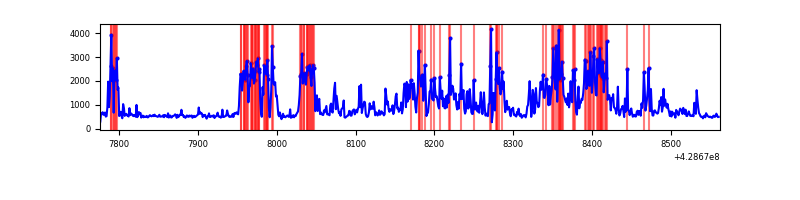 |
Top three noisy pixels from each quadrant. If the there are fewer than three noisy pixels in the level2.evt file, extra rows are filled as -1
| Pixel properties | Quadrant properties | ||||||
|---|---|---|---|---|---|---|---|
| Quadrant | DetID | PixID | Counts | Sigma | Mean | Median | Sigma |
| A | 10 | 83 | 139833 | 6346.61 | 99 | 97 | 22.0 |
| A | 7 | 3 | 2317 | 100.83 | 99 | 97 | 22.0 |
| A | 13 | 6 | 1139 | 47.33 | 99 | 97 | 22.0 |
| B | 12 | 111 | 2403 | 110.52 | 98 | 95 | 20.9 |
| B | 11 | 111 | 2216 | 101.56 | 98 | 95 | 20.9 |
| B | 14 | 111 | 2164 | 99.07 | 98 | 95 | 20.9 |
| C | 15 | 214 | 37925 | 1620.3 | 94 | 94 | 23.3 |
| C | 14 | 254 | 18157 | 773.64 | 94 | 94 | 23.3 |
| C | 15 | 111 | 8084 | 342.21 | 94 | 94 | 23.3 |
| D | 12 | 33 | 336364 | 14091.2 | 90 | 87 | 23.9 |
| D | 1 | 52 | 124528 | 5214.52 | 90 | 87 | 23.9 |
| D | 12 | 6 | 26584 | 1110.32 | 90 | 87 | 23.9 |
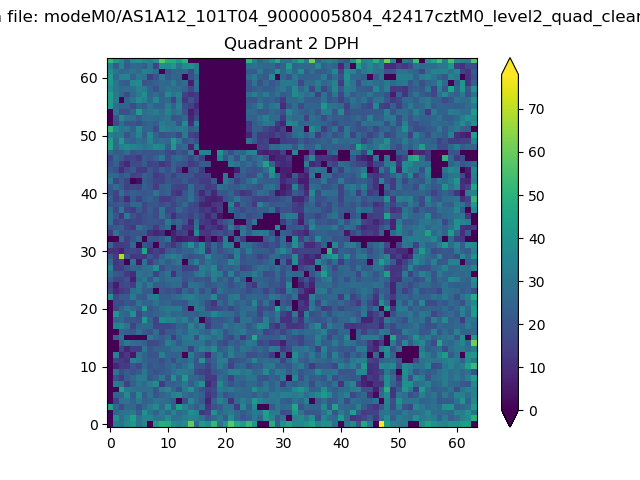
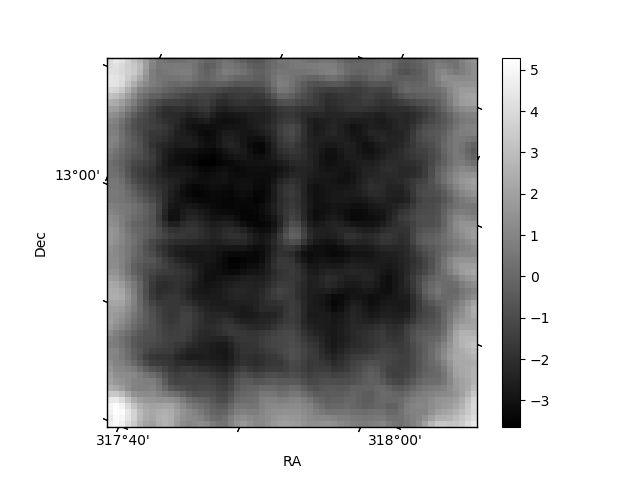
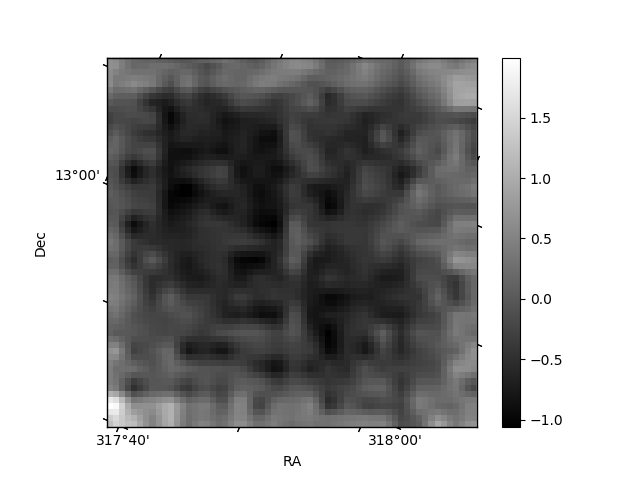
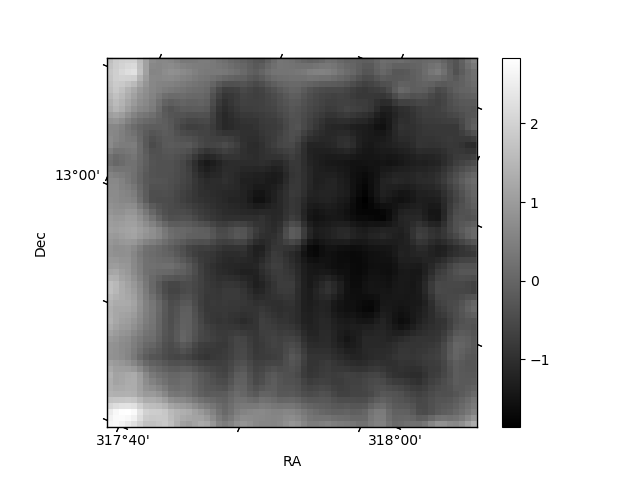
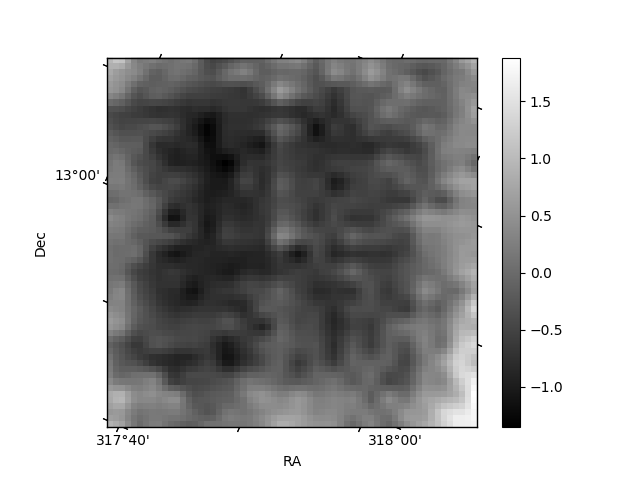
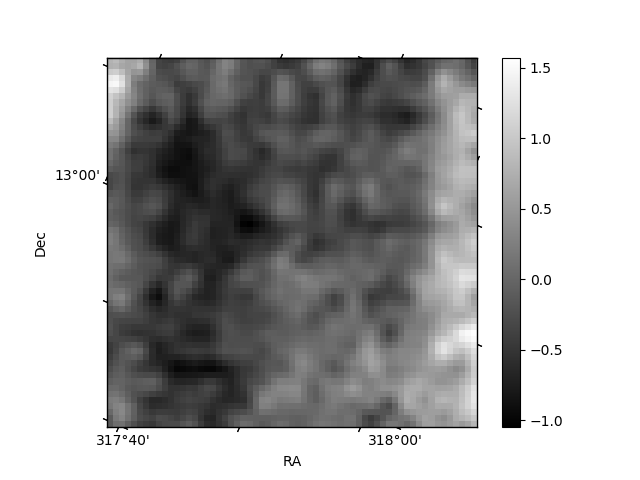
Histogram calculated using DETX and DETY for each event in the final _common_clean file
| Quadrant A | 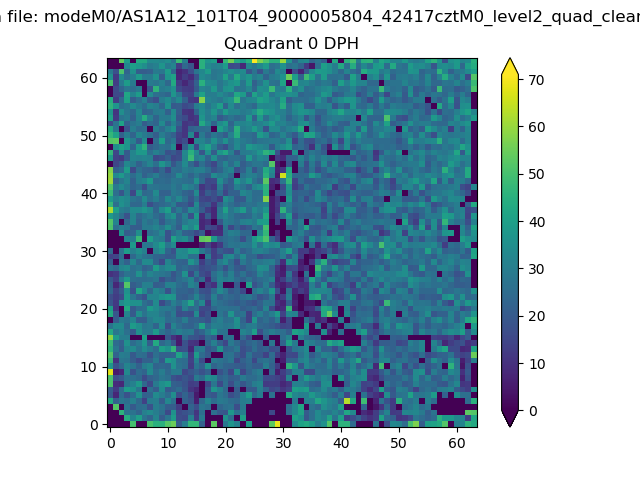 |
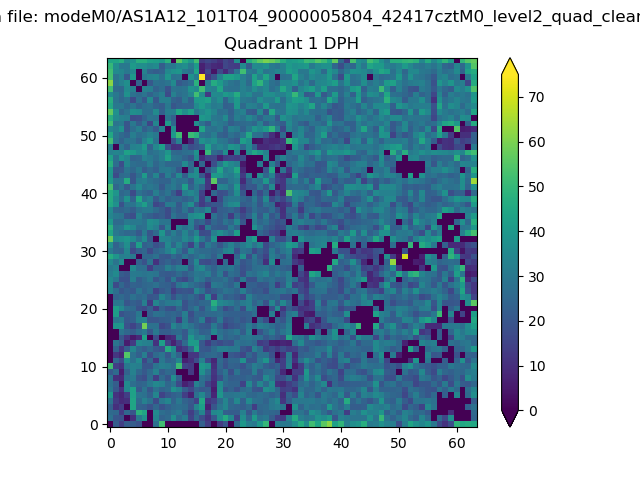 |
Quadrant B |
|---|---|---|---|
| Quadrant D | 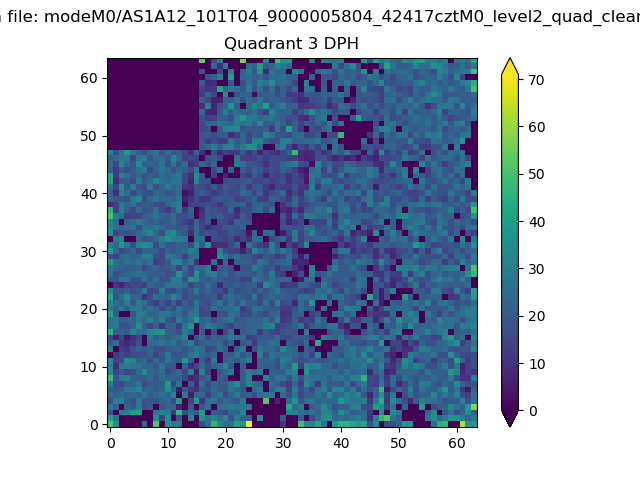 |
 |
Quadrant C |
| Plot type | Count rate plots | Images |
|---|---|---|
| Comparison with Poisson distribution Blue bars denote a histogram of data divided into 1 sec bins. Red curve is a Poisson curve with rate = median count rate of data. |
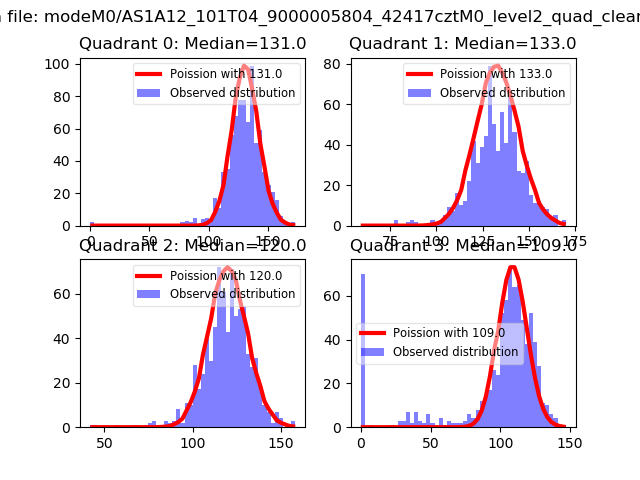 |
 |
| Quadrant-wise count rates Data is divided into 100 sec bins |
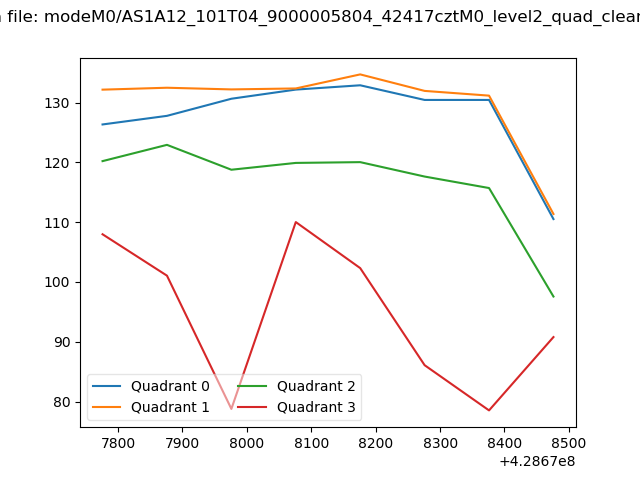 |
|
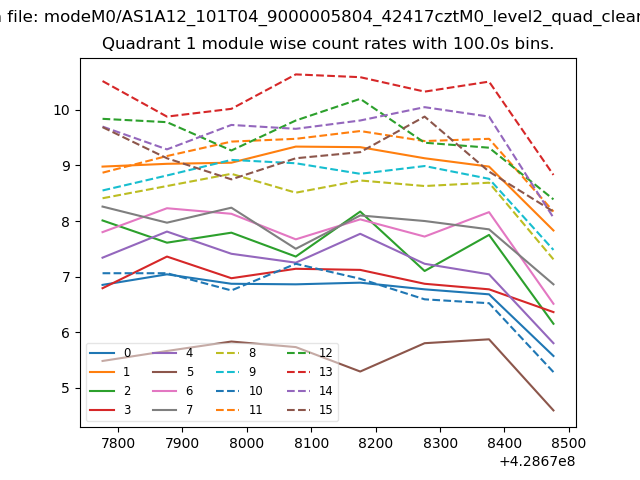
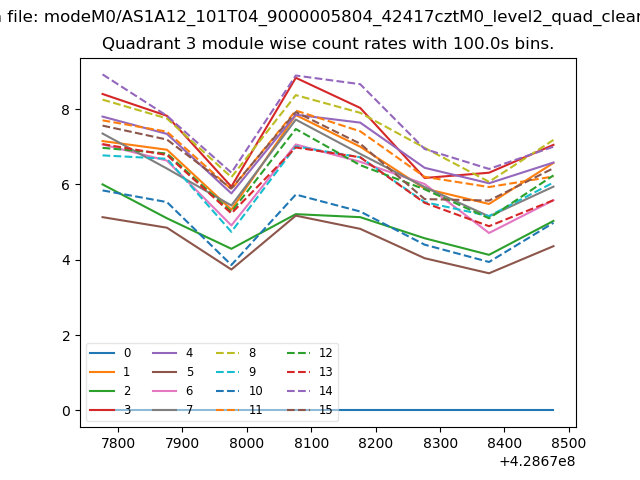
| Module-wise count rates for Quadrant A Data is divided into 100 sec bins |
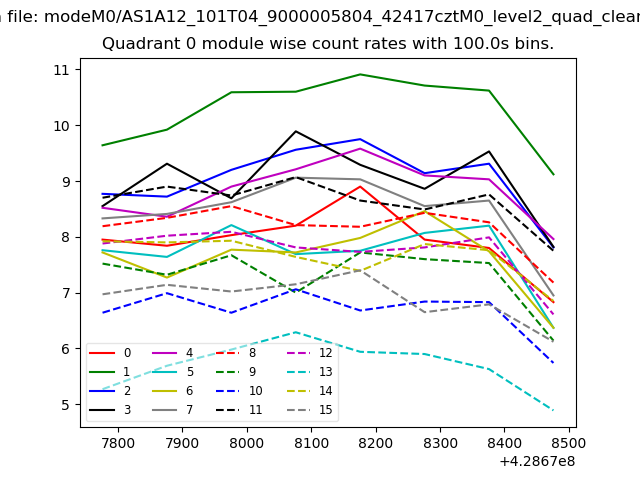 |
 |
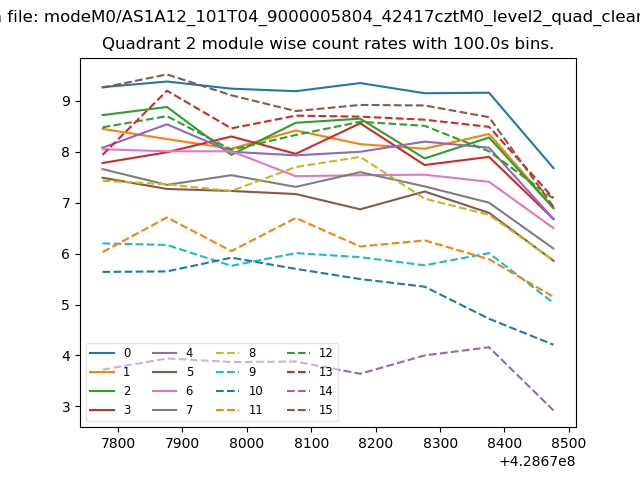
| Module-wise count rates for Quadrant B Data is divided into 100 sec bins |
 |
 |
| Module-wise count rates for Quadrant C Data is divided into 100 sec bins |
 |
 |
| Module-wise count rates for Quadrant D Data is divided into 100 sec bins |
 |
 |
| Parameter | Plot |
|---|---|
| CZT HV Monitor | 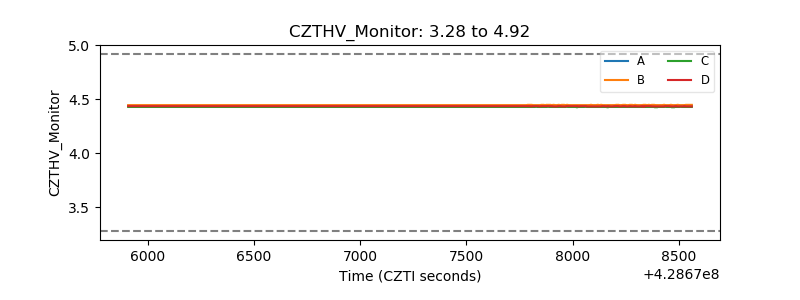 |
| D_VDD | 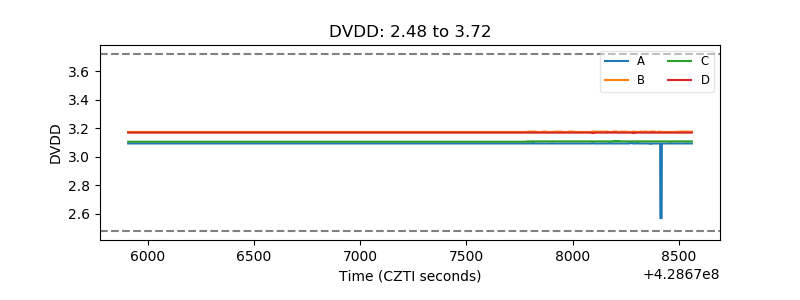 |
| Temperature 1 | 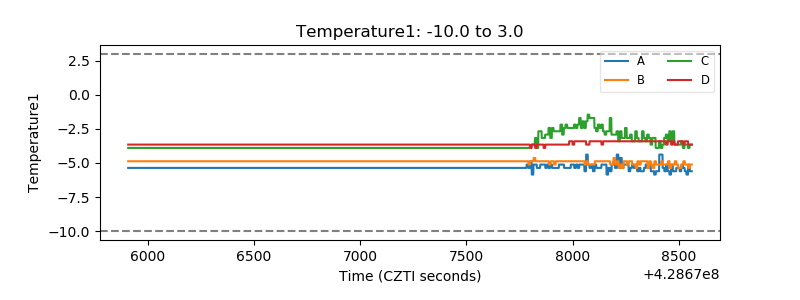 |
| Veto HV Monitor | 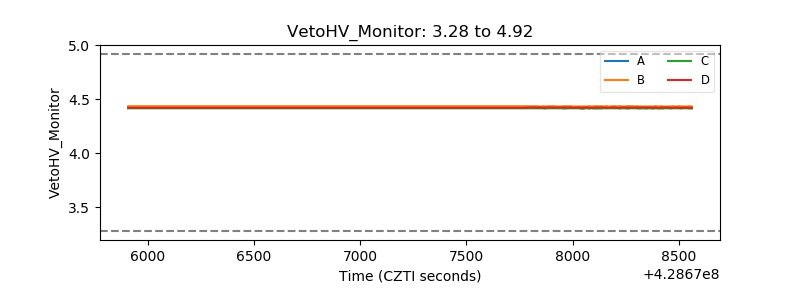 |
| Veto LLD | 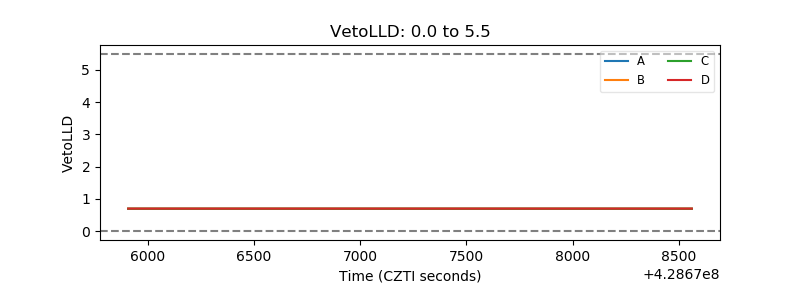 |
| Alpha Counter | 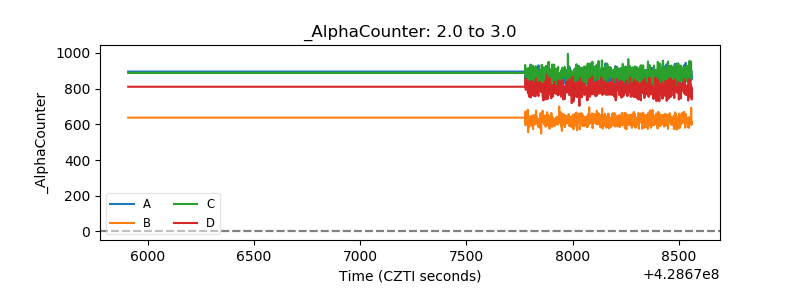 |
| _CPM_Rate | 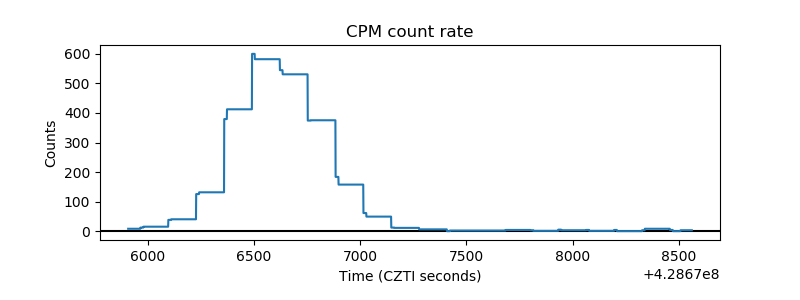 |
| CZT Counter | 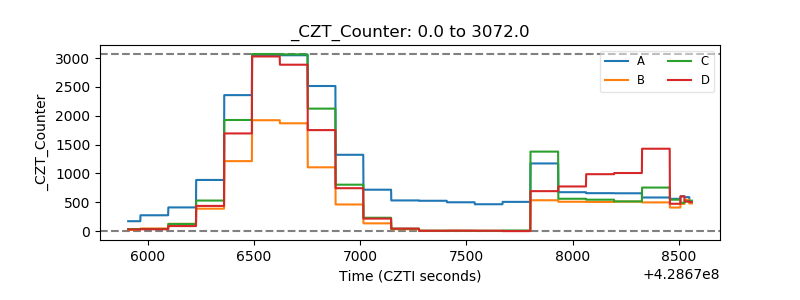 |
| +2.5 Volts monitor | 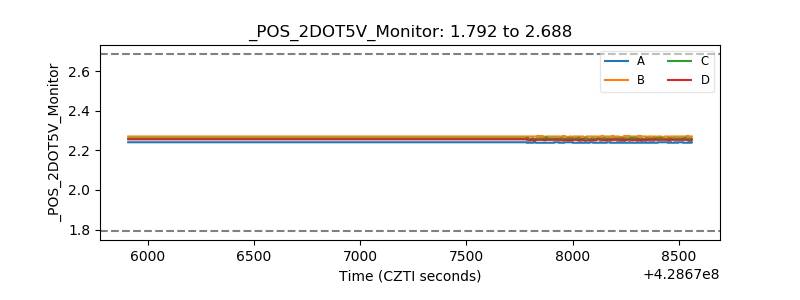 |
| +5 Volts monitor | 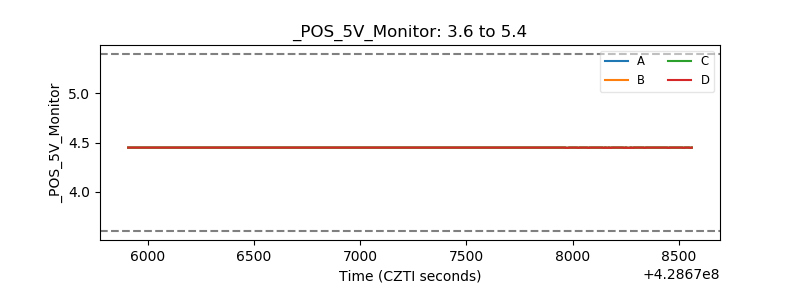 |
| _ROLL_ROT | 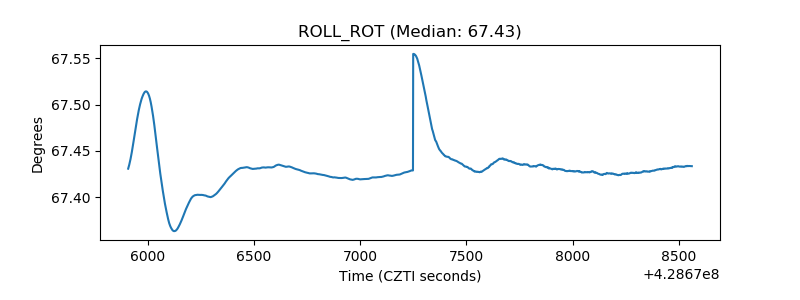 |
| _Roll_DEC | 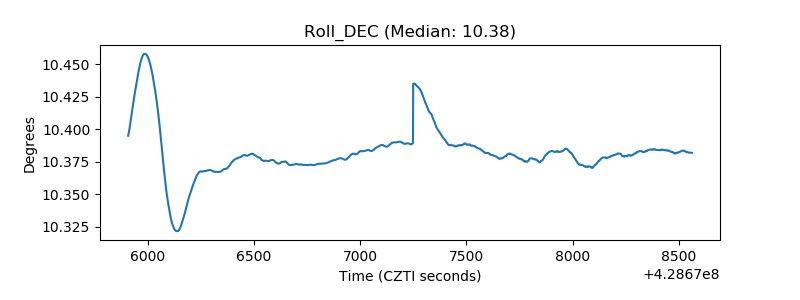 |
| _Roll_RA | 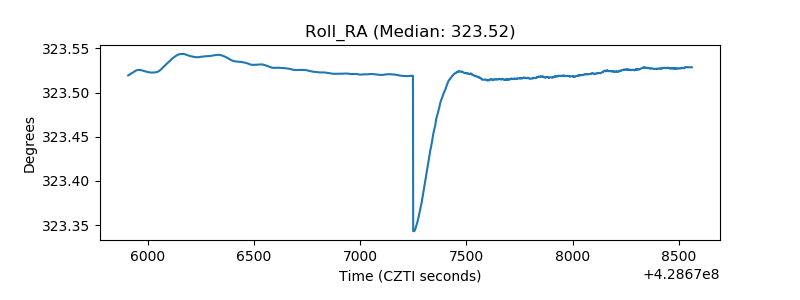 |
| Veto Counter | 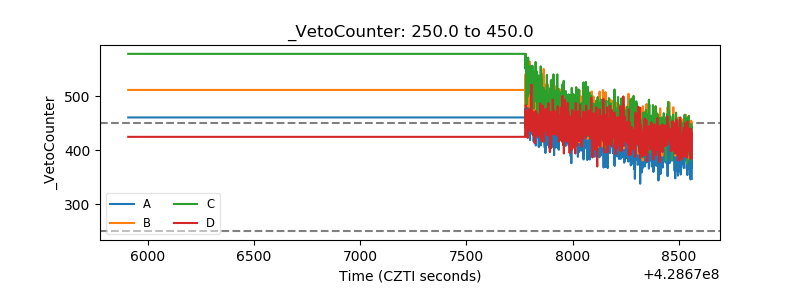 |