| Param | Original file | Final file |
|---|---|---|
| Filename | modeM0/AS1A12_101T04_9000005804_42418cztM0_level2.fits | modeM0/AS1A12_101T04_9000005804_42418cztM0_level2_quad_clean.evt |
| Size (bytes) | 327,879,360 | 86,382,720 |
| Size | 312.7 MB | 82.4 MB |
| Events in quadrant A | 2,712,885 | 604,240 |
| Events in quadrant B | 2,262,849 | 609,980 |
| Events in quadrant C | 2,435,193 | 562,696 |
| Events in quadrant D | 4,342,412 | 493,301 |
| Mode M0 | |||
|---|---|---|---|
| Quadrant | BADHDUFLAG | Total packets | Discarded packets |
| A | 0 | 11040 | 2 |
| B | 0 | 9999 | 2 |
| C | 0 | 10141 | 2 |
| D | 0 | 16199 | 2 |
| Mode M9 | |||
|---|---|---|---|
| Quadrant | BADHDUFLAG | Total packets | Discarded packets |
| A | 0 | 40 | 0 |
| B | 0 | 40 | 0 |
| C | 0 | 40 | 0 |
| D | 0 | 40 | 0 |
| Mode SS | |||
|---|---|---|---|
| Quadrant | BADHDUFLAG | Total packets | Discarded packets |
| A | 0 | 102 | 0 |
| B | 0 | 102 | 0 |
| C | 0 | 102 | 0 |
| D | 0 | 102 | 0 |
| Quadrant | Total seconds | Saturated seconds | Saturation percentage |
|---|---|---|---|
| A | 4924 | 15 | 0.304630% |
| B | 4924 | 26 | 0.528026% |
| C | 4924 | 4 | 0.081235% |
| D | 4924 | 370 | 7.514216% |
Noise dominated data is calculated using 1-second bins in cleaned event files. If a bin has >2000 counts, and if more than 50% of those come from <1% of pixels, then it is considered to be noise-dominated and hence unusable.
| Quadrant | # 1 sec bins | Bins with >0 counts | Bins with >2000 counts | High rate bins dominated by noise | Noise dominated (total time) | Noise dominated (detector-on time) | Marked lightcurve |
|---|---|---|---|---|---|---|---|
| A | 7046 | 4925 | 5 | 5 | 0.07% | 0.10% | 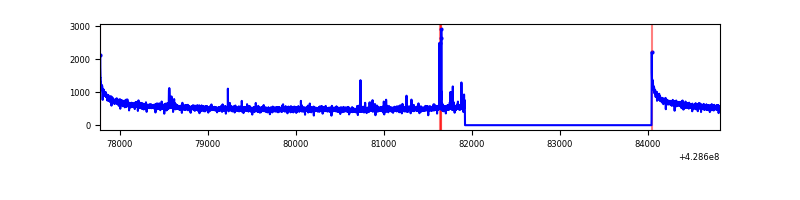 |
| B | 7046 | 4925 | 14 | 14 | 0.20% | 0.28% | 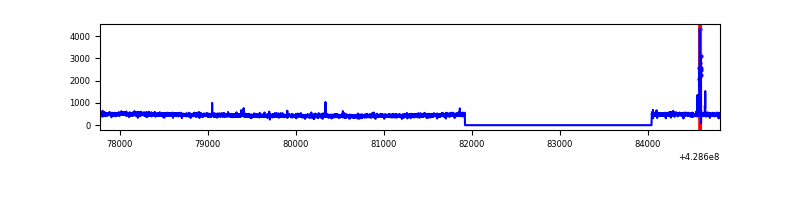 |
| C | 7046 | 4925 | 4 | 4 | 0.06% | 0.08% | 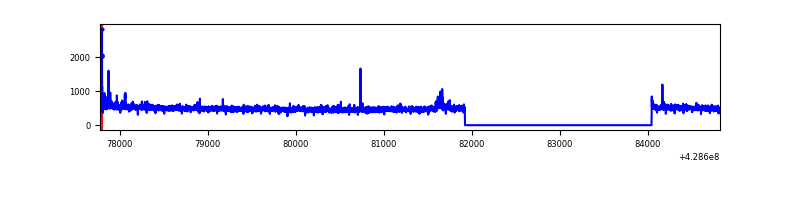 |
| D | 7046 | 4925 | 354 | 354 | 5.02% | 7.19% | 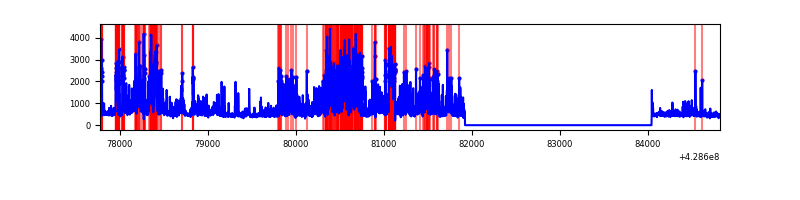 |
Top three noisy pixels from each quadrant. If the there are fewer than three noisy pixels in the level2.evt file, extra rows are filled as -1
| Pixel properties | Quadrant properties | ||||||
|---|---|---|---|---|---|---|---|
| Quadrant | DetID | PixID | Counts | Sigma | Mean | Median | Sigma |
| A | 10 | 83 | 479440 | 4106.25 | 568 | 559 | 116.6 |
| A | 7 | 3 | 31246 | 263.13 | 568 | 559 | 116.6 |
| A | 13 | 6 | 6470 | 50.68 | 568 | 559 | 116.6 |
| B | 3 | 112 | 51607 | 470.62 | 560 | 545 | 108.5 |
| B | 12 | 111 | 13605 | 120.37 | 560 | 545 | 108.5 |
| B | 11 | 111 | 12636 | 111.44 | 560 | 545 | 108.5 |
| C | 15 | 214 | 209038 | 1616.81 | 552 | 555 | 128.9 |
| C | 8 | 79 | 21215 | 160.22 | 552 | 555 | 128.9 |
| C | 14 | 254 | 19014 | 143.15 | 552 | 555 | 128.9 |
| D | 12 | 33 | 1698381 | 13024.34 | 536 | 522 | 130.4 |
| D | 1 | 52 | 276666 | 2118.31 | 536 | 522 | 130.4 |
| D | 13 | 249 | 195846 | 1498.33 | 536 | 522 | 130.4 |
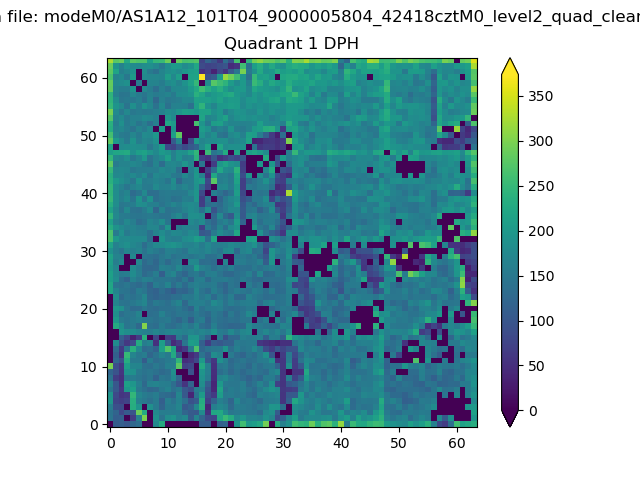
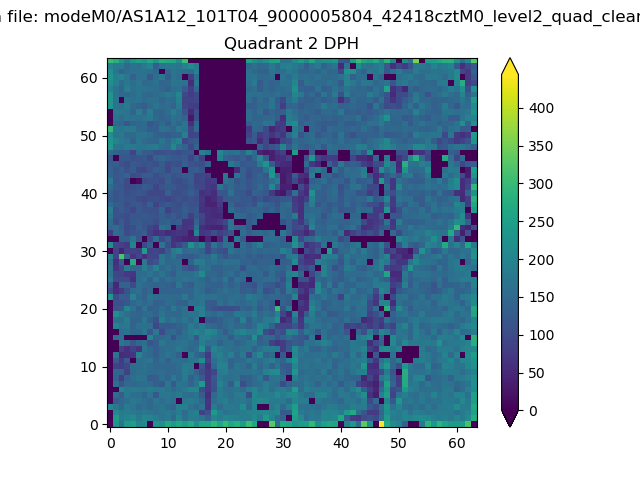
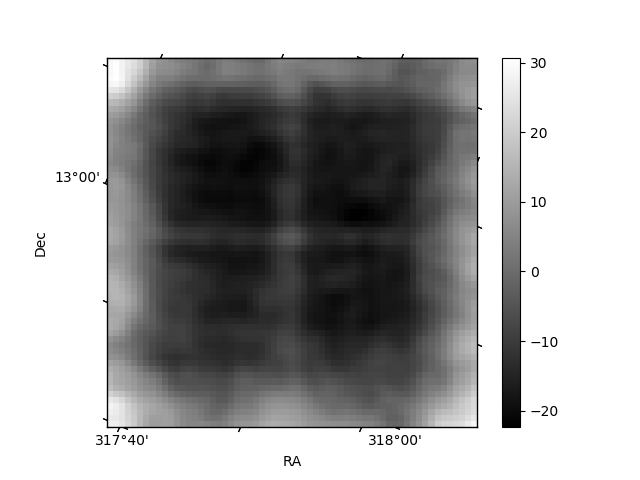
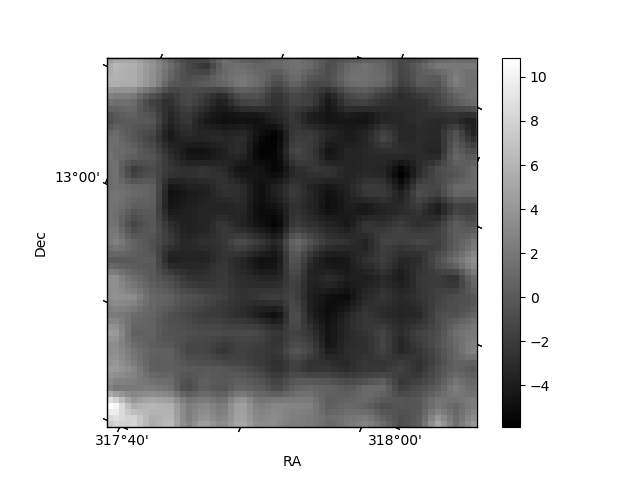
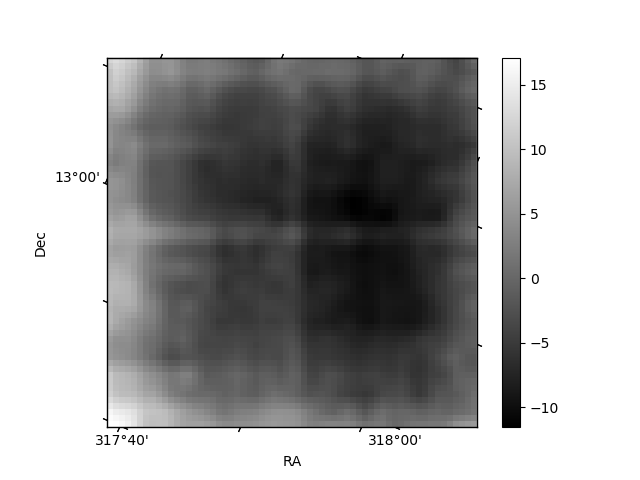
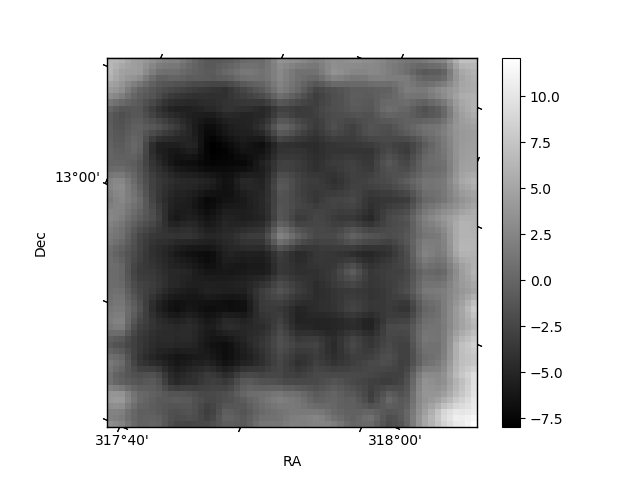
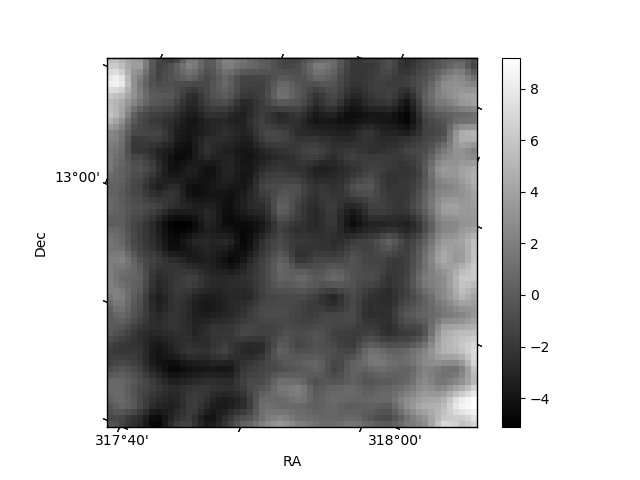
Histogram calculated using DETX and DETY for each event in the final _common_clean file
| Quadrant A |  |
 |
Quadrant B |
|---|---|---|---|
| Quadrant D | 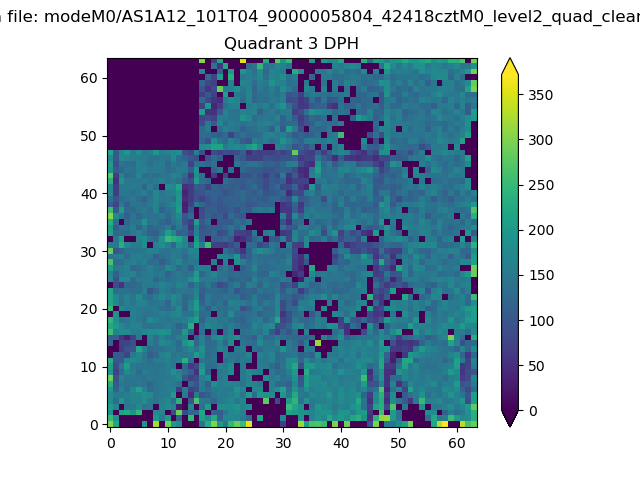 |
 |
Quadrant C |
| Plot type | Count rate plots | Images |
|---|---|---|
| Comparison with Poisson distribution Blue bars denote a histogram of data divided into 1 sec bins. Red curve is a Poisson curve with rate = median count rate of data. |
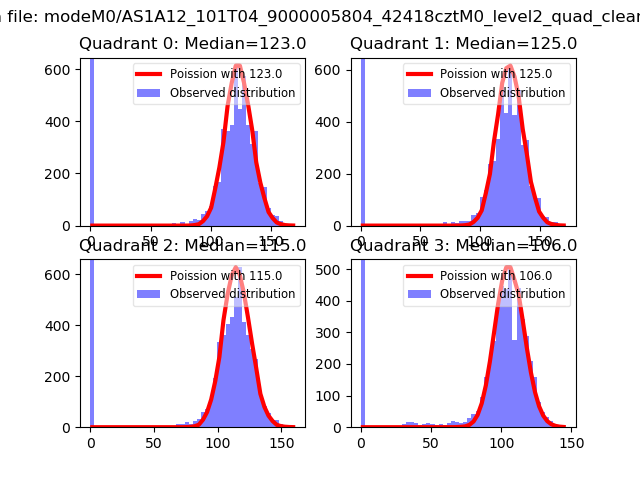 |
 |
| Quadrant-wise count rates Data is divided into 100 sec bins |
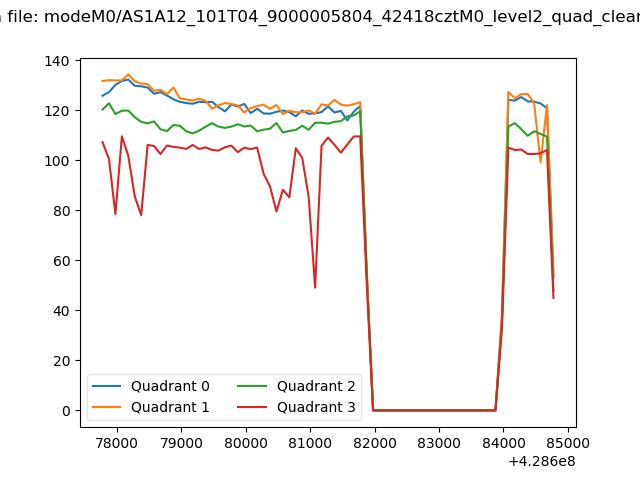 |
|
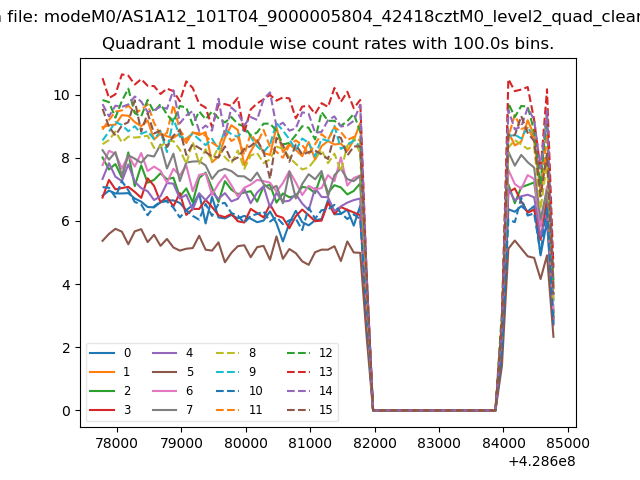
| Module-wise count rates for Quadrant A Data is divided into 100 sec bins |
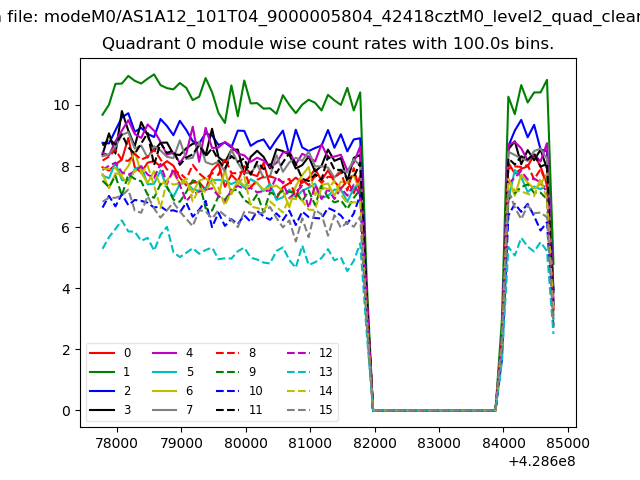 |
 |
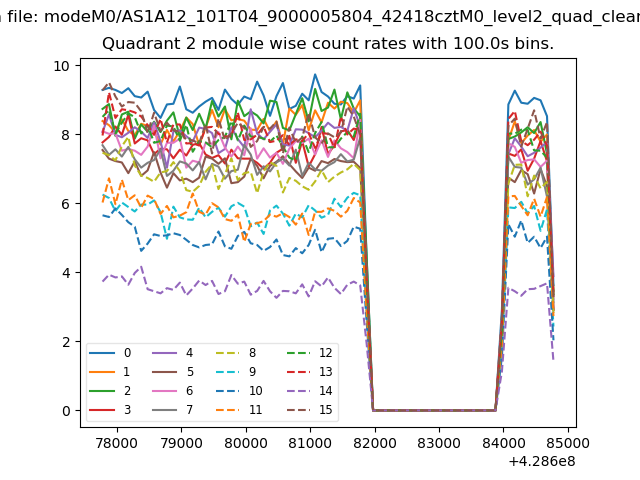
| Module-wise count rates for Quadrant B Data is divided into 100 sec bins |
 |
 |
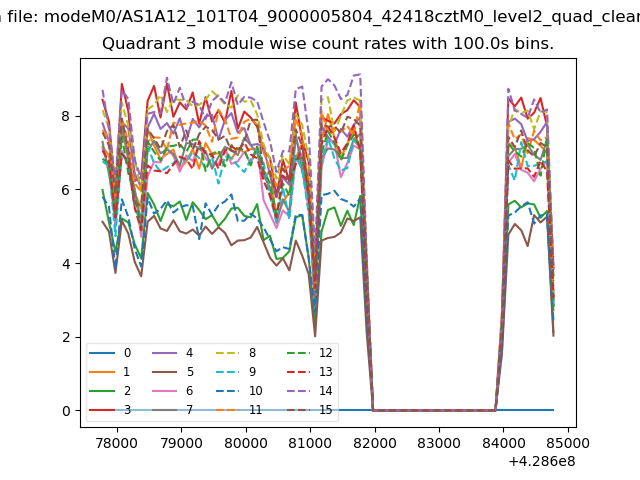
| Module-wise count rates for Quadrant C Data is divided into 100 sec bins |
 |
 |
| Module-wise count rates for Quadrant D Data is divided into 100 sec bins |
 |
 |
| Parameter | Plot |
|---|---|
| CZT HV Monitor | 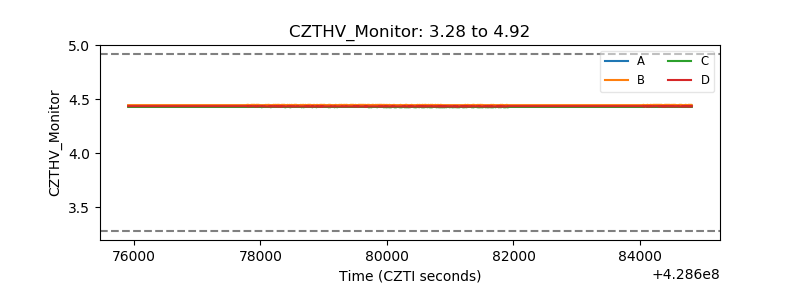 |
| D_VDD | 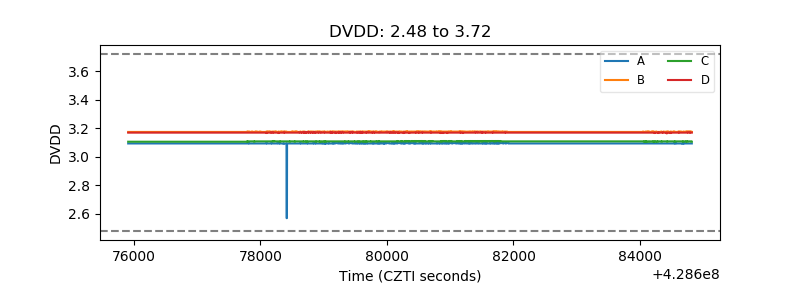 |
| Temperature 1 | 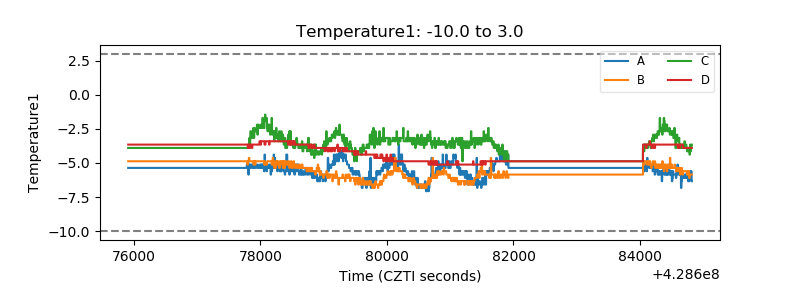 |
| Veto HV Monitor |  |
| Veto LLD | 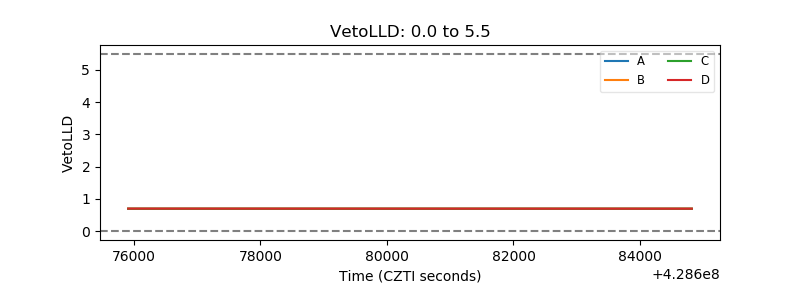 |
| Alpha Counter | 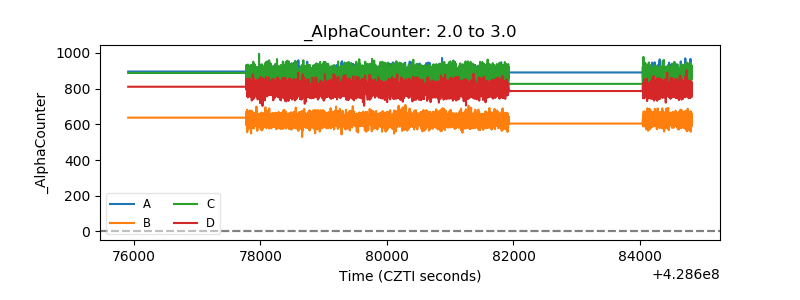 |
| _CPM_Rate | 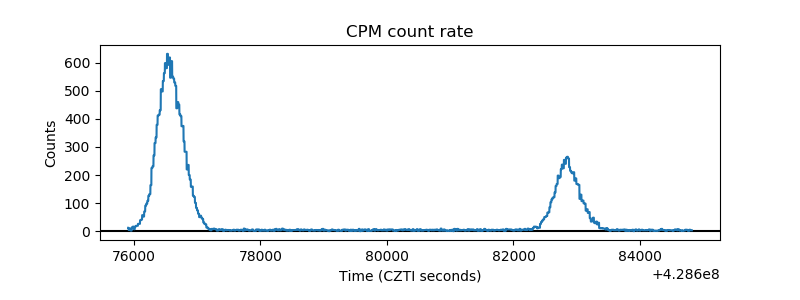 |
| CZT Counter | 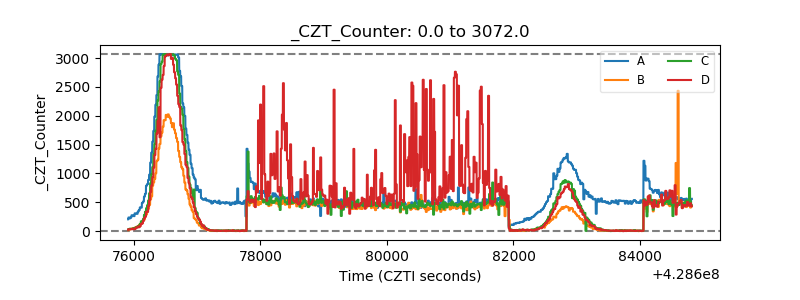 |
| +2.5 Volts monitor | 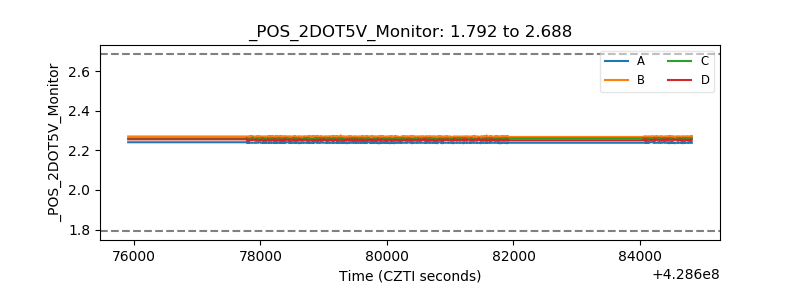 |
| +5 Volts monitor | 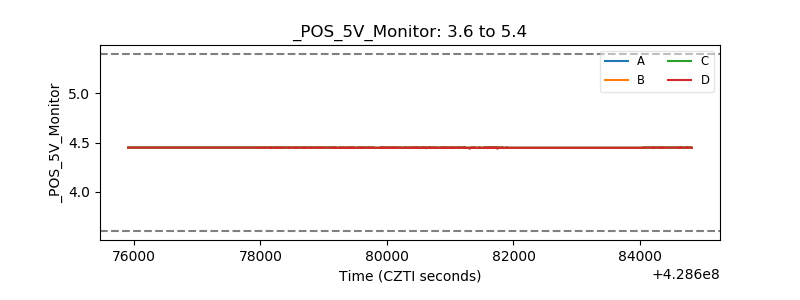 |
| _ROLL_ROT | 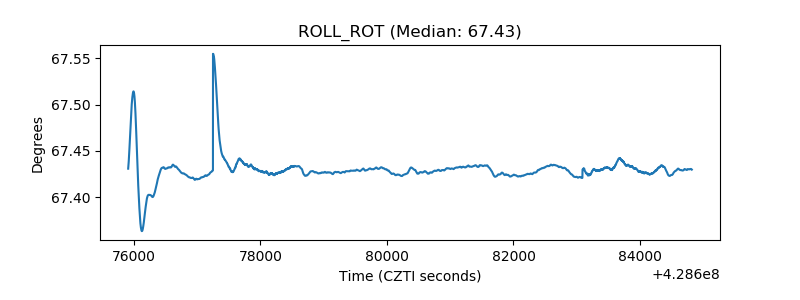 |
| _Roll_DEC | 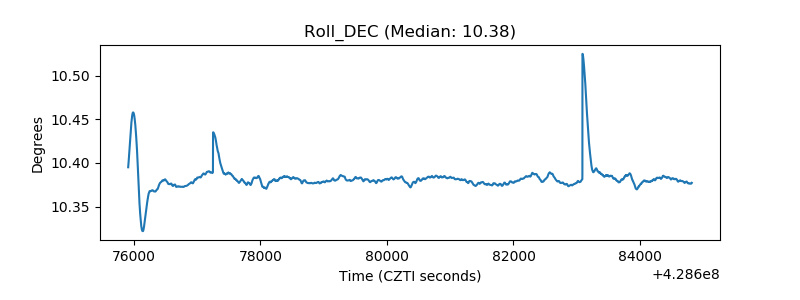 |
| _Roll_RA | 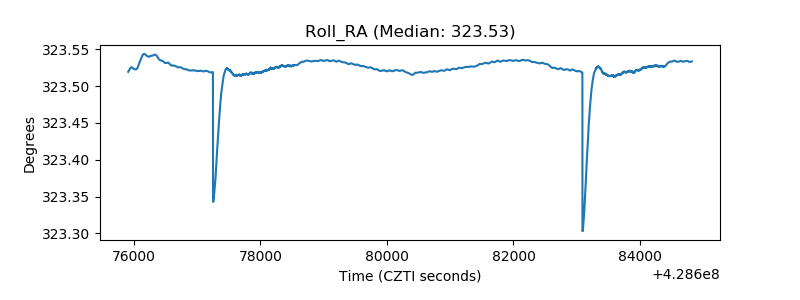 |
| Veto Counter | 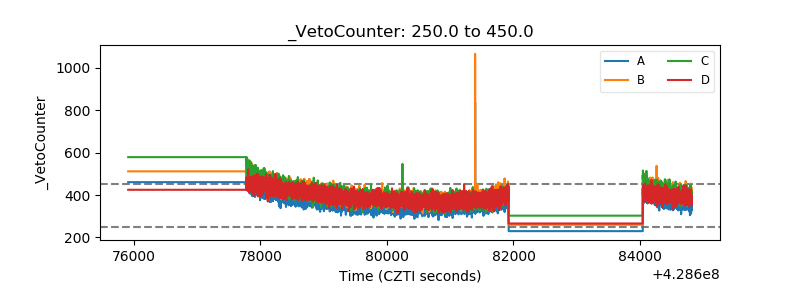 |