| Param | Original file | Final file |
|---|---|---|
| Filename | modeM0/AS1A12_101T04_9000005804_42421cztM0_level2.fits | modeM0/AS1A12_101T04_9000005804_42421cztM0_level2_quad_clean.evt |
| Size (bytes) | 511,974,720 | 105,318,720 |
| Size | 488.3 MB | 100.4 MB |
| Events in quadrant A | 3,449,762 | 736,849 |
| Events in quadrant B | 2,958,227 | 748,491 |
| Events in quadrant C | 3,099,500 | 711,620 |
| Events in quadrant D | 8,928,560 | 529,201 |
| Mode M0 | |||
|---|---|---|---|
| Quadrant | BADHDUFLAG | Total packets | Discarded packets |
| A | 0 | 14232 | 2 |
| B | 0 | 13541 | 2 |
| C | 0 | 13422 | 2 |
| D | 0 | 31217 | 2 |
| Mode M9 | |||
|---|---|---|---|
| Quadrant | BADHDUFLAG | Total packets | Discarded packets |
| A | 0 | 30 | 0 |
| B | 0 | 30 | 0 |
| C | 0 | 30 | 0 |
| D | 0 | 30 | 0 |
| Mode SS | |||
|---|---|---|---|
| Quadrant | BADHDUFLAG | Total packets | Discarded packets |
| A | 0 | 136 | 0 |
| B | 0 | 136 | 0 |
| C | 0 | 136 | 0 |
| D | 0 | 136 | 0 |
| Quadrant | Total seconds | Saturated seconds | Saturation percentage |
|---|---|---|---|
| A | 6638 | 15 | 0.225972% |
| B | 6638 | 24 | 0.361555% |
| C | 6638 | 4 | 0.060259% |
| D | 6638 | 1505 | 22.672492% |
Noise dominated data is calculated using 1-second bins in cleaned event files. If a bin has >2000 counts, and if more than 50% of those come from <1% of pixels, then it is considered to be noise-dominated and hence unusable.
| Quadrant | # 1 sec bins | Bins with >0 counts | Bins with >2000 counts | High rate bins dominated by noise | Noise dominated (total time) | Noise dominated (detector-on time) | Marked lightcurve |
|---|---|---|---|---|---|---|---|
| A | 9562 | 6640 | 3 | 3 | 0.03% | 0.05% | 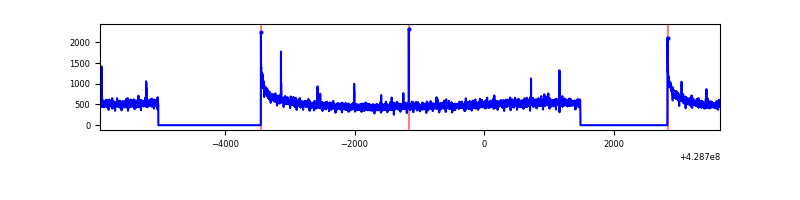 |
| B | 9562 | 6640 | 14 | 14 | 0.15% | 0.21% | 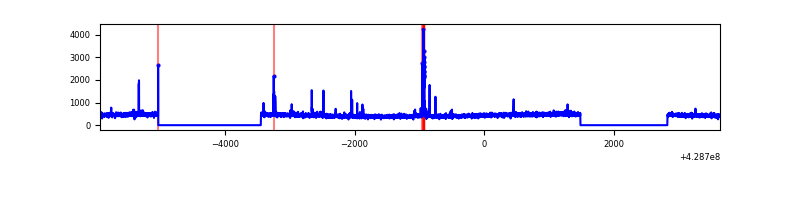 |
| C | 9562 | 6640 | 0 | 0 | 0.00% | 0.00% | 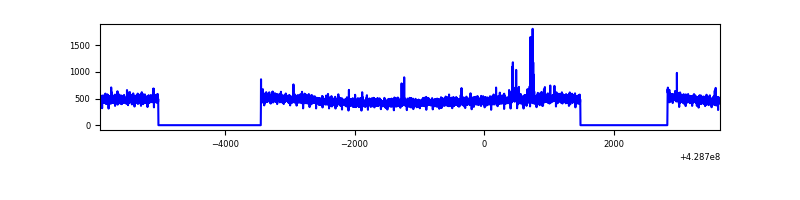 |
| D | 9562 | 6640 | 1377 | 1377 | 14.40% | 20.74% | 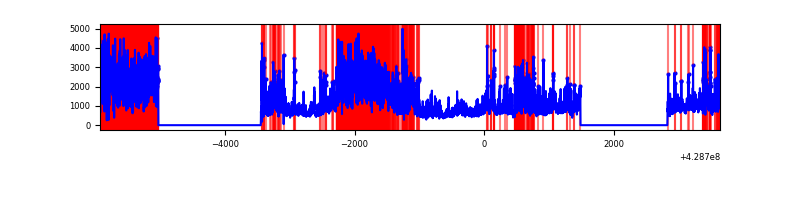 |
Top three noisy pixels from each quadrant. If the there are fewer than three noisy pixels in the level2.evt file, extra rows are filled as -1
| Pixel properties | Quadrant properties | ||||||
|---|---|---|---|---|---|---|---|
| Quadrant | DetID | PixID | Counts | Sigma | Mean | Median | Sigma |
| A | 10 | 83 | 586114 | 3896.61 | 733 | 718 | 150.2 |
| A | 14 | 223 | 21512 | 138.41 | 733 | 718 | 150.2 |
| A | 13 | 254 | 9116 | 55.9 | 733 | 718 | 150.2 |
| B | 5 | 172 | 78212 | 543.91 | 722 | 702 | 142.5 |
| B | 3 | 112 | 30177 | 206.84 | 722 | 702 | 142.5 |
| B | 12 | 111 | 18298 | 123.48 | 722 | 702 | 142.5 |
| C | 15 | 214 | 277391 | 1656.74 | 712 | 717 | 167.0 |
| C | 3 | 110 | 26943 | 157.04 | 712 | 717 | 167.0 |
| C | 10 | 34 | 8968 | 49.41 | 712 | 717 | 167.0 |
| D | 12 | 33 | 4527231 | 28488.69 | 647 | 629 | 158.9 |
| D | 1 | 52 | 1143242 | 7191.17 | 647 | 629 | 158.9 |
| D | 12 | 6 | 568549 | 3574.27 | 647 | 629 | 158.9 |
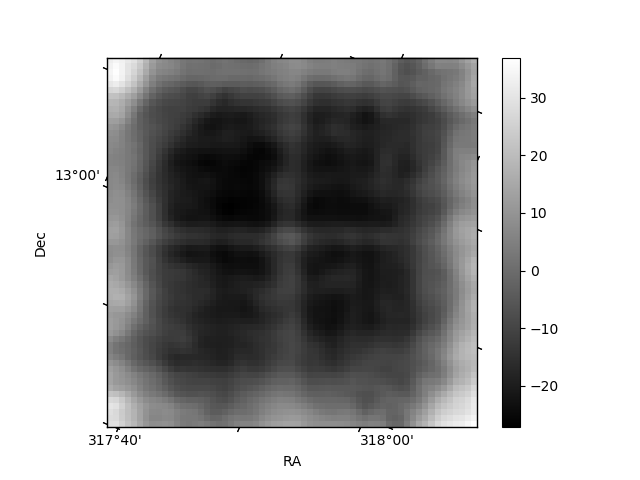
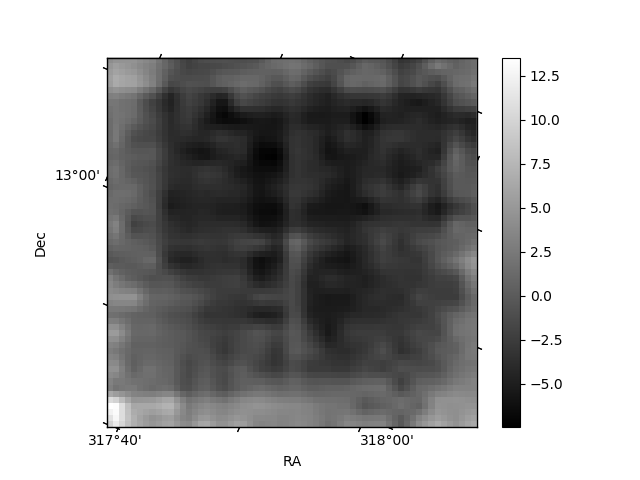
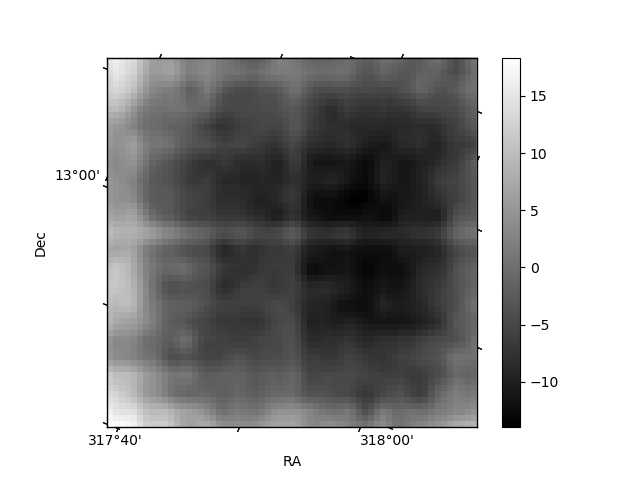
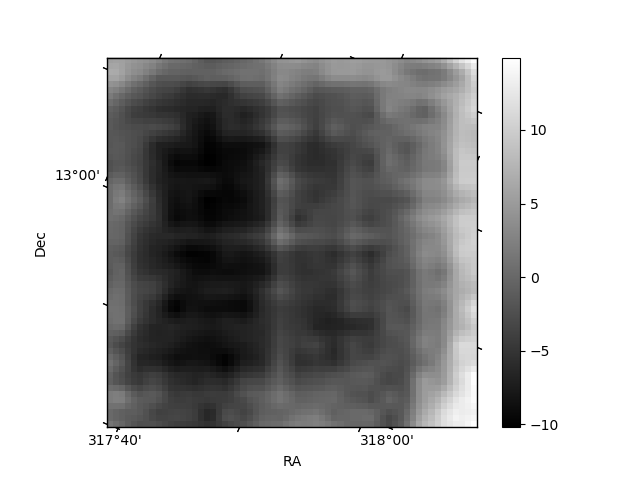
Histogram calculated using DETX and DETY for each event in the final _common_clean file
| Quadrant A | 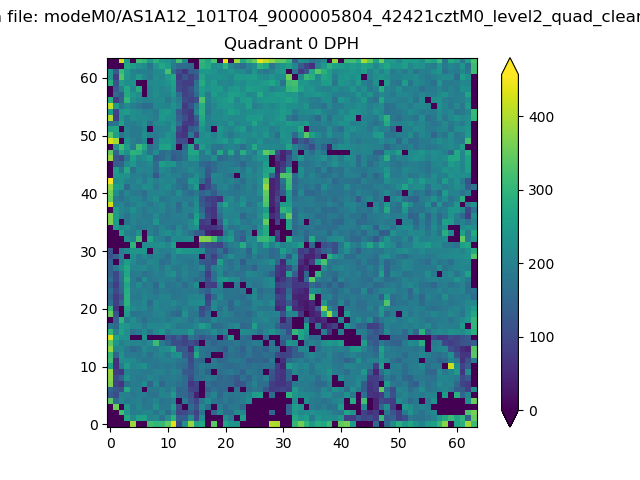 |
 |
Quadrant B |
|---|---|---|---|
| Quadrant D | 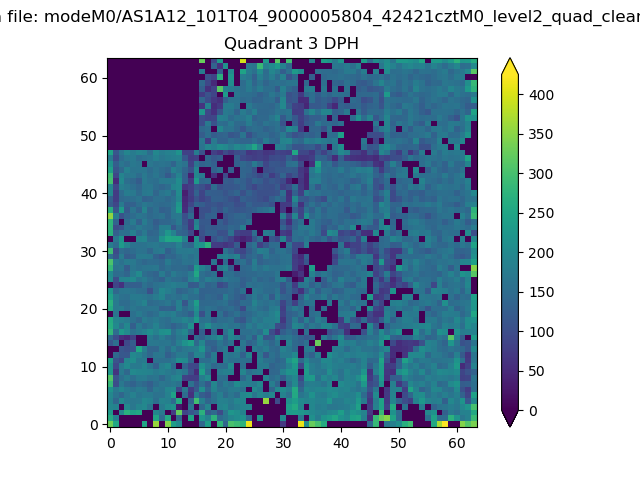 |
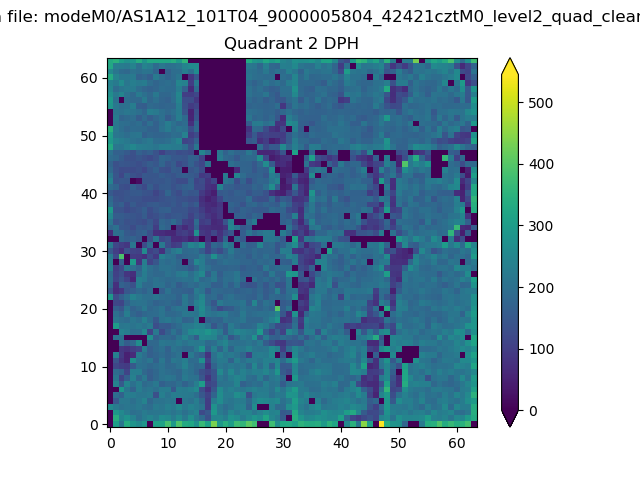 |
Quadrant C |
| Plot type | Count rate plots | Images |
|---|---|---|
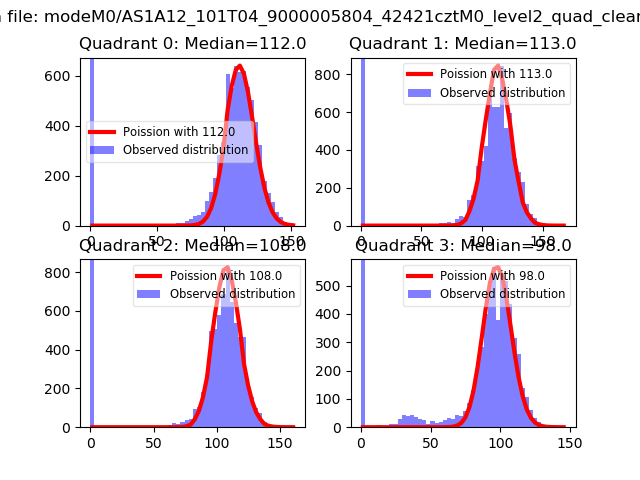
| Comparison with Poisson distribution Blue bars denote a histogram of data divided into 1 sec bins. Red curve is a Poisson curve with rate = median count rate of data. |
 |
 |
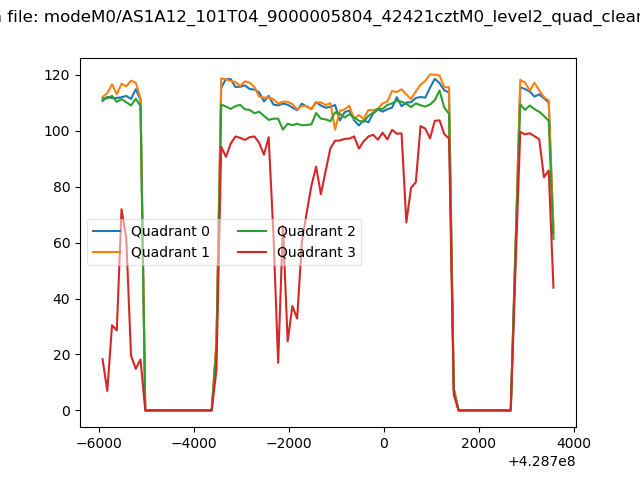
| Quadrant-wise count rates Data is divided into 100 sec bins |
 |
|
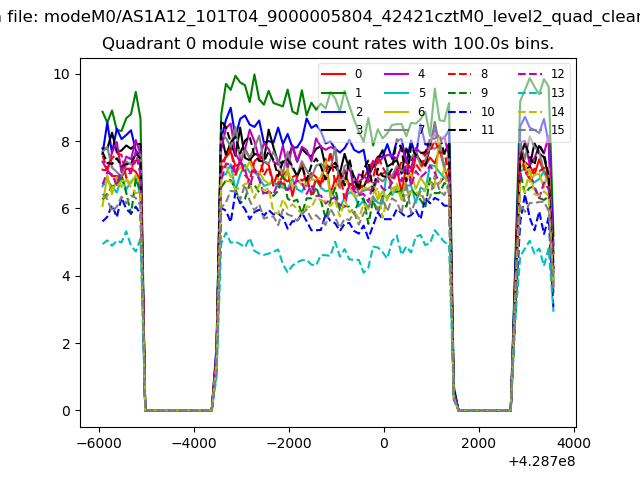
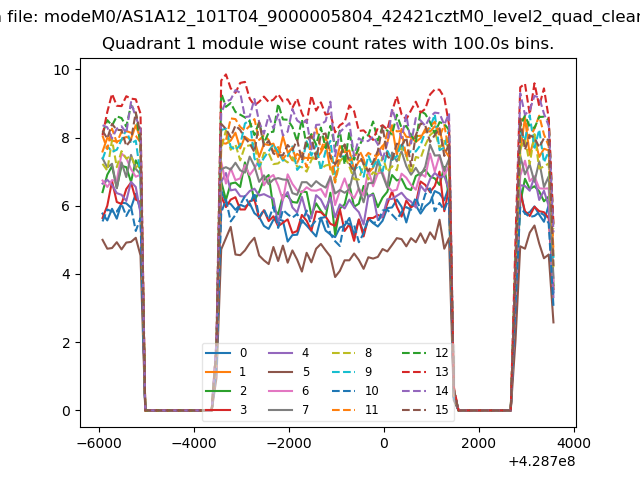
| Module-wise count rates for Quadrant A Data is divided into 100 sec bins |
 |
 |
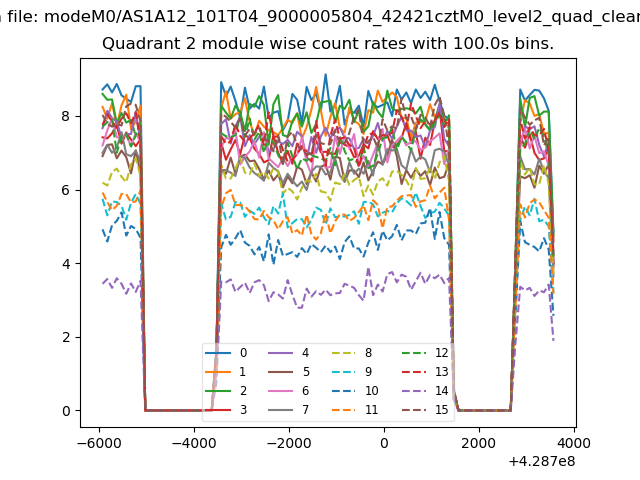
| Module-wise count rates for Quadrant B Data is divided into 100 sec bins |
 |
 |
| Module-wise count rates for Quadrant C Data is divided into 100 sec bins |
 |
 |
| Module-wise count rates for Quadrant D Data is divided into 100 sec bins |
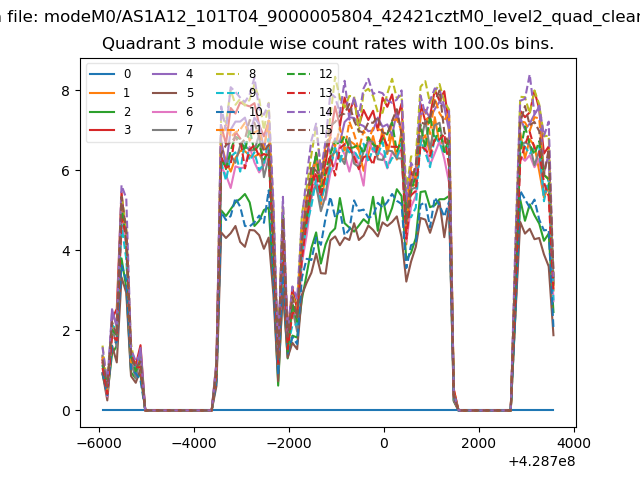 |
 |
| Parameter | Plot |
|---|---|
| CZT HV Monitor | 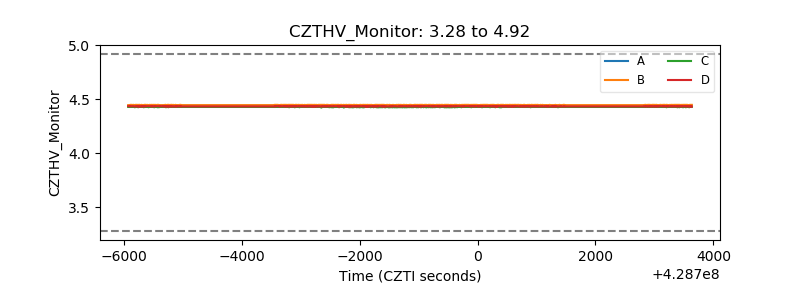 |
| D_VDD | 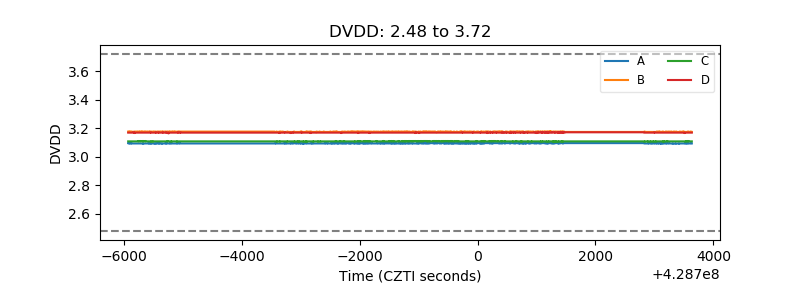 |
| Temperature 1 | 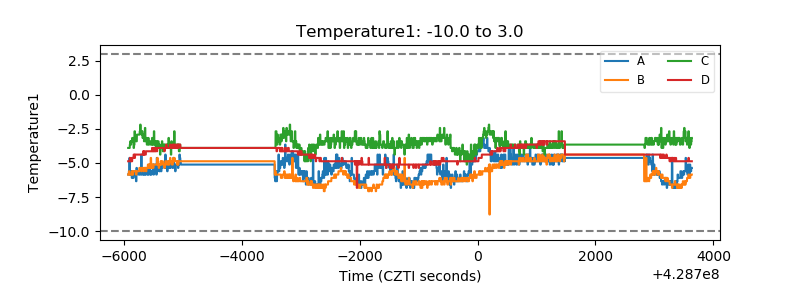 |
| Veto HV Monitor | 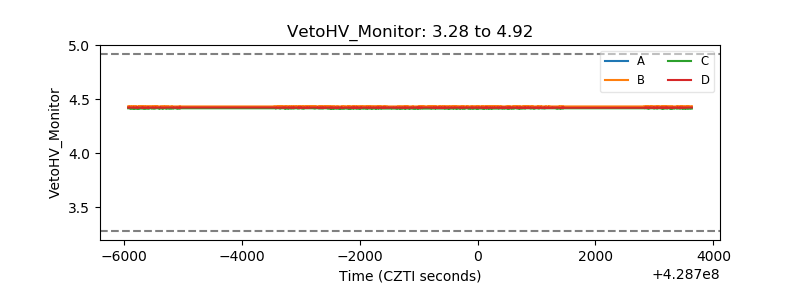 |
| Veto LLD | 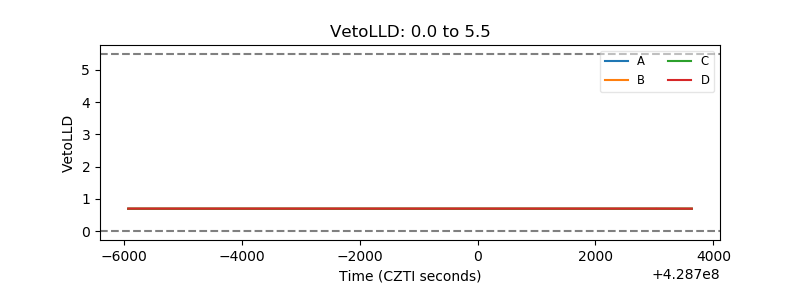 |
| Alpha Counter | 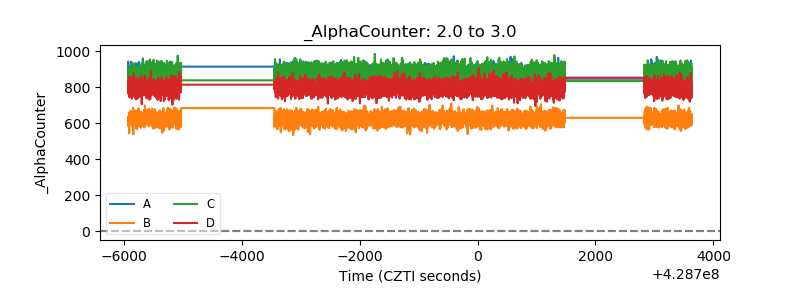 |
| _CPM_Rate | 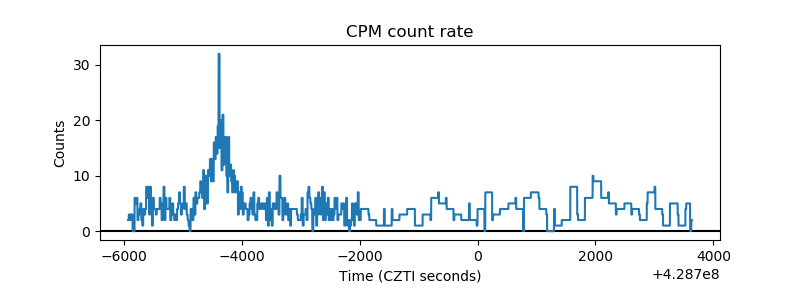 |
| CZT Counter | 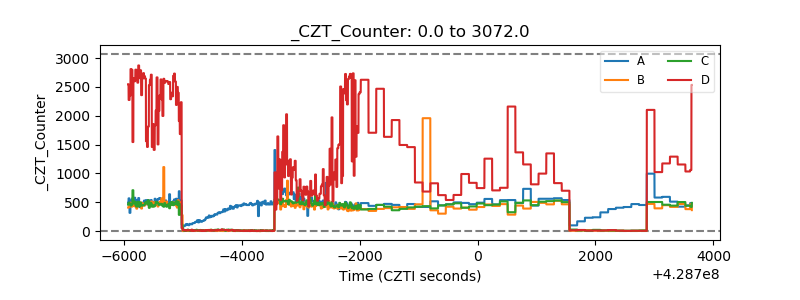 |
| +2.5 Volts monitor | 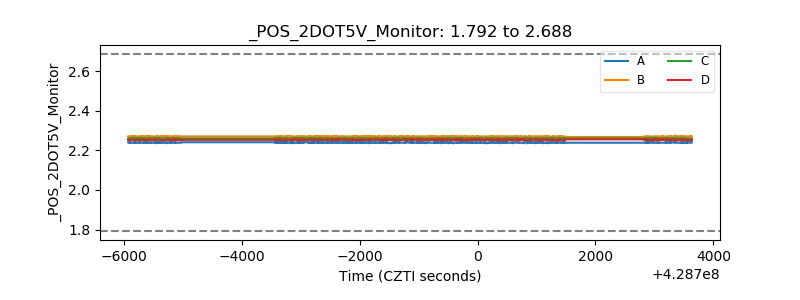 |
| +5 Volts monitor | 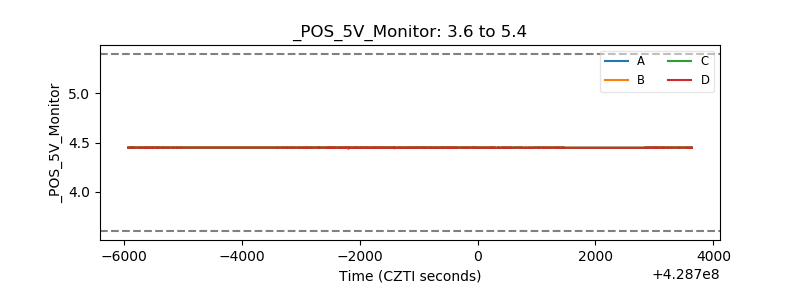 |
| _ROLL_ROT | 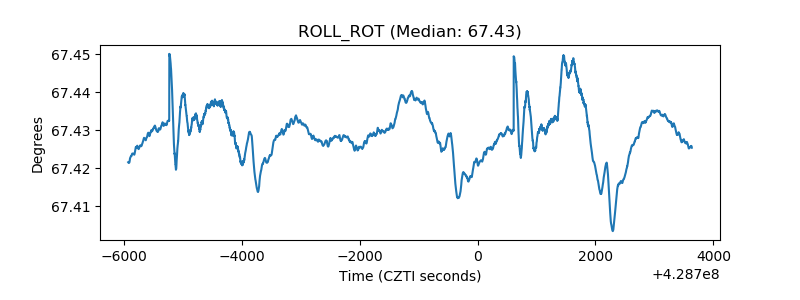 |
| _Roll_DEC | 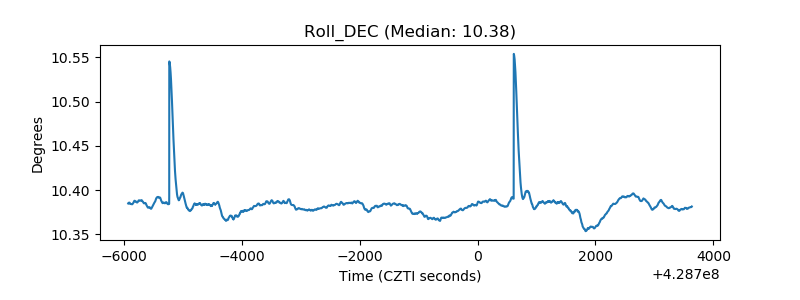 |
| _Roll_RA | 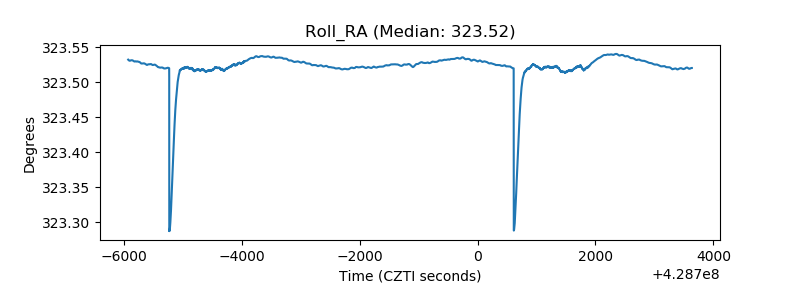 |
| Veto Counter | 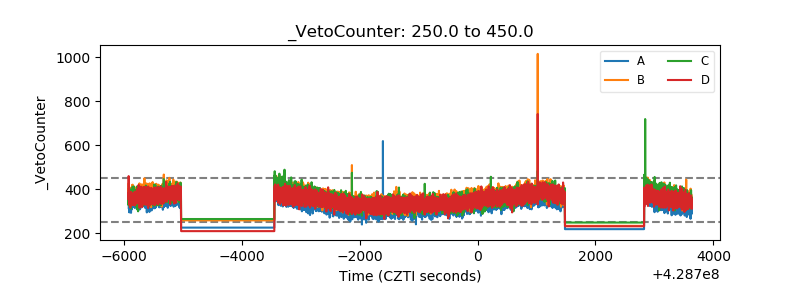 |