| Param | Original file | Final file |
|---|---|---|
| Filename | modeM0/AS1A12_101T04_9000005804_42422cztM0_level2.fits | modeM0/AS1A12_101T04_9000005804_42422cztM0_level2_quad_clean.evt |
| Size (bytes) | 486,552,960 | 97,214,400 |
| Size | 464.0 MB | 92.7 MB |
| Events in quadrant A | 3,177,149 | 678,892 |
| Events in quadrant B | 2,694,382 | 693,092 |
| Events in quadrant C | 2,845,970 | 652,733 |
| Events in quadrant D | 8,813,591 | 488,197 |
| Mode M0 | |||
|---|---|---|---|
| Quadrant | BADHDUFLAG | Total packets | Discarded packets |
| A | 0 | 13192 | 2 |
| B | 0 | 12521 | 2 |
| C | 0 | 12479 | 2 |
| D | 0 | 30469 | 2 |
| Mode M9 | |||
|---|---|---|---|
| Quadrant | BADHDUFLAG | Total packets | Discarded packets |
| A | 0 | 26 | 0 |
| B | 0 | 26 | 0 |
| C | 0 | 26 | 0 |
| D | 0 | 26 | 0 |
| Mode SS | |||
|---|---|---|---|
| Quadrant | BADHDUFLAG | Total packets | Discarded packets |
| A | 0 | 126 | 0 |
| B | 0 | 126 | 0 |
| C | 0 | 126 | 0 |
| D | 0 | 126 | 0 |
| Quadrant | Total seconds | Saturated seconds | Saturation percentage |
|---|---|---|---|
| A | 6173 | 13 | 0.210595% |
| B | 6174 | 18 | 0.291545% |
| C | 6174 | 6 | 0.097182% |
| D | 6174 | 1467 | 23.760933% |
Noise dominated data is calculated using 1-second bins in cleaned event files. If a bin has >2000 counts, and if more than 50% of those come from <1% of pixels, then it is considered to be noise-dominated and hence unusable.
| Quadrant | # 1 sec bins | Bins with >0 counts | Bins with >2000 counts | High rate bins dominated by noise | Noise dominated (total time) | Noise dominated (detector-on time) | Marked lightcurve |
|---|---|---|---|---|---|---|---|
| A | 8796 | 6175 | 2 | 2 | 0.02% | 0.03% | 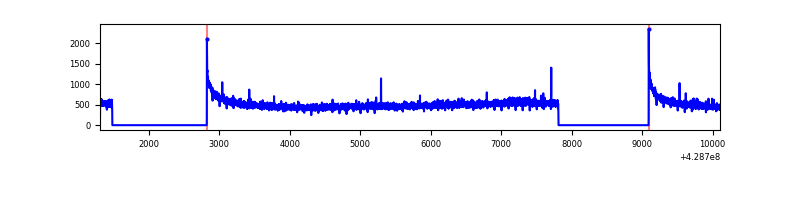 |
| B | 8797 | 6176 | 3 | 3 | 0.03% | 0.05% | 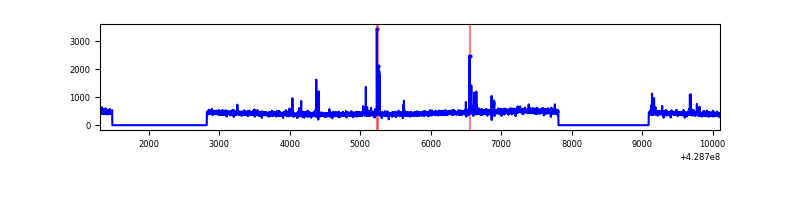 |
| C | 8797 | 6176 | 0 | 0 | 0.00% | 0.00% | 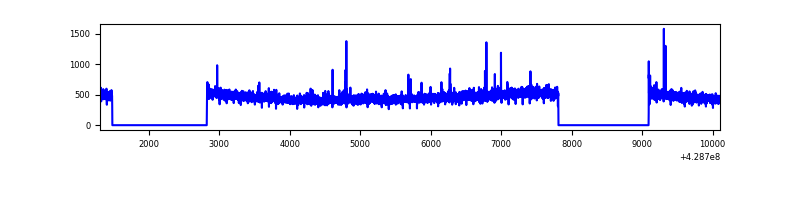 |
| D | 8797 | 6176 | 1456 | 1456 | 16.55% | 23.58% | 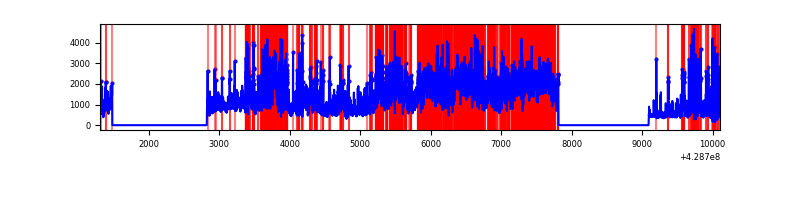 |
Top three noisy pixels from each quadrant. If the there are fewer than three noisy pixels in the level2.evt file, extra rows are filled as -1
| Pixel properties | Quadrant properties | ||||||
|---|---|---|---|---|---|---|---|
| Quadrant | DetID | PixID | Counts | Sigma | Mean | Median | Sigma |
| A | 10 | 83 | 558823 | 4026.84 | 671 | 660 | 138.6 |
| A | 13 | 6 | 14940 | 103.02 | 671 | 660 | 138.6 |
| A | 13 | 254 | 8828 | 58.93 | 671 | 660 | 138.6 |
| B | 3 | 112 | 30829 | 231.53 | 665 | 647 | 130.4 |
| B | 5 | 172 | 25256 | 188.78 | 665 | 647 | 130.4 |
| B | 12 | 111 | 16972 | 125.23 | 665 | 647 | 130.4 |
| C | 15 | 214 | 260587 | 1689.97 | 654 | 657 | 153.8 |
| C | 10 | 34 | 16368 | 102.15 | 654 | 657 | 153.8 |
| C | 12 | 249 | 8909 | 53.65 | 654 | 657 | 153.8 |
| D | 12 | 33 | 5191831 | 35176.05 | 604 | 588 | 147.6 |
| D | 12 | 6 | 849428 | 5751.77 | 604 | 588 | 147.6 |
| D | 1 | 52 | 234119 | 1582.41 | 604 | 588 | 147.6 |
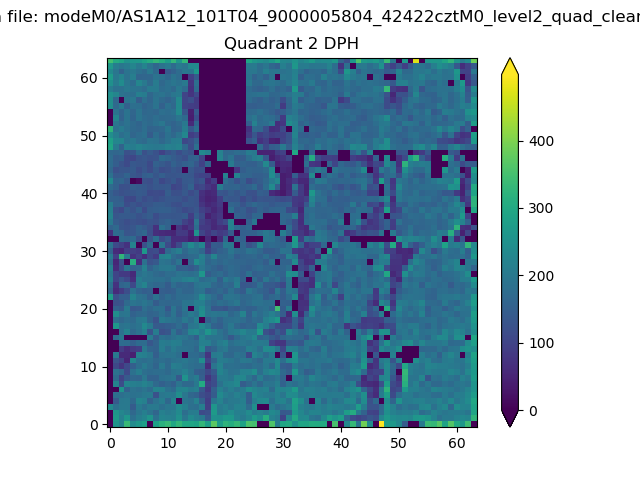
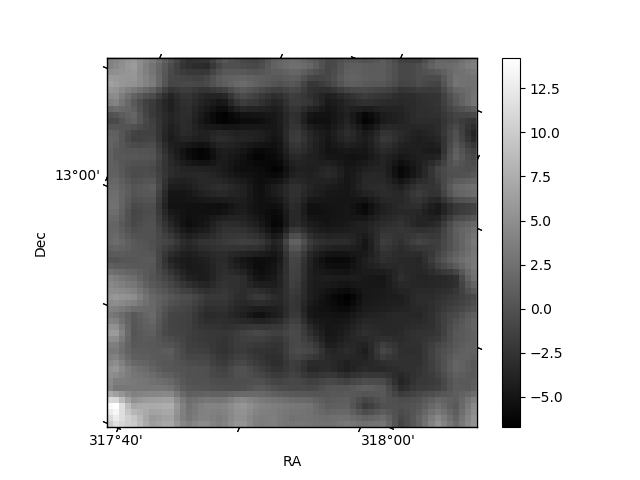
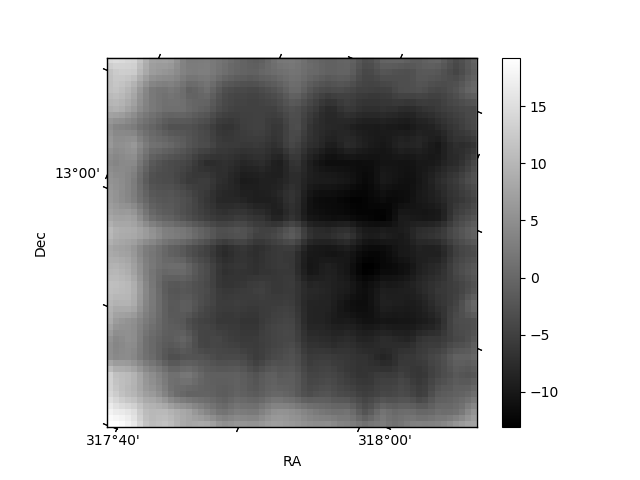
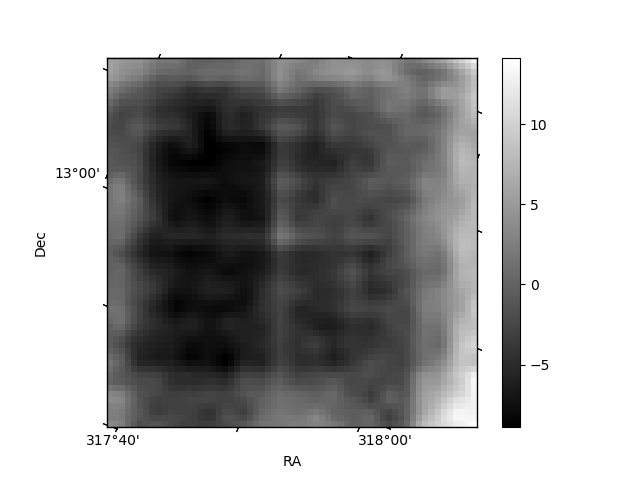
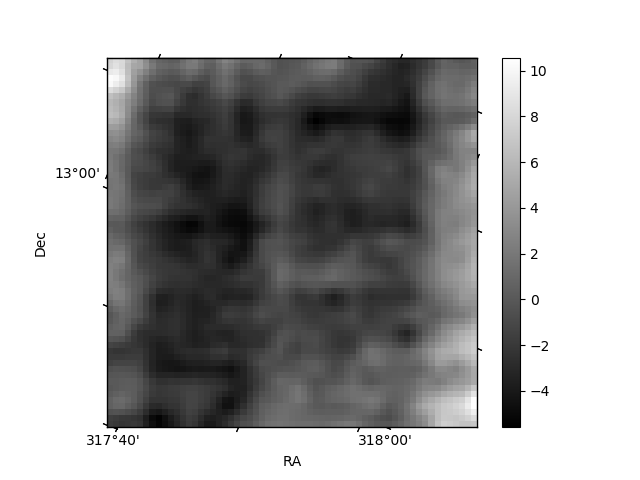
Histogram calculated using DETX and DETY for each event in the final _common_clean file
| Quadrant A | 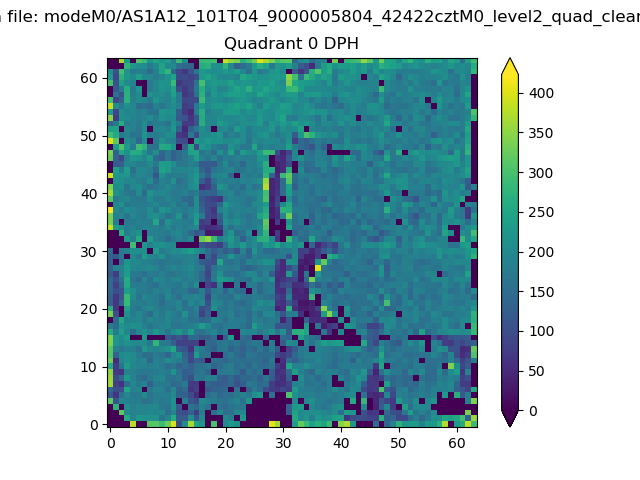 |
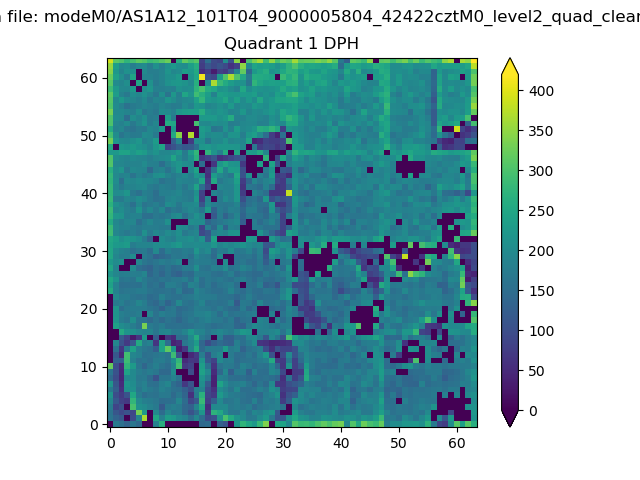 |
Quadrant B |
|---|---|---|---|
| Quadrant D | 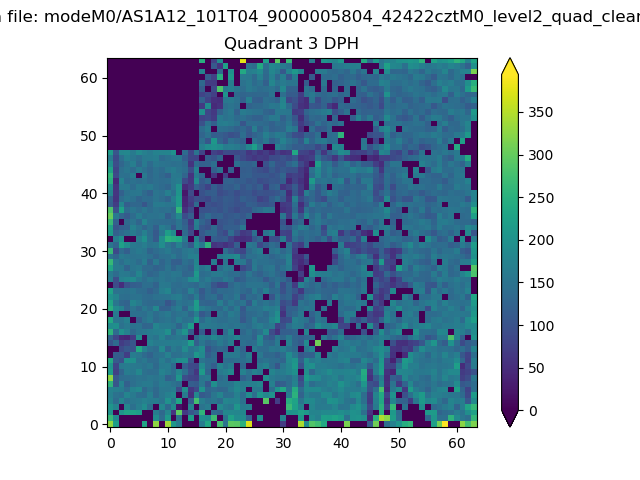 |
 |
Quadrant C |
| Plot type | Count rate plots | Images |
|---|---|---|
| Comparison with Poisson distribution Blue bars denote a histogram of data divided into 1 sec bins. Red curve is a Poisson curve with rate = median count rate of data. |
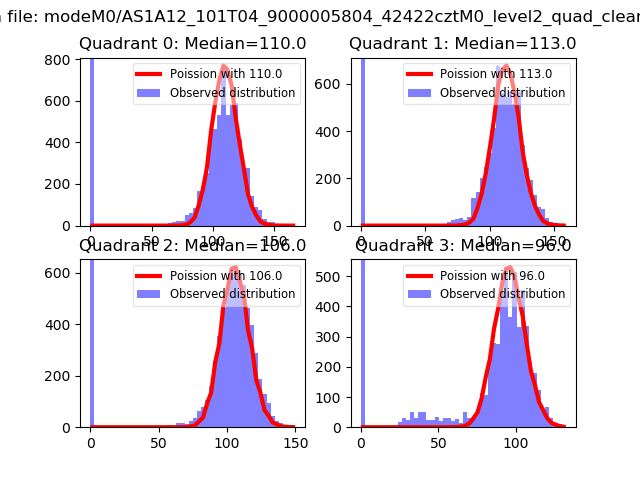 |
 |
| Quadrant-wise count rates Data is divided into 100 sec bins |
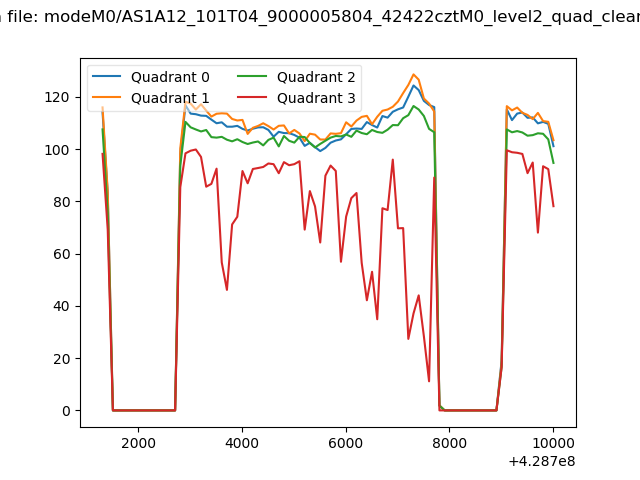 |
|
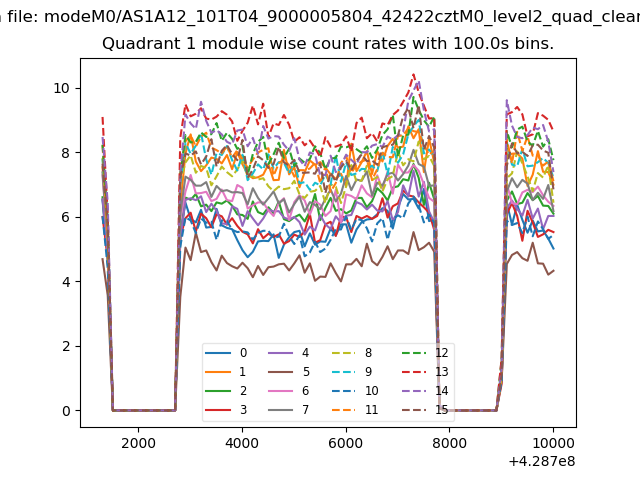
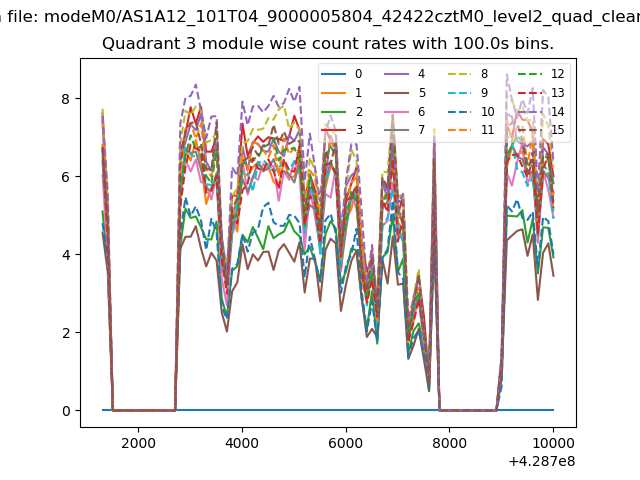
| Module-wise count rates for Quadrant A Data is divided into 100 sec bins |
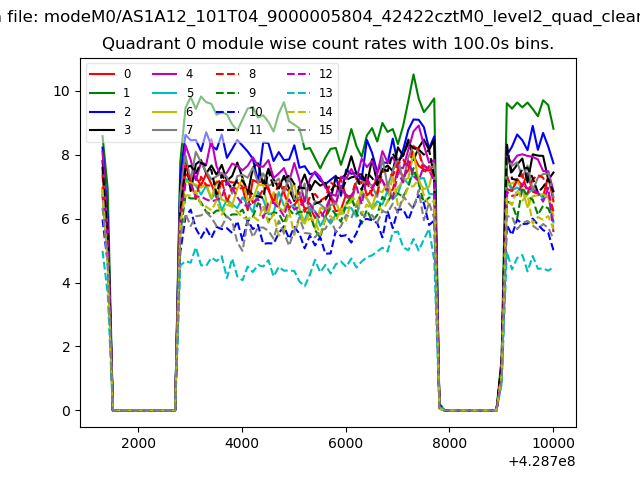 |
 |
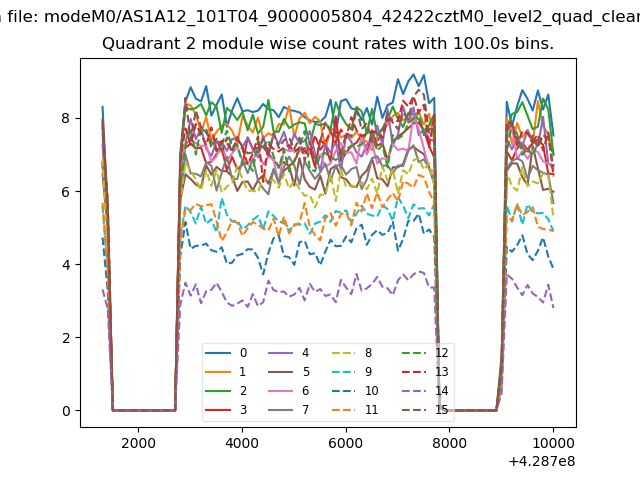
| Module-wise count rates for Quadrant B Data is divided into 100 sec bins |
 |
 |
| Module-wise count rates for Quadrant C Data is divided into 100 sec bins |
 |
 |
| Module-wise count rates for Quadrant D Data is divided into 100 sec bins |
 |
 |
| Parameter | Plot |
|---|---|
| CZT HV Monitor | 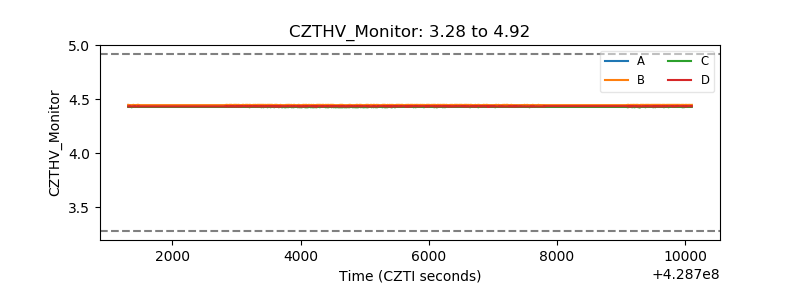 |
| D_VDD | 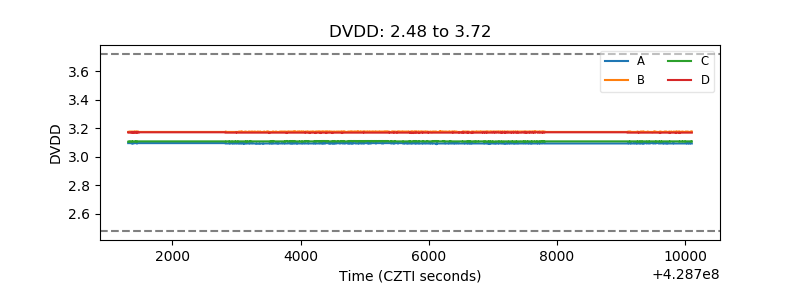 |
| Temperature 1 | 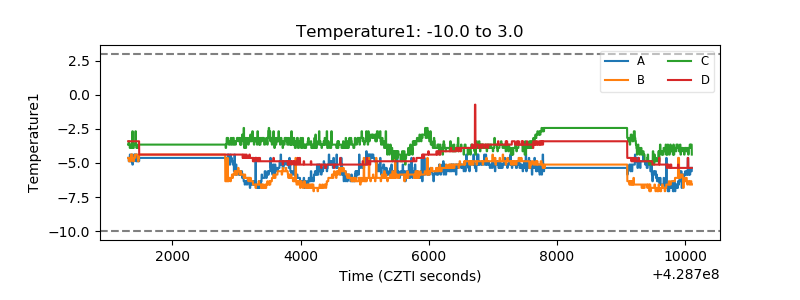 |
| Veto HV Monitor | 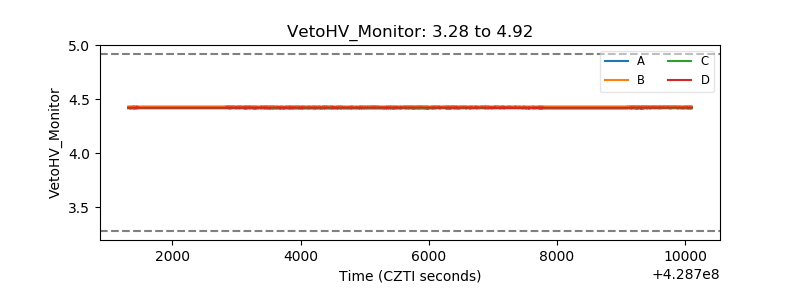 |
| Veto LLD | 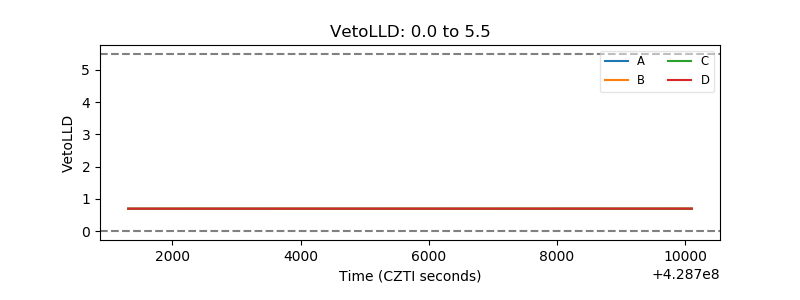 |
| Alpha Counter | 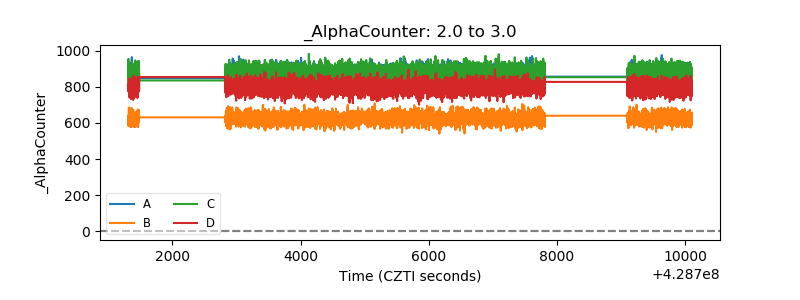 |
| _CPM_Rate | 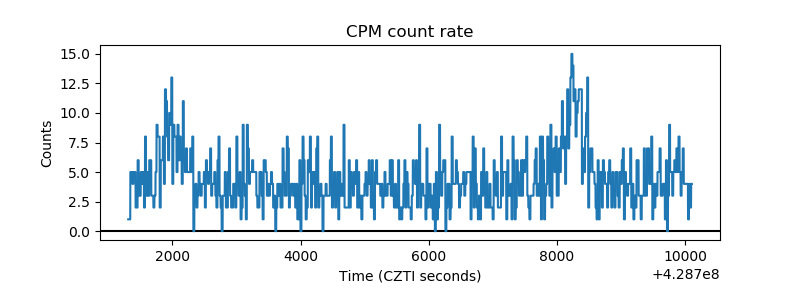 |
| CZT Counter |  |
| +2.5 Volts monitor | 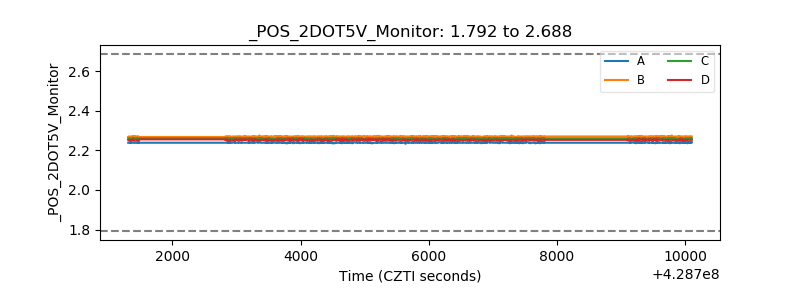 |
| +5 Volts monitor |  |
| _ROLL_ROT | 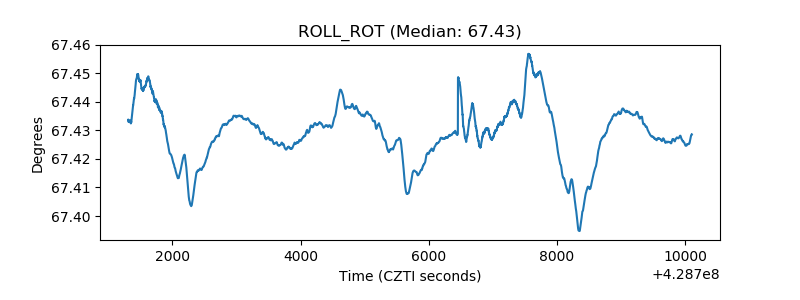 |
| _Roll_DEC | 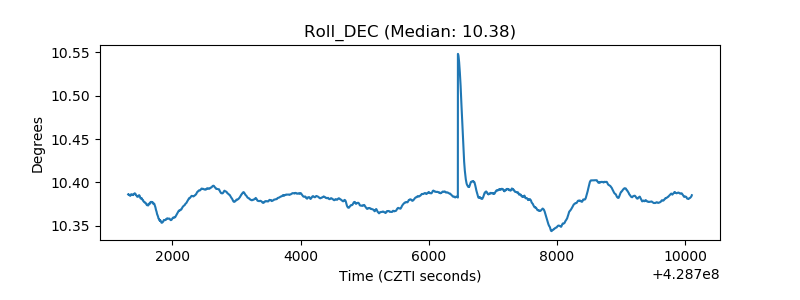 |
| _Roll_RA | 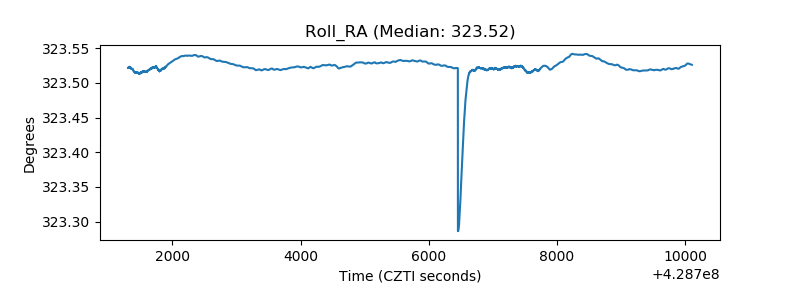 |
| Veto Counter | 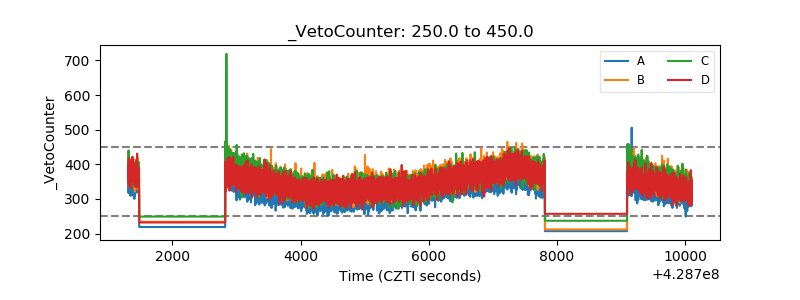 |