| Param | Original file | Final file |
|---|---|---|
| Filename | modeM0/AS1A12_101T04_9000005804_42425cztM0_level2.fits | modeM0/AS1A12_101T04_9000005804_42425cztM0_level2_quad_clean.evt |
| Size (bytes) | 930,208,320 | 246,850,560 |
| Size | 887.1 MB | 235.4 MB |
| Events in quadrant A | 8,058,653 | 1,665,007 |
| Events in quadrant B | 6,878,031 | 1,705,156 |
| Events in quadrant C | 7,436,943 | 1,586,614 |
| Events in quadrant D | 10,858,919 | 1,447,976 |
| Mode M0 | |||
|---|---|---|---|
| Quadrant | BADHDUFLAG | Total packets | Discarded packets |
| A | 0 | 33244 | 4 |
| B | 0 | 31838 | 5 |
| C | 0 | 32325 | 4 |
| D | 0 | 43353 | 4 |
| Mode M9 | |||
|---|---|---|---|
| Quadrant | BADHDUFLAG | Total packets | Discarded packets |
| A | 0 | 52 | 0 |
| B | 0 | 53 | 0 |
| C | 0 | 53 | 0 |
| D | 0 | 53 | 0 |
| Mode SS | |||
|---|---|---|---|
| Quadrant | BADHDUFLAG | Total packets | Discarded packets |
| A | 0 | 316 | 0 |
| B | 0 | 316 | 0 |
| C | 0 | 316 | 0 |
| D | 0 | 316 | 0 |
| Quadrant | Total seconds | Saturated seconds | Saturation percentage |
|---|---|---|---|
| A | 15499 | 31 | 0.200013% |
| B | 15498 | 32 | 0.206478% |
| C | 15498 | 132 | 0.851723% |
| D | 15498 | 549 | 3.542393% |
Noise dominated data is calculated using 1-second bins in cleaned event files. If a bin has >2000 counts, and if more than 50% of those come from <1% of pixels, then it is considered to be noise-dominated and hence unusable.
| Quadrant | # 1 sec bins | Bins with >0 counts | Bins with >2000 counts | High rate bins dominated by noise | Noise dominated (total time) | Noise dominated (detector-on time) | Marked lightcurve |
|---|---|---|---|---|---|---|---|
| A | 19797 | 15502 | 13 | 13 | 0.07% | 0.08% | 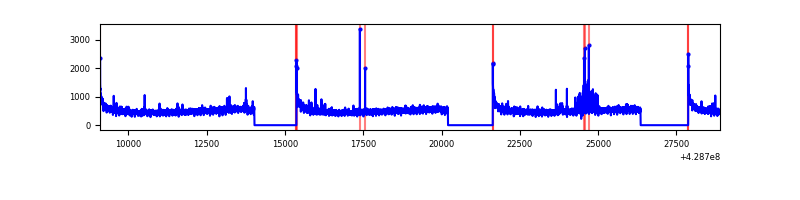 |
| B | 19796 | 15501 | 8 | 8 | 0.04% | 0.05% | 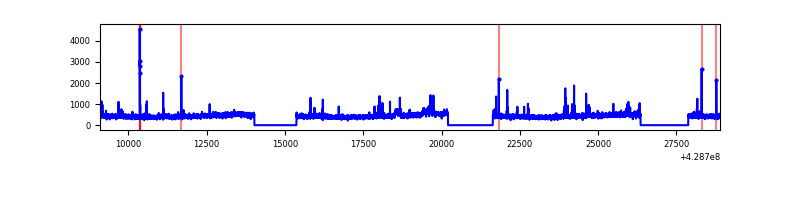 |
| C | 19796 | 15501 | 81 | 81 | 0.41% | 0.52% | 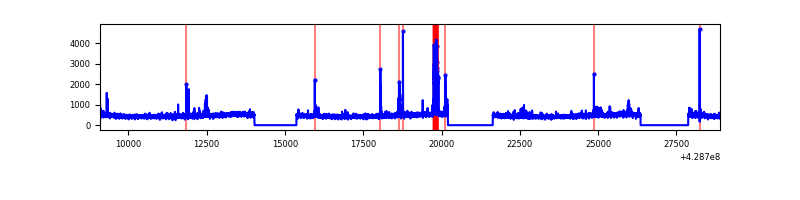 |
| D | 19796 | 15501 | 485 | 485 | 2.45% | 3.13% | 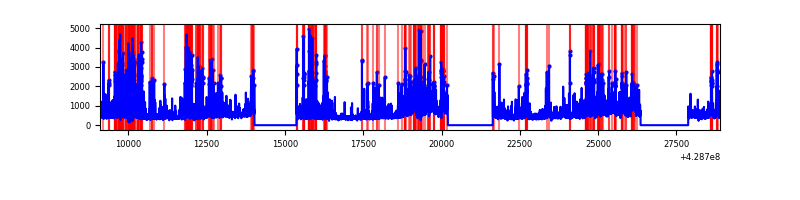 |
Top three noisy pixels from each quadrant. If the there are fewer than three noisy pixels in the level2.evt file, extra rows are filled as -1
| Pixel properties | Quadrant properties | ||||||
|---|---|---|---|---|---|---|---|
| Quadrant | DetID | PixID | Counts | Sigma | Mean | Median | Sigma |
| A | 10 | 83 | 1311134 | 3816.07 | 1695 | 1663 | 343.1 |
| A | 7 | 3 | 123181 | 354.13 | 1695 | 1663 | 343.1 |
| A | 14 | 223 | 27298 | 74.71 | 1695 | 1663 | 343.1 |
| B | 0 | 229 | 110519 | 337.62 | 1674 | 1627 | 322.5 |
| B | 5 | 172 | 101733 | 310.37 | 1674 | 1627 | 322.5 |
| B | 5 | 255 | 55735 | 167.76 | 1674 | 1627 | 322.5 |
| C | 15 | 214 | 637968 | 1674.94 | 1631 | 1643 | 379.9 |
| C | 14 | 254 | 312551 | 818.37 | 1631 | 1643 | 379.9 |
| C | 15 | 111 | 62907 | 161.26 | 1631 | 1643 | 379.9 |
| D | 12 | 33 | 2454255 | 6217.98 | 1618 | 1570 | 394.5 |
| D | 12 | 6 | 1403993 | 3555.39 | 1618 | 1570 | 394.5 |
| D | 13 | 249 | 308121 | 777.16 | 1618 | 1570 | 394.5 |
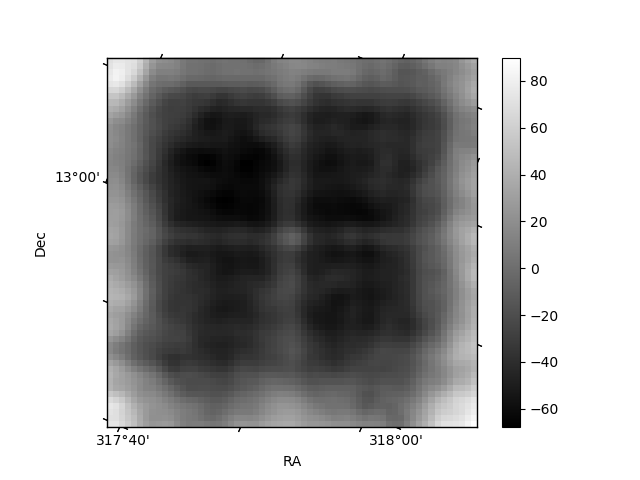
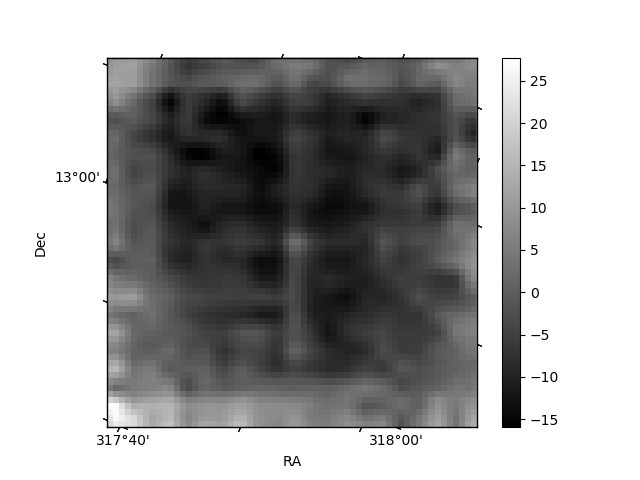
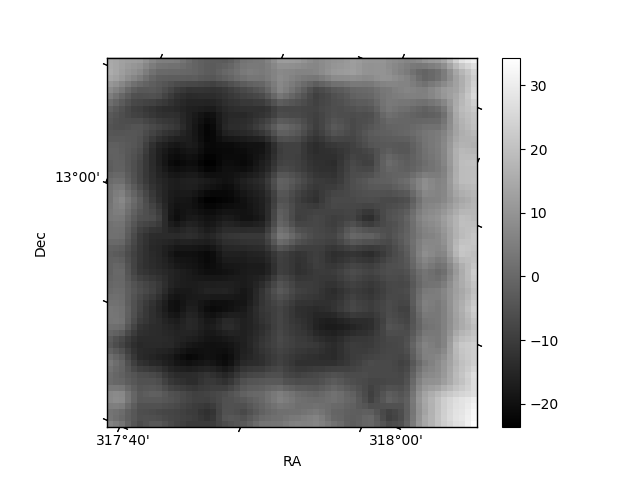
Histogram calculated using DETX and DETY for each event in the final _common_clean file
| Quadrant A | 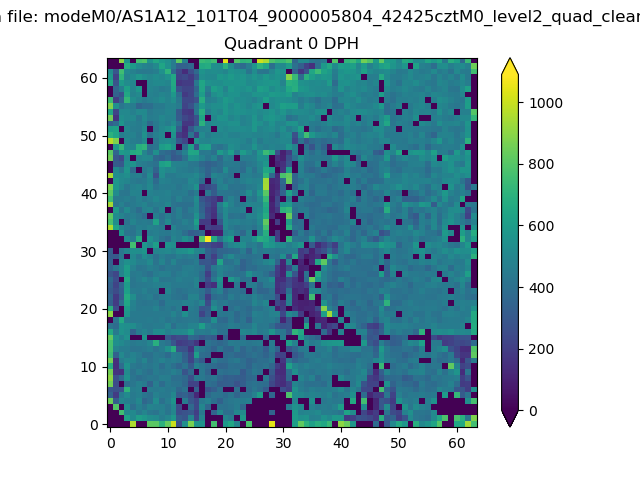 |
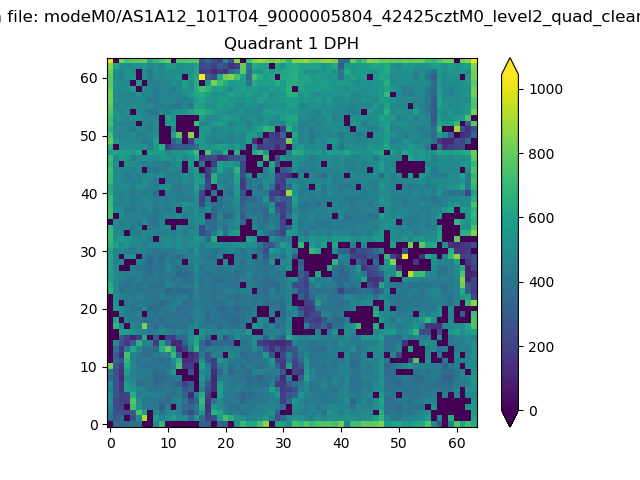 |
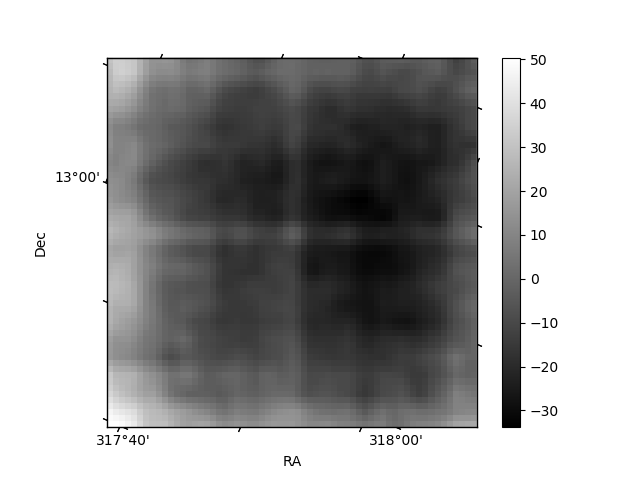
Quadrant B |
|---|---|---|---|
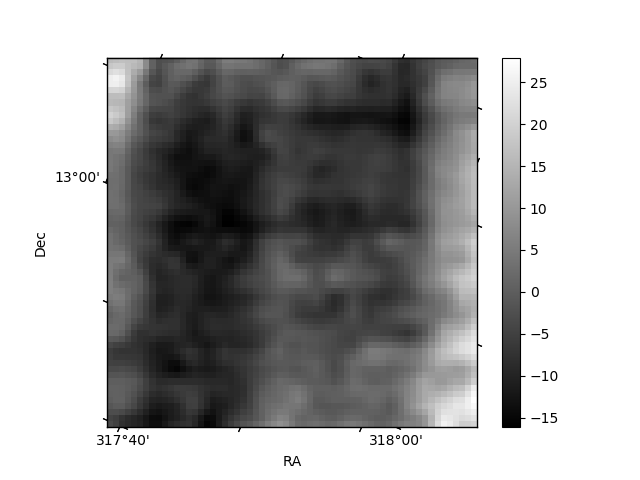
| Quadrant D | 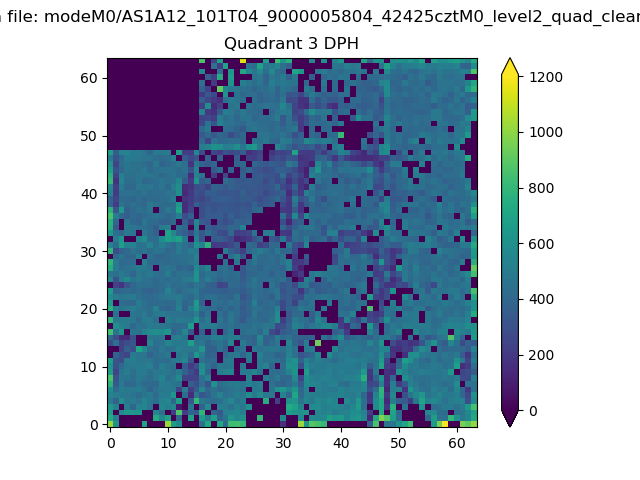 |
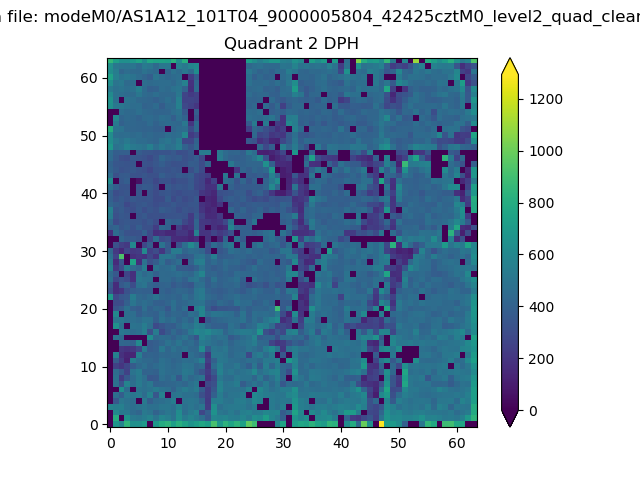 |
Quadrant C |
| Plot type | Count rate plots | Images |
|---|---|---|
| Comparison with Poisson distribution Blue bars denote a histogram of data divided into 1 sec bins. Red curve is a Poisson curve with rate = median count rate of data. |
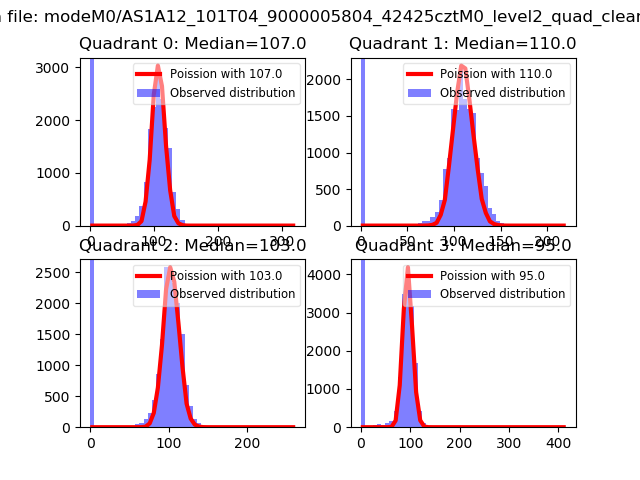 |
 |
| Quadrant-wise count rates Data is divided into 100 sec bins |
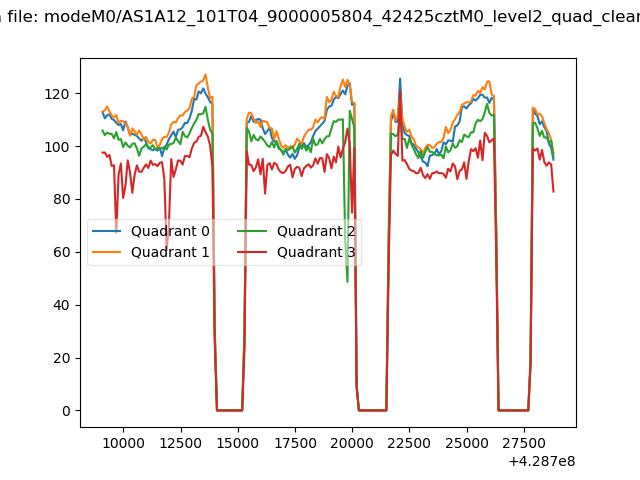 |
|
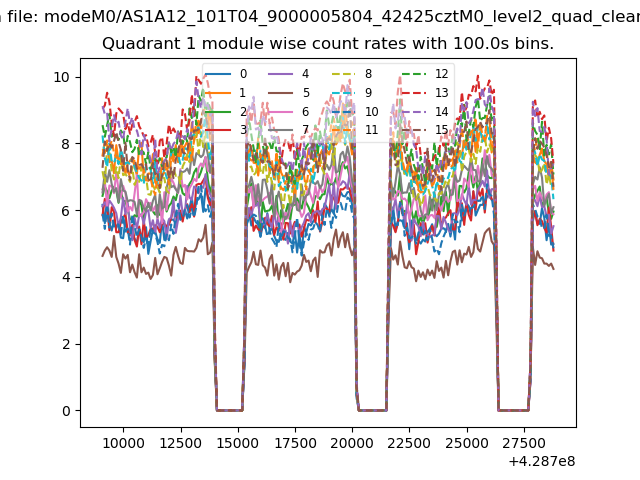
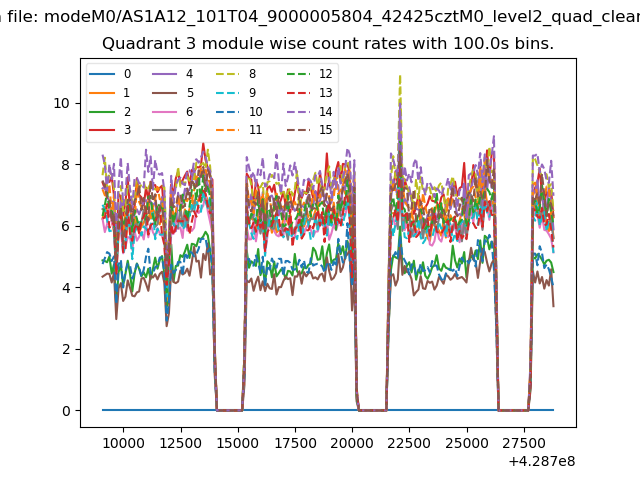
| Module-wise count rates for Quadrant A Data is divided into 100 sec bins |
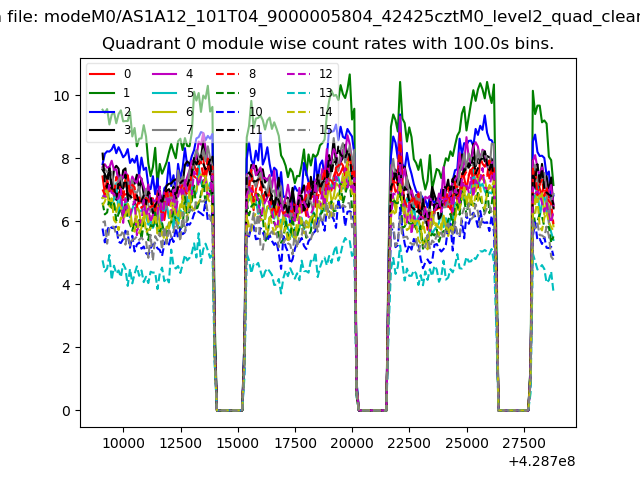 |
 |
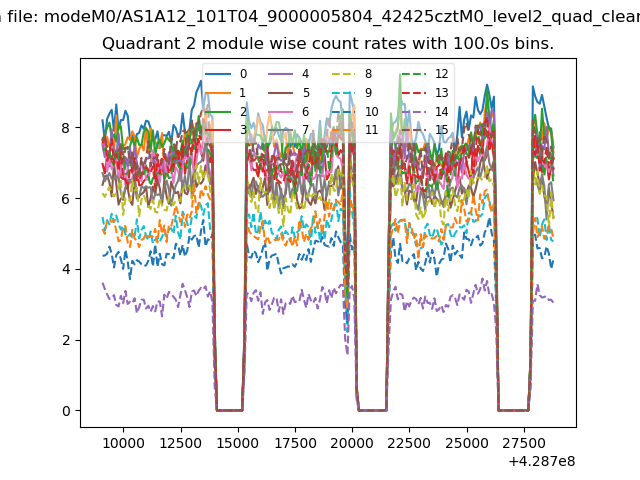
| Module-wise count rates for Quadrant B Data is divided into 100 sec bins |
 |
 |
| Module-wise count rates for Quadrant C Data is divided into 100 sec bins |
 |
 |
| Module-wise count rates for Quadrant D Data is divided into 100 sec bins |
 |
 |
| Parameter | Plot |
|---|---|
| CZT HV Monitor | 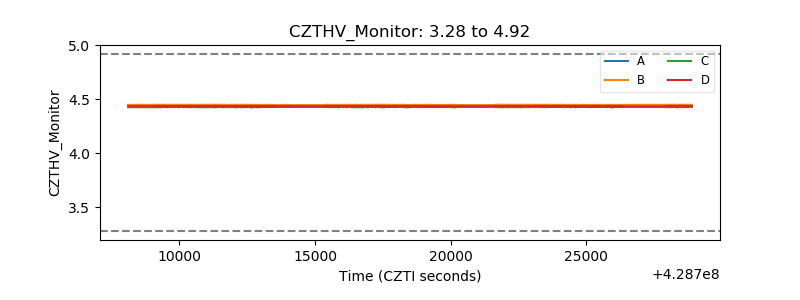 |
| D_VDD | 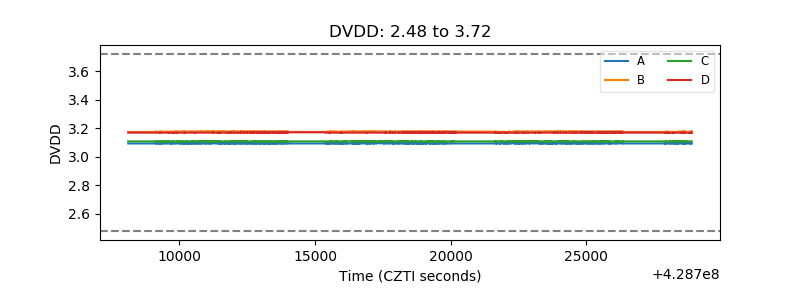 |
| Temperature 1 | 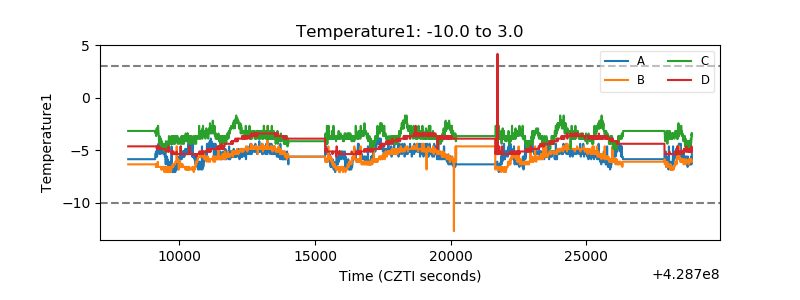 |
| Veto HV Monitor | 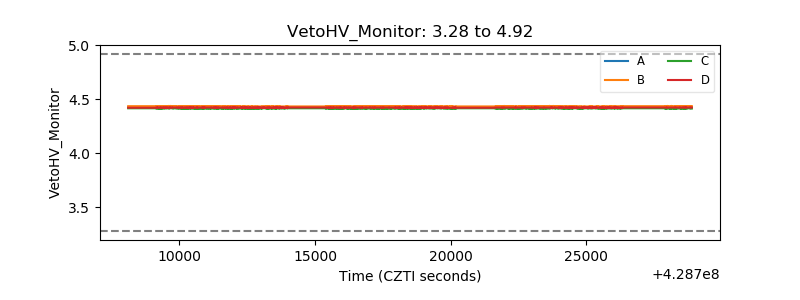 |
| Veto LLD | 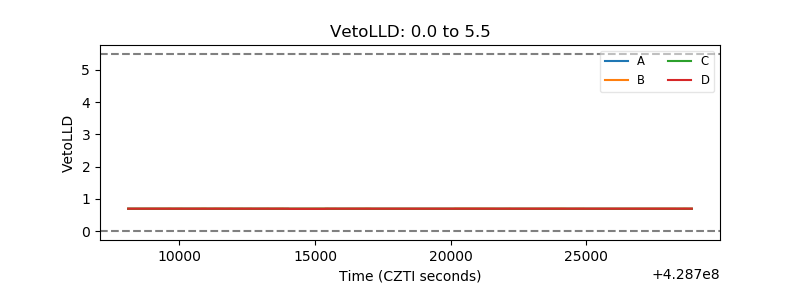 |
| Alpha Counter | 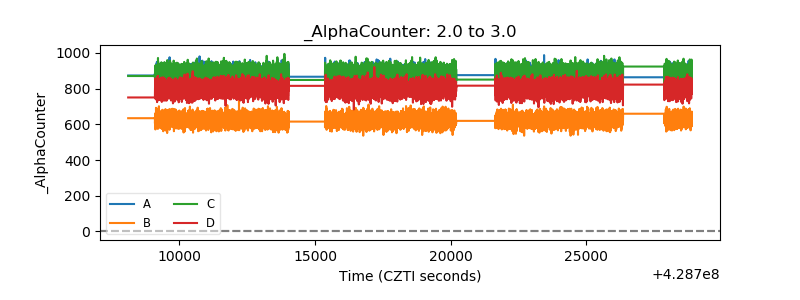 |
| _CPM_Rate | 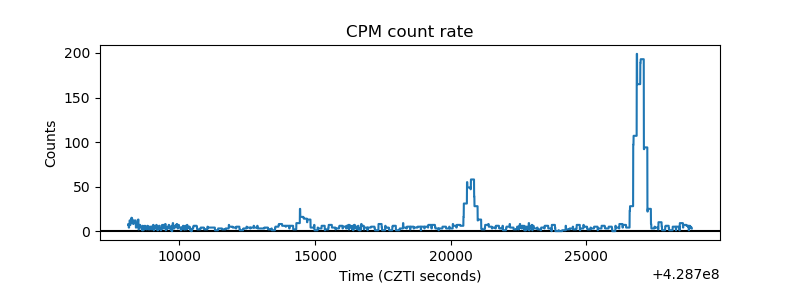 |
| CZT Counter | 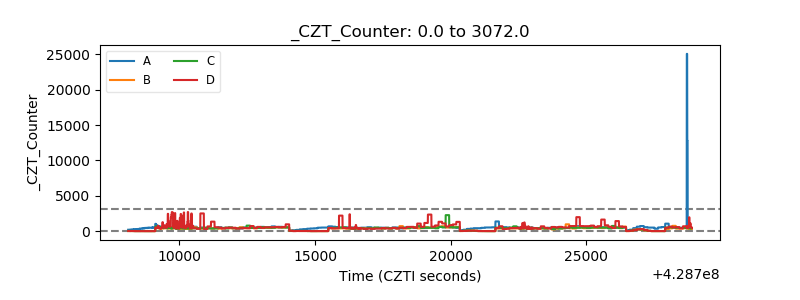 |
| +2.5 Volts monitor | 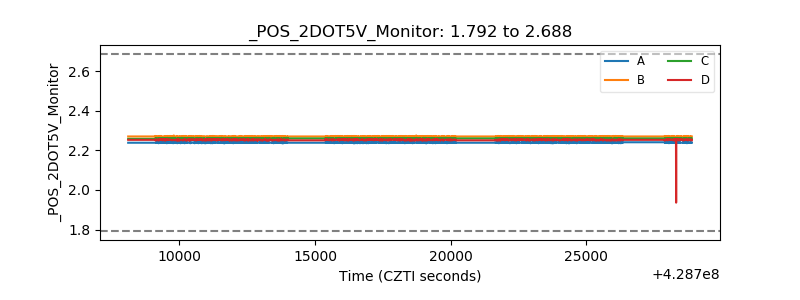 |
| +5 Volts monitor |  |
| _ROLL_ROT | 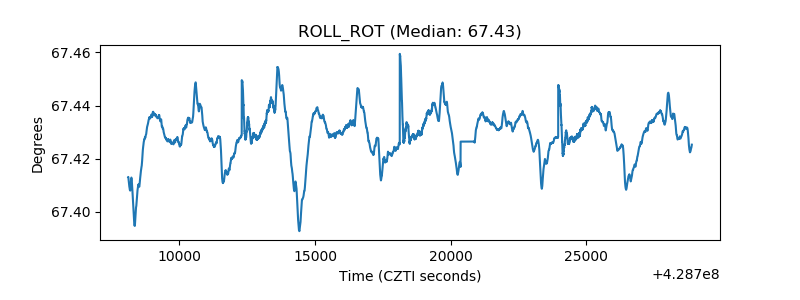 |
| _Roll_DEC | 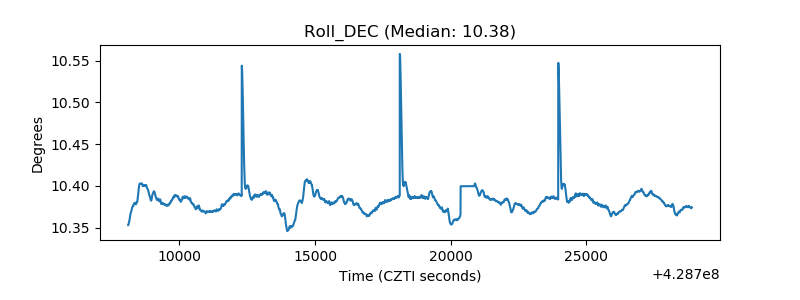 |
| _Roll_RA | 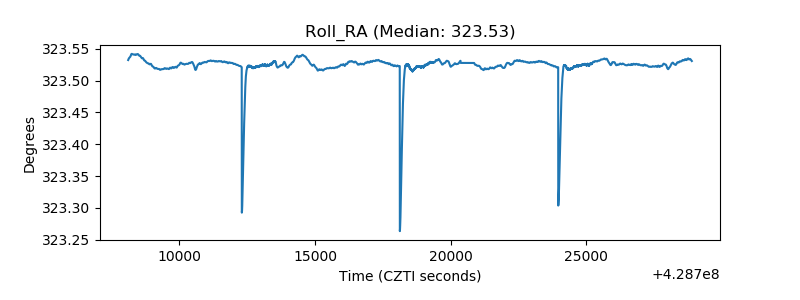 |
| Veto Counter | 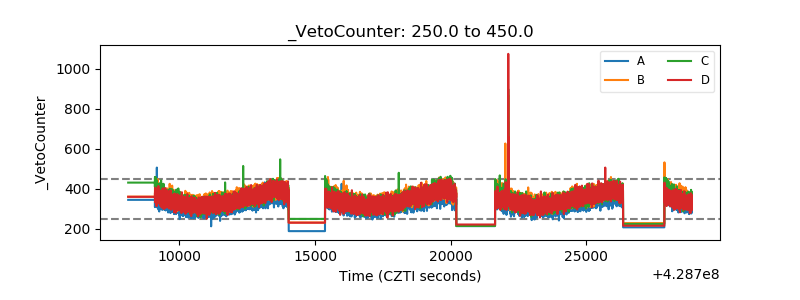 |