| Param | Original file | Final file |
|---|---|---|
| Filename | modeM0/AS1A12_101T04_9000005804_42426cztM0_level2.fits | modeM0/AS1A12_101T04_9000005804_42426cztM0_level2_quad_clean.evt |
| Size (bytes) | 259,220,160 | 66,219,840 |
| Size | 247.2 MB | 63.2 MB |
| Events in quadrant A | 2,096,422 | 447,138 |
| Events in quadrant B | 1,792,114 | 456,514 |
| Events in quadrant C | 1,904,833 | 428,409 |
| Events in quadrant D | 3,479,208 | 381,525 |
| Mode M0 | |||
|---|---|---|---|
| Quadrant | BADHDUFLAG | Total packets | Discarded packets |
| A | 0 | 8706 | 1 |
| B | 0 | 8355 | 1 |
| C | 0 | 8377 | 1 |
| D | 0 | 13267 | 1 |
| Mode M9 | |||
|---|---|---|---|
| Quadrant | BADHDUFLAG | Total packets | Discarded packets |
| A | 0 | 2 | 0 |
| B | 0 | 3 | 0 |
| C | 0 | 3 | 0 |
| D | 0 | 3 | 0 |
| Mode SS | |||
|---|---|---|---|
| Quadrant | BADHDUFLAG | Total packets | Discarded packets |
| A | 0 | 84 | 0 |
| B | 0 | 84 | 0 |
| C | 0 | 84 | 0 |
| D | 0 | 84 | 0 |
| Quadrant | Total seconds | Saturated seconds | Saturation percentage |
|---|---|---|---|
| A | 4134 | 8 | 0.193517% |
| B | 4134 | 13 | 0.314465% |
| C | 4134 | 6 | 0.145138% |
| D | 4134 | 265 | 6.410256% |
Noise dominated data is calculated using 1-second bins in cleaned event files. If a bin has >2000 counts, and if more than 50% of those come from <1% of pixels, then it is considered to be noise-dominated and hence unusable.
| Quadrant | # 1 sec bins | Bins with >0 counts | Bins with >2000 counts | High rate bins dominated by noise | Noise dominated (total time) | Noise dominated (detector-on time) | Marked lightcurve |
|---|---|---|---|---|---|---|---|
| A | 4134 | 4134 | 2 | 2 | 0.05% | 0.05% | 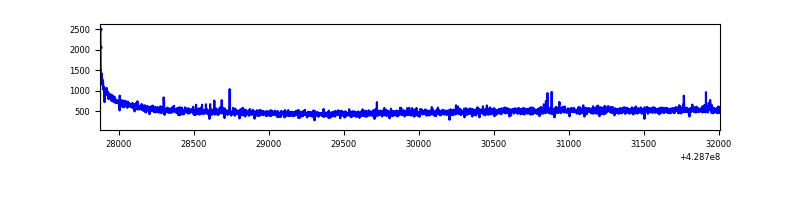 |
| B | 4134 | 4134 | 6 | 6 | 0.15% | 0.15% | 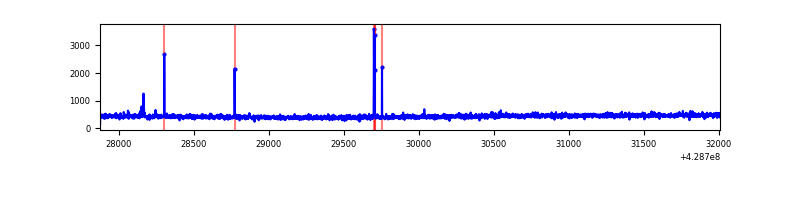 |
| C | 4134 | 4134 | 2 | 2 | 0.05% | 0.05% | 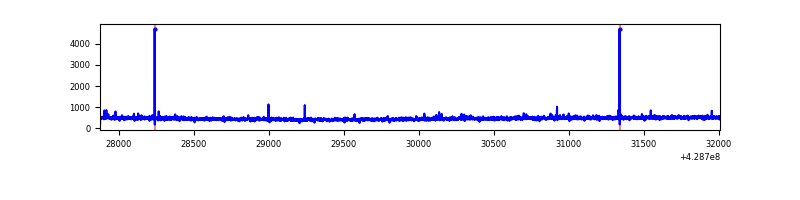 |
| D | 4134 | 4134 | 252 | 252 | 6.10% | 6.10% | 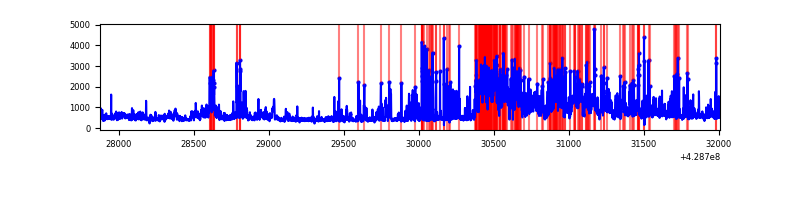 |
Top three noisy pixels from each quadrant. If the there are fewer than three noisy pixels in the level2.evt file, extra rows are filled as -1
| Pixel properties | Quadrant properties | ||||||
|---|---|---|---|---|---|---|---|
| Quadrant | DetID | PixID | Counts | Sigma | Mean | Median | Sigma |
| A | 10 | 83 | 339102 | 3619.22 | 451 | 442 | 93.6 |
| A | 13 | 254 | 6681 | 66.68 | 451 | 442 | 93.6 |
| A | 7 | 3 | 6084 | 60.3 | 451 | 442 | 93.6 |
| B | 5 | 172 | 26035 | 291.65 | 445 | 432 | 87.8 |
| B | 5 | 255 | 15216 | 168.41 | 445 | 432 | 87.8 |
| B | 12 | 111 | 11406 | 125.01 | 445 | 432 | 87.8 |
| C | 15 | 214 | 171025 | 1648.34 | 433 | 436 | 103.5 |
| C | 12 | 249 | 18627 | 175.77 | 433 | 436 | 103.5 |
| C | 15 | 111 | 17333 | 163.27 | 433 | 436 | 103.5 |
| D | 12 | 33 | 1147011 | 10802.39 | 427 | 415 | 106.1 |
| D | 2 | 16 | 361423 | 3401.15 | 427 | 415 | 106.1 |
| D | 1 | 52 | 148227 | 1392.58 | 427 | 415 | 106.1 |
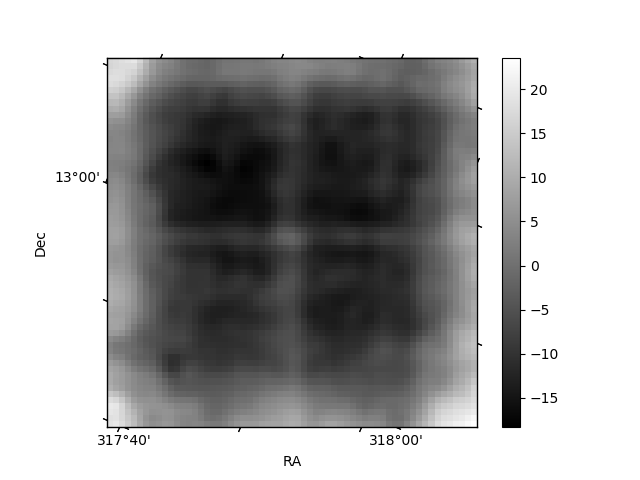
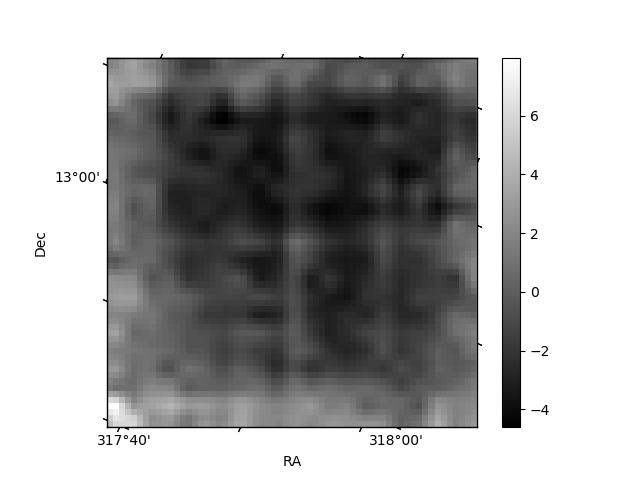
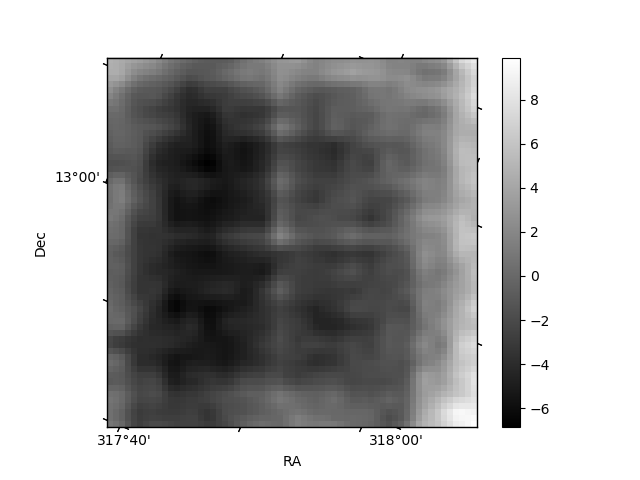
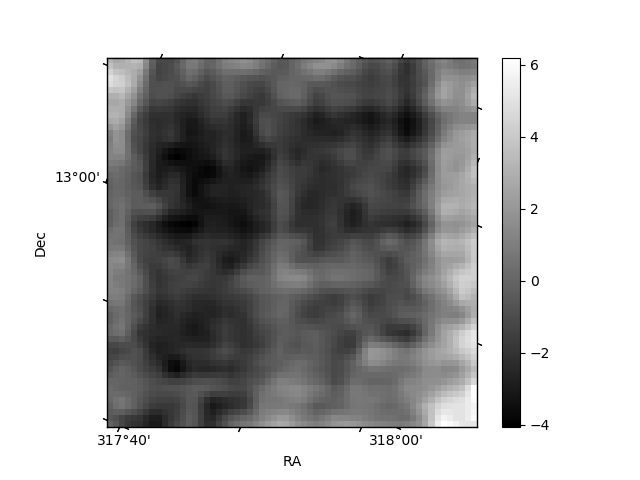
Histogram calculated using DETX and DETY for each event in the final _common_clean file
| Quadrant A | 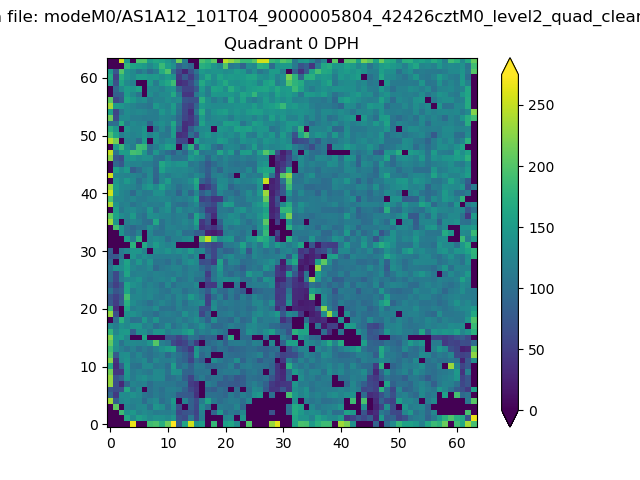 |
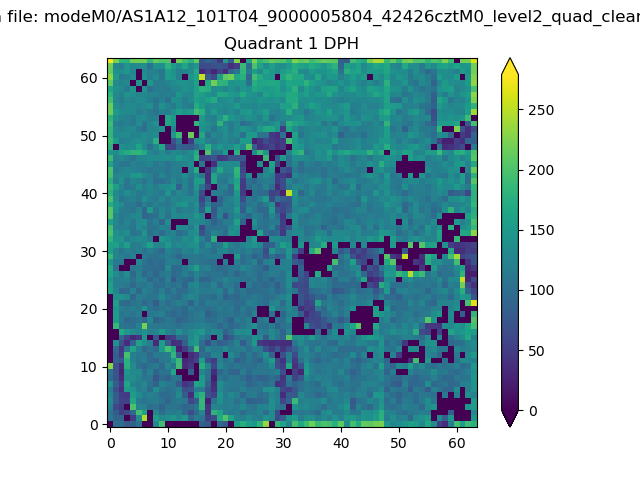 |
Quadrant B |
|---|---|---|---|
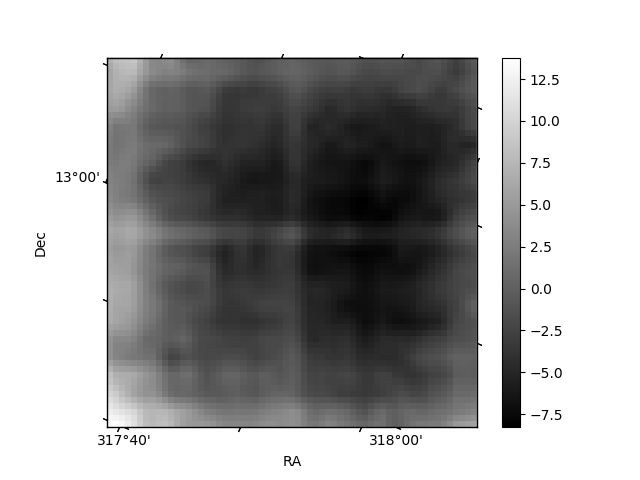
| Quadrant D | 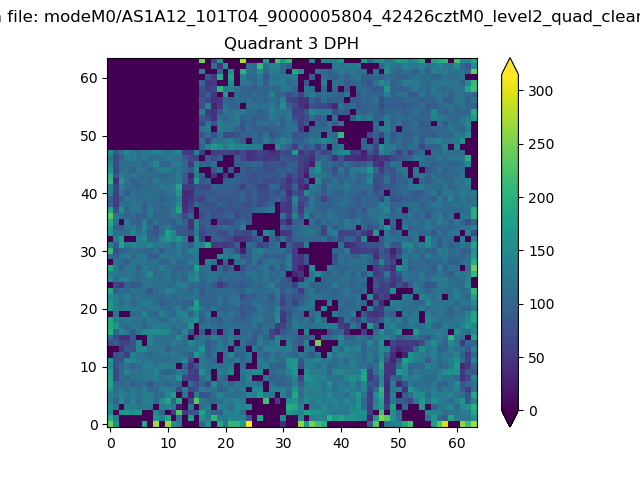 |
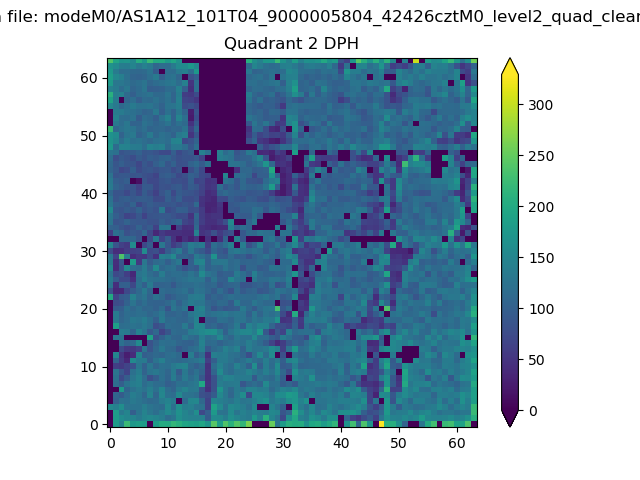 |
Quadrant C |
| Plot type | Count rate plots | Images |
|---|---|---|
| Comparison with Poisson distribution Blue bars denote a histogram of data divided into 1 sec bins. Red curve is a Poisson curve with rate = median count rate of data. |
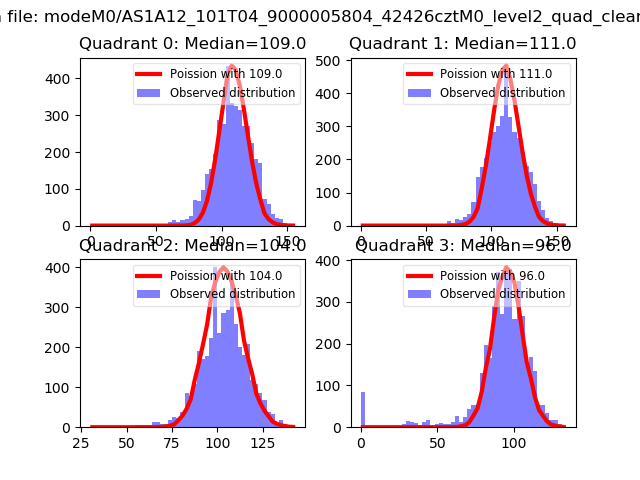 |
 |
| Quadrant-wise count rates Data is divided into 100 sec bins |
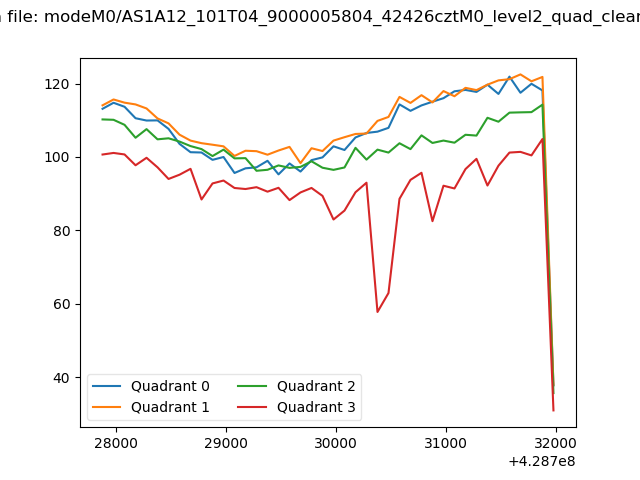 |
|
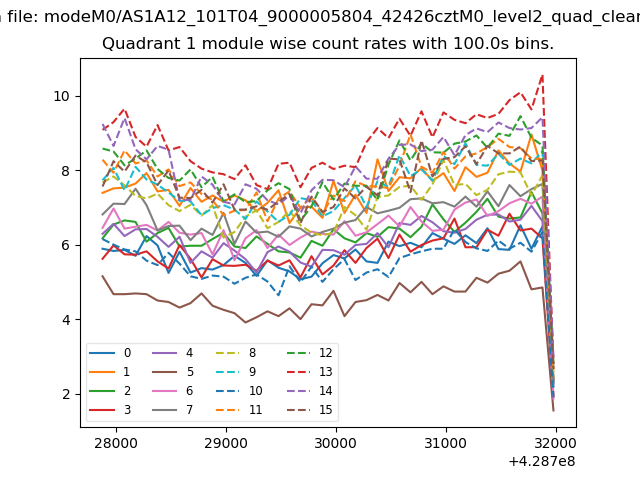
| Module-wise count rates for Quadrant A Data is divided into 100 sec bins |
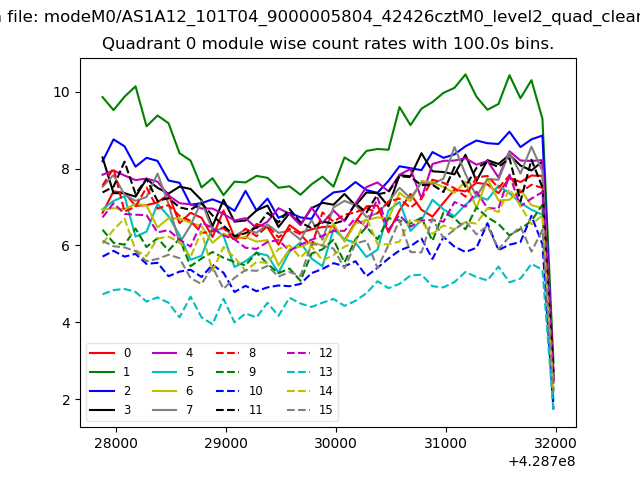 |
 |
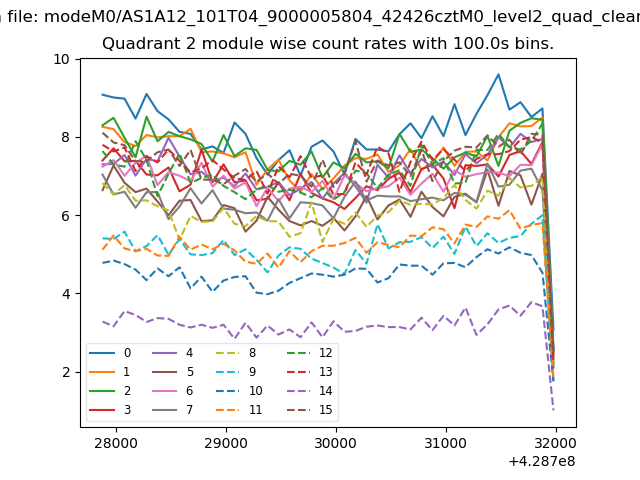
| Module-wise count rates for Quadrant B Data is divided into 100 sec bins |
 |
 |
| Module-wise count rates for Quadrant C Data is divided into 100 sec bins |
 |
 |
| Module-wise count rates for Quadrant D Data is divided into 100 sec bins |
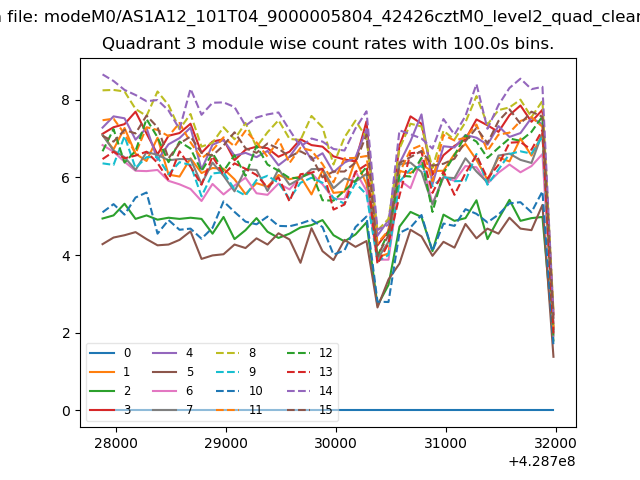 |
 |
| Parameter | Plot |
|---|---|
| CZT HV Monitor | 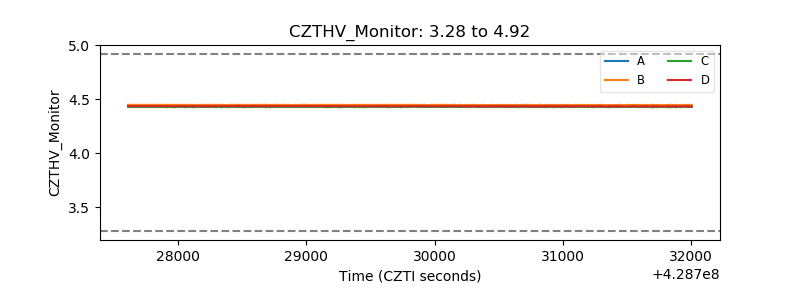 |
| D_VDD | 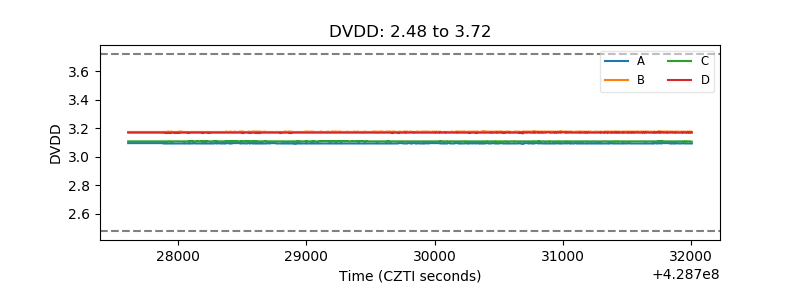 |
| Temperature 1 | 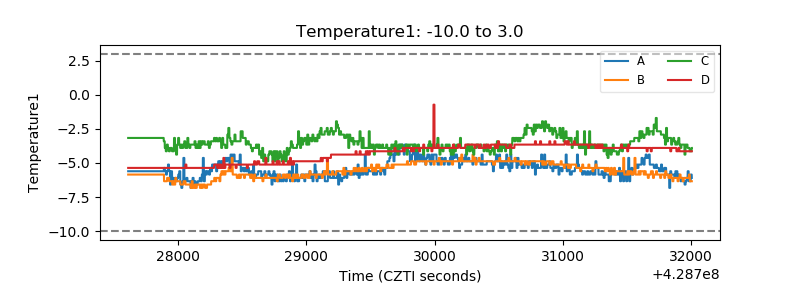 |
| Veto HV Monitor | 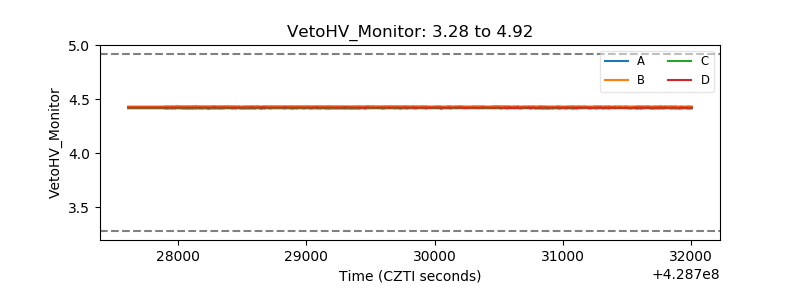 |
| Veto LLD | 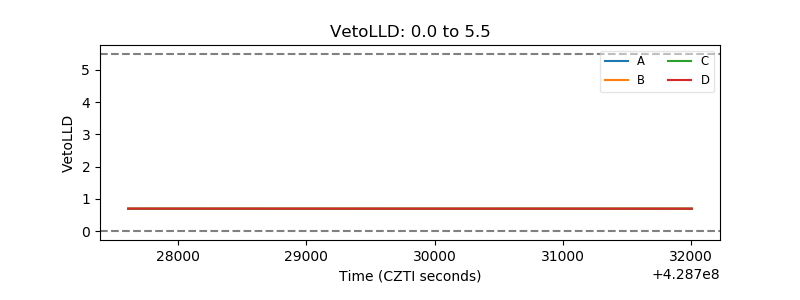 |
| Alpha Counter | 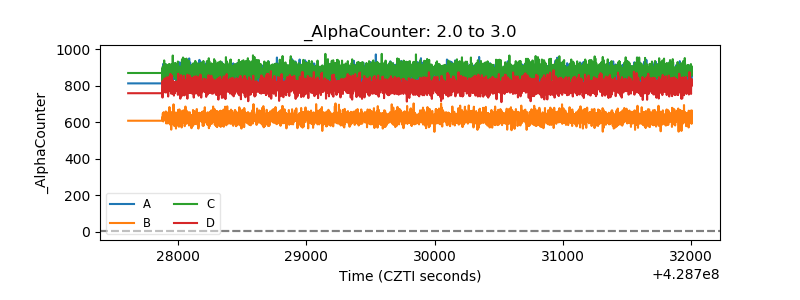 |
| _CPM_Rate | 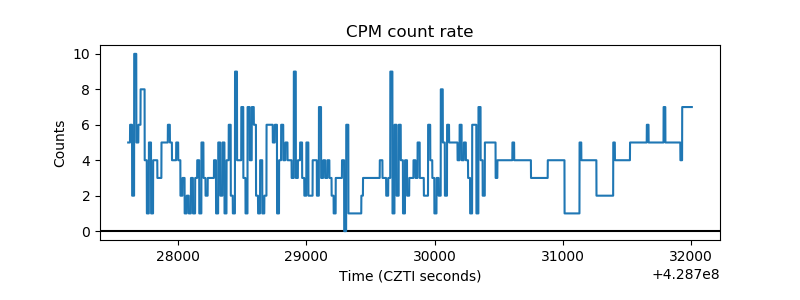 |
| CZT Counter | 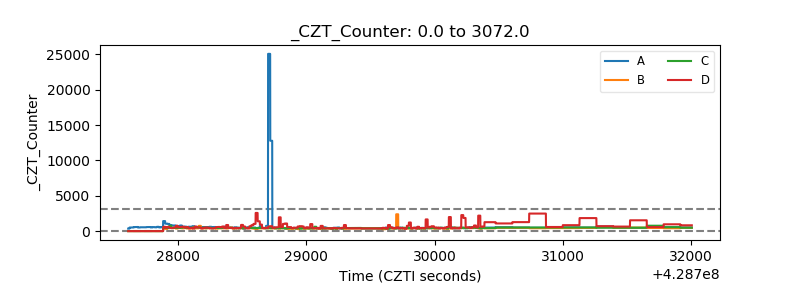 |
| +2.5 Volts monitor | 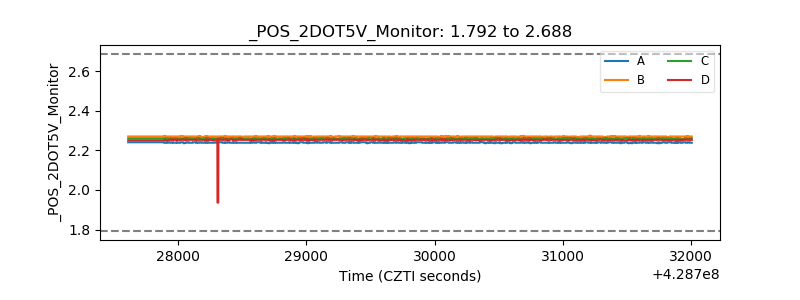 |
| +5 Volts monitor | 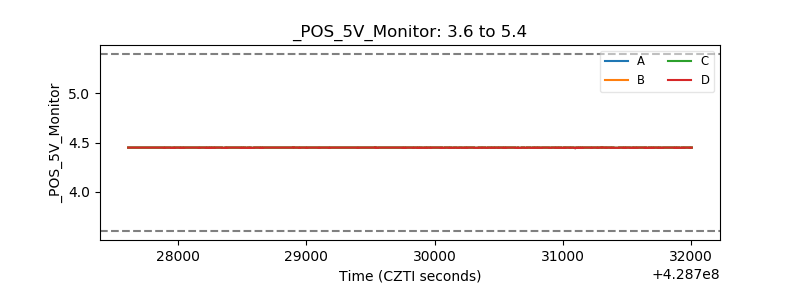 |
| _ROLL_ROT | 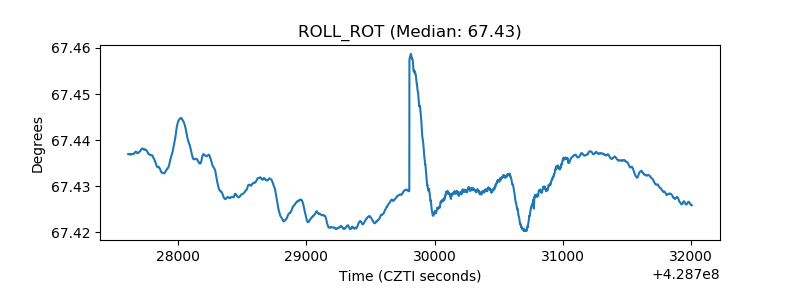 |
| _Roll_DEC | 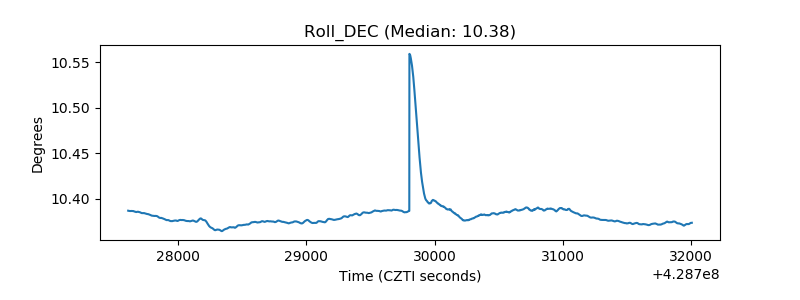 |
| _Roll_RA | 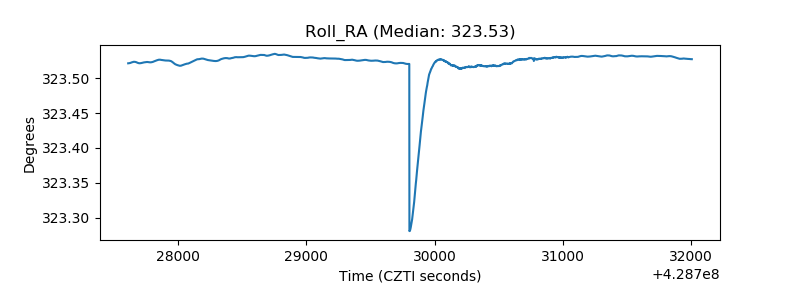 |
| Veto Counter | 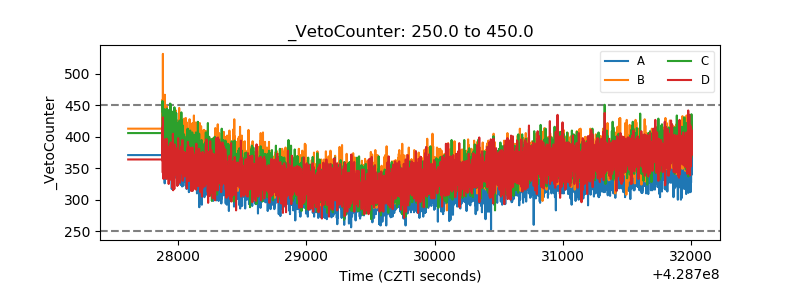 |