| Param | Original file | Final file |
|---|---|---|
| Filename | modeM0/AS1T05_138T01_9000005802_42410cztM0_level2.fits | modeM0/AS1T05_138T01_9000005802_42410cztM0_level2_quad_clean.evt |
| Size (bytes) | 535,248,000 | 126,394,560 |
| Size | 510.5 MB | 120.5 MB |
| Events in quadrant A | 4,174,200 | 858,461 |
| Events in quadrant B | 3,704,962 | 881,563 |
| Events in quadrant C | 3,835,079 | 833,178 |
| Events in quadrant D | 7,484,029 | 702,747 |
| Mode M9 | |||
|---|---|---|---|
| Quadrant | BADHDUFLAG | Total packets | Discarded packets |
| A | 0 | 28 | 0 |
| B | 0 | 28 | 0 |
| C | 0 | 28 | 0 |
| D | 0 | 28 | 0 |
| Mode M0 | |||
|---|---|---|---|
| Quadrant | BADHDUFLAG | Total packets | Discarded packets |
| A | 0 | 16996 | 2 |
| B | 0 | 16500 | 2 |
| C | 0 | 16280 | 2 |
| D | 0 | 27814 | 2 |
| Mode SS | |||
|---|---|---|---|
| Quadrant | BADHDUFLAG | Total packets | Discarded packets |
| A | 0 | 164 | 0 |
| B | 0 | 164 | 0 |
| C | 0 | 164 | 0 |
| D | 0 | 164 | 0 |
| Quadrant | Total seconds | Saturated seconds | Saturation percentage |
|---|---|---|---|
| A | 7920 | 9 | 0.113636% |
| B | 7920 | 39 | 0.492424% |
| C | 7920 | 33 | 0.416667% |
| D | 7920 | 850 | 10.732323% |
Noise dominated data is calculated using 1-second bins in cleaned event files. If a bin has >2000 counts, and if more than 50% of those come from <1% of pixels, then it is considered to be noise-dominated and hence unusable.
| Quadrant | # 1 sec bins | Bins with >0 counts | Bins with >2000 counts | High rate bins dominated by noise | Noise dominated (total time) | Noise dominated (detector-on time) | Marked lightcurve |
|---|---|---|---|---|---|---|---|
| A | 10754 | 7922 | 4 | 4 | 0.04% | 0.05% | 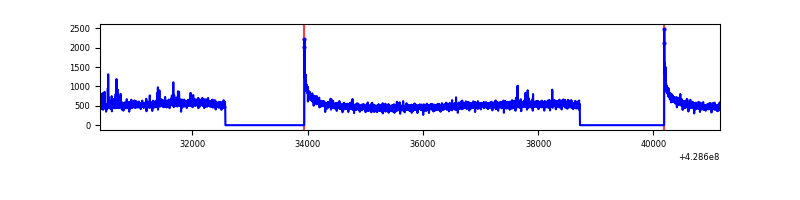 |
| B | 10754 | 7922 | 19 | 19 | 0.18% | 0.24% | 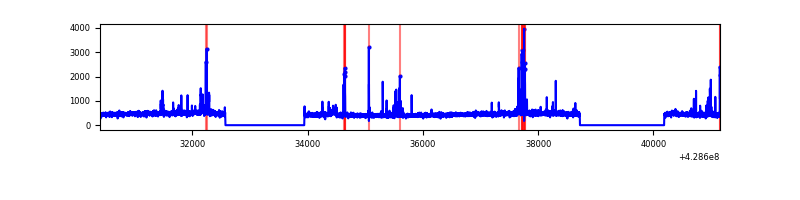 |
| C | 10754 | 7922 | 28 | 28 | 0.26% | 0.35% | 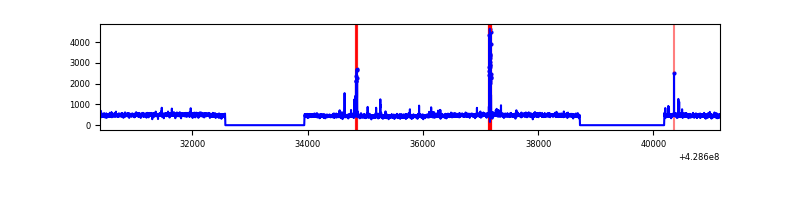 |
| D | 10754 | 7922 | 764 | 764 | 7.10% | 9.64% | 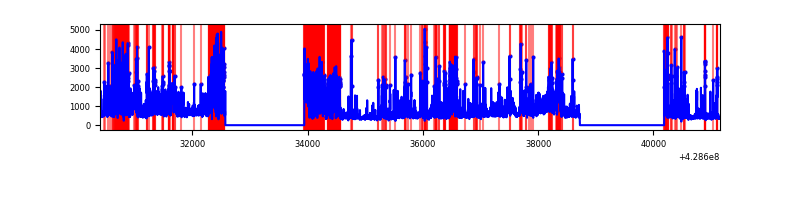 |
Top three noisy pixels from each quadrant. If the there are fewer than three noisy pixels in the level2.evt file, extra rows are filled as -1
| Pixel properties | Quadrant properties | ||||||
|---|---|---|---|---|---|---|---|
| Quadrant | DetID | PixID | Counts | Sigma | Mean | Median | Sigma |
| A | 10 | 83 | 721718 | 3998.32 | 878 | 860 | 180.3 |
| A | 13 | 248 | 16844 | 88.66 | 878 | 860 | 180.3 |
| A | 15 | 235 | 16258 | 85.41 | 878 | 860 | 180.3 |
| B | 5 | 255 | 101906 | 595.77 | 872 | 848 | 169.6 |
| B | 0 | 186 | 78253 | 456.33 | 872 | 848 | 169.6 |
| B | 5 | 172 | 39858 | 229.98 | 872 | 848 | 169.6 |
| C | 15 | 214 | 327635 | 1644.18 | 853 | 856 | 198.7 |
| C | 0 | 207 | 121993 | 609.5 | 853 | 856 | 198.7 |
| C | 9 | 54 | 19518 | 93.9 | 853 | 856 | 198.7 |
| D | 2 | 16 | 1165275 | 5753.06 | 821 | 795 | 202.4 |
| D | 13 | 249 | 798393 | 3940.49 | 821 | 795 | 202.4 |
| D | 6 | 219 | 768727 | 3793.93 | 821 | 795 | 202.4 |
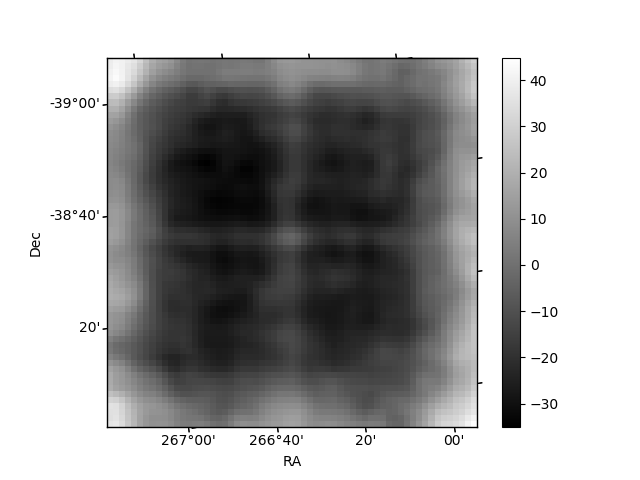
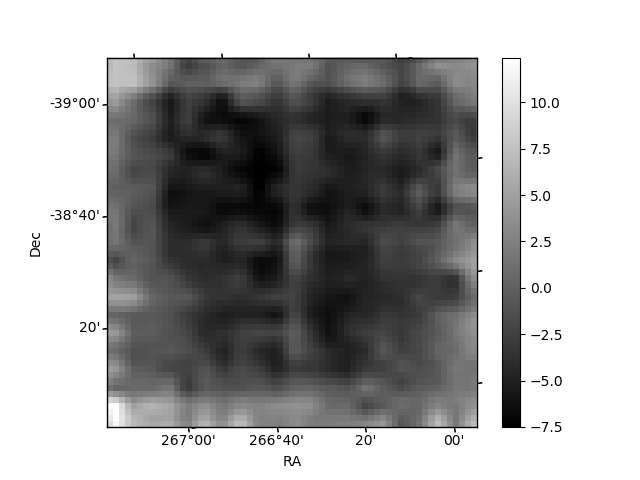
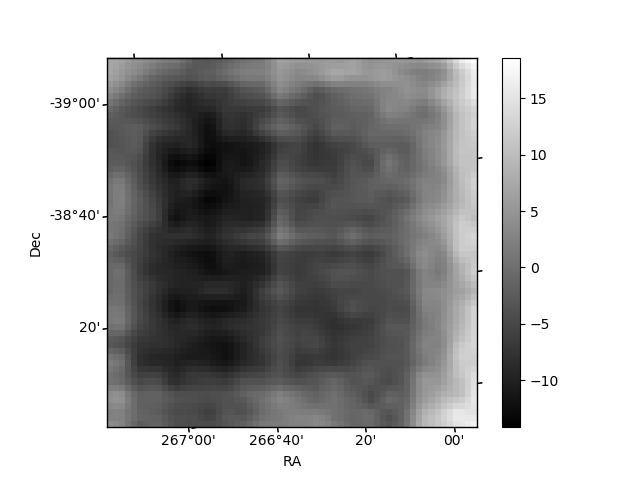
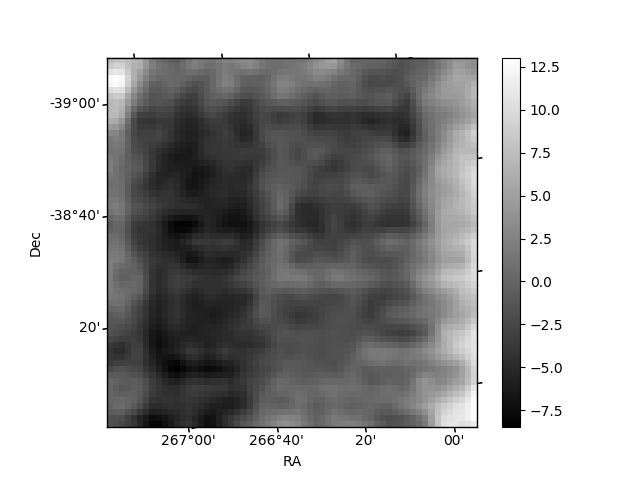
Histogram calculated using DETX and DETY for each event in the final _common_clean file
| Quadrant A | 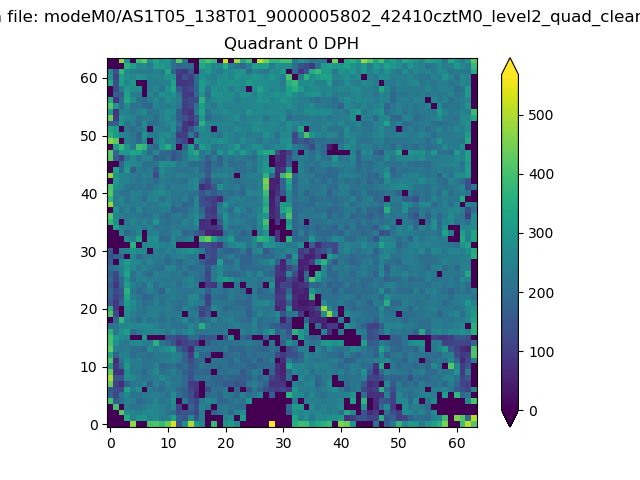 |
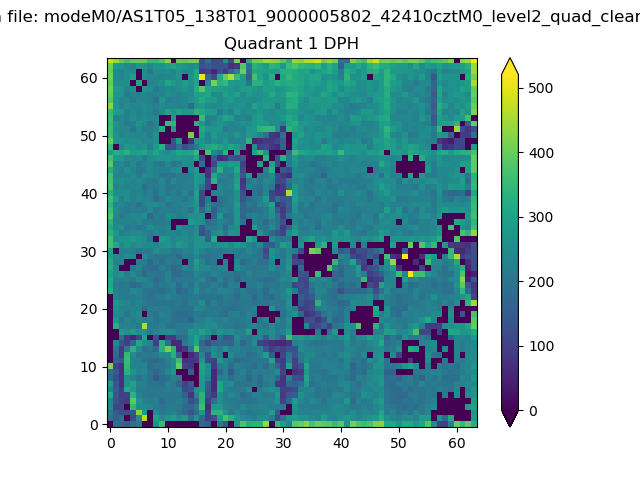 |
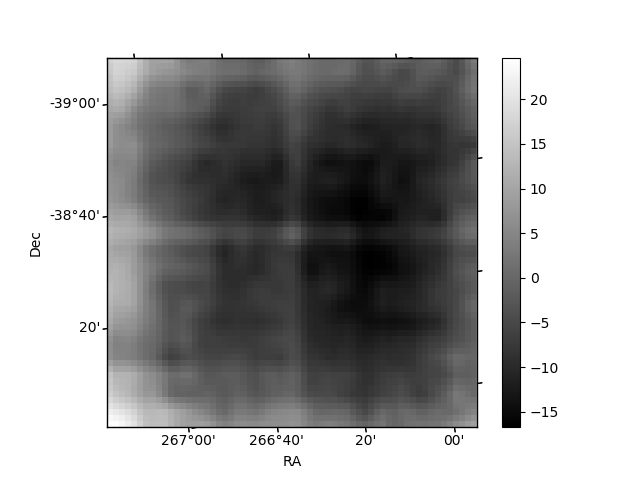
Quadrant B |
|---|---|---|---|
| Quadrant D | 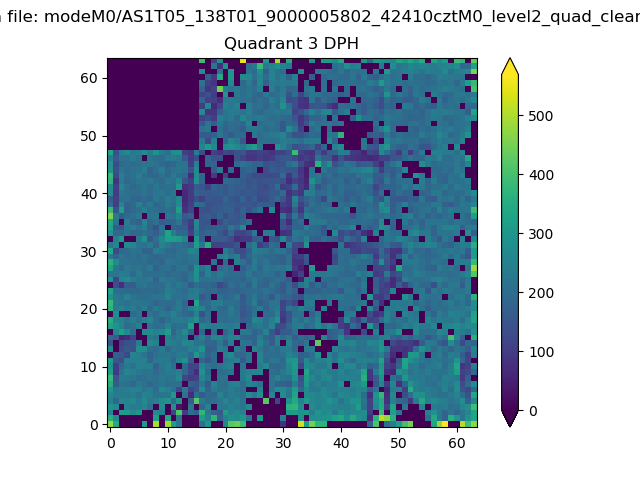 |
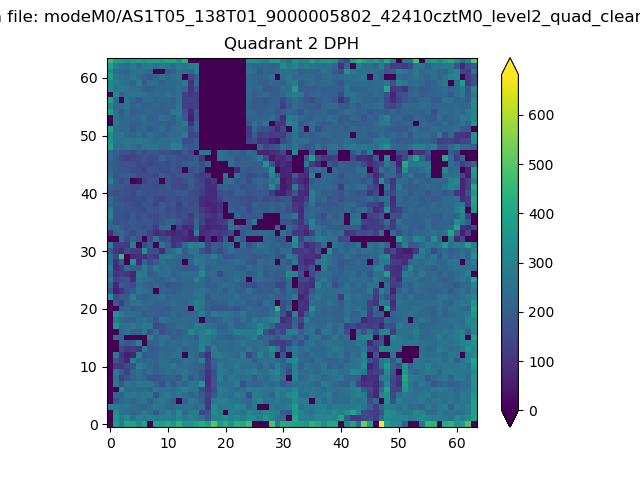 |
Quadrant C |
| Plot type | Count rate plots | Images |
|---|---|---|
| Comparison with Poisson distribution Blue bars denote a histogram of data divided into 1 sec bins. Red curve is a Poisson curve with rate = median count rate of data. |
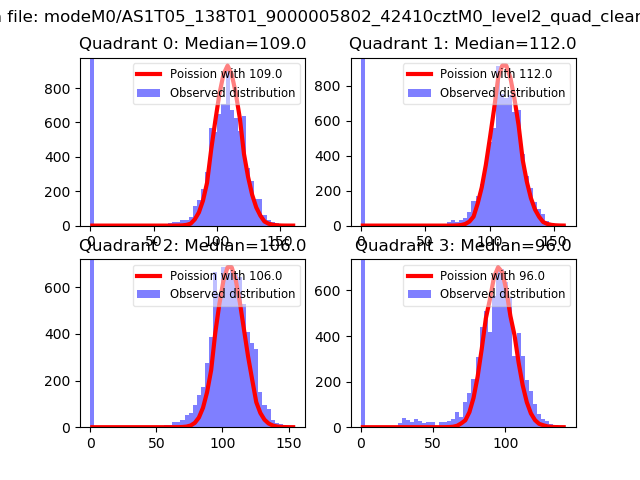 |
 |
| Quadrant-wise count rates Data is divided into 100 sec bins |
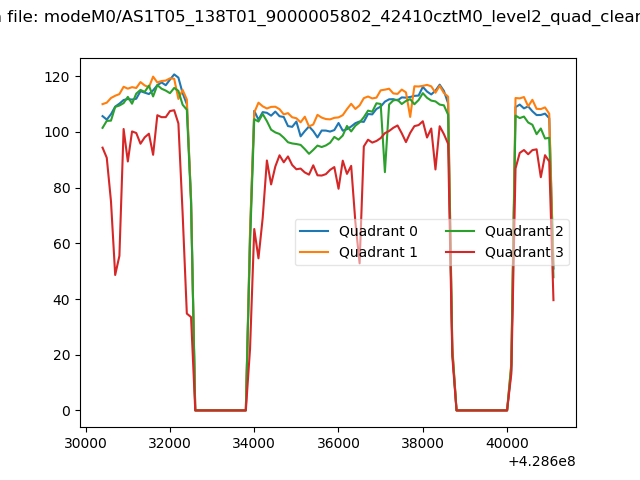 |
|
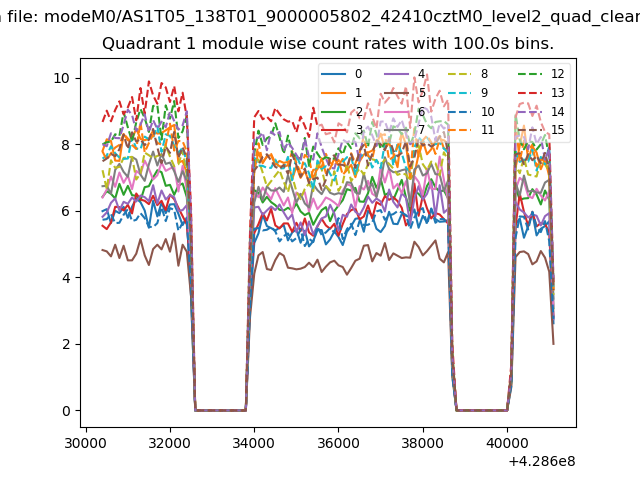
| Module-wise count rates for Quadrant A Data is divided into 100 sec bins |
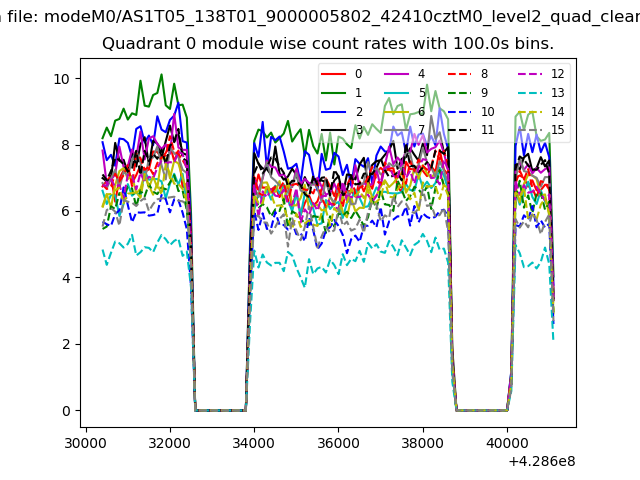 |
 |
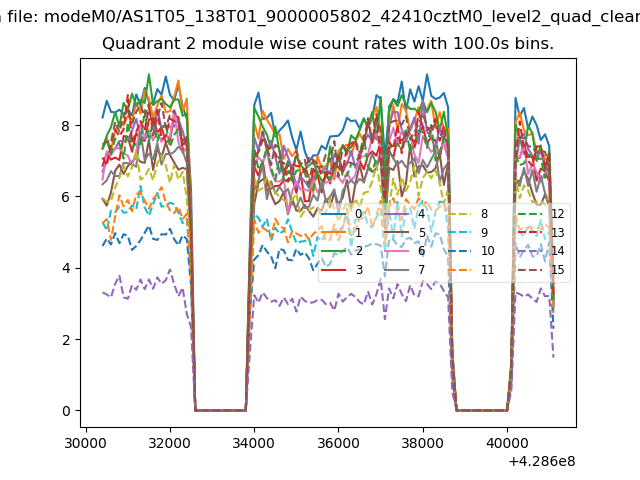
| Module-wise count rates for Quadrant B Data is divided into 100 sec bins |
 |
 |
| Module-wise count rates for Quadrant C Data is divided into 100 sec bins |
 |
 |
| Module-wise count rates for Quadrant D Data is divided into 100 sec bins |
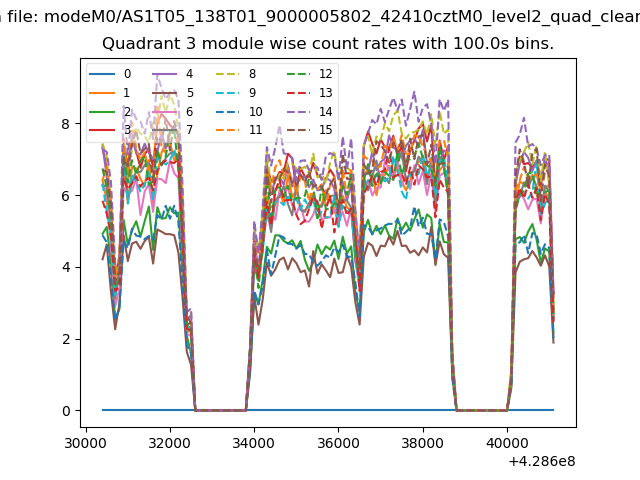 |
 |
| Parameter | Plot |
|---|---|
| CZT HV Monitor | 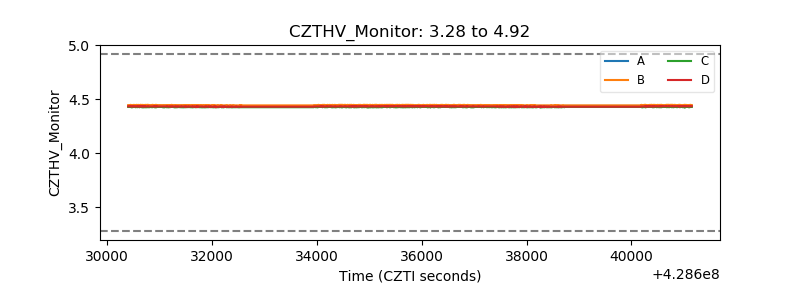 |
| D_VDD | 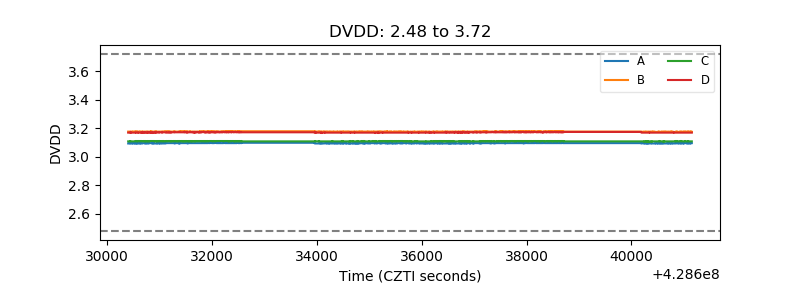 |
| Temperature 1 | 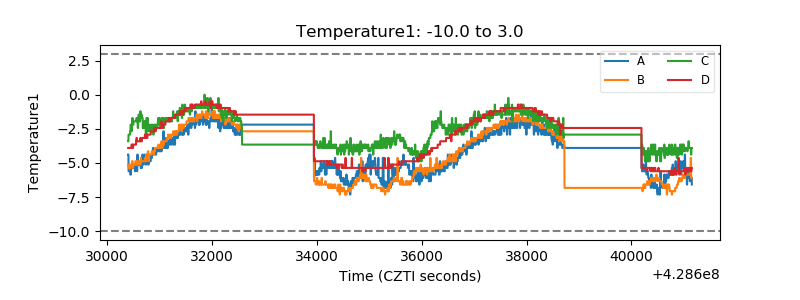 |
| Veto HV Monitor | 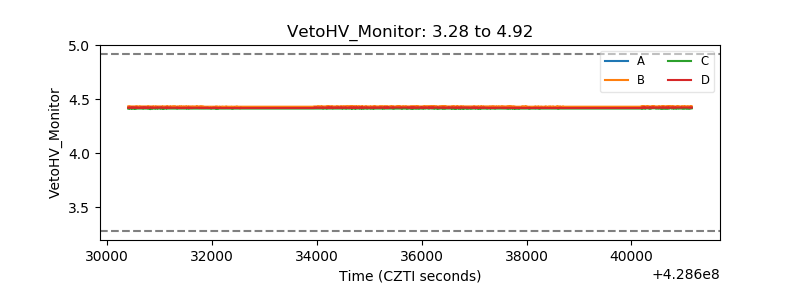 |
| Veto LLD | 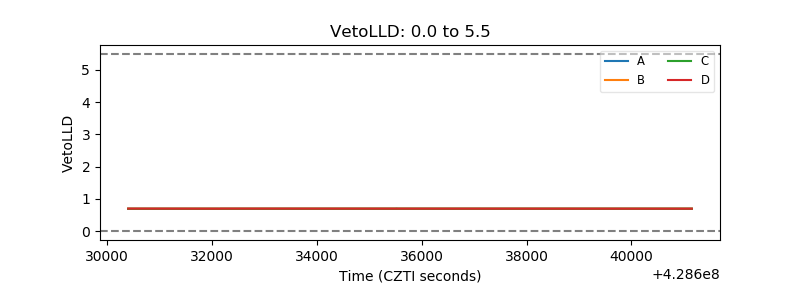 |
| Alpha Counter | 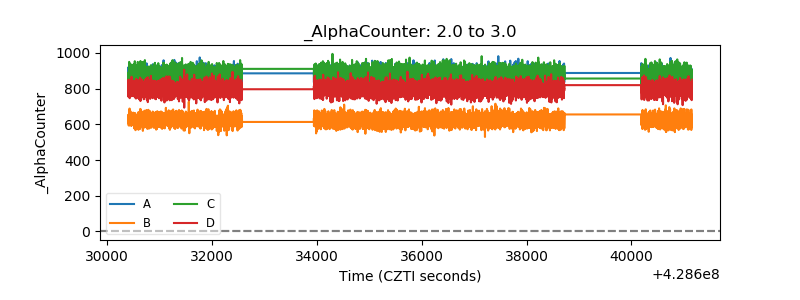 |
| _CPM_Rate | 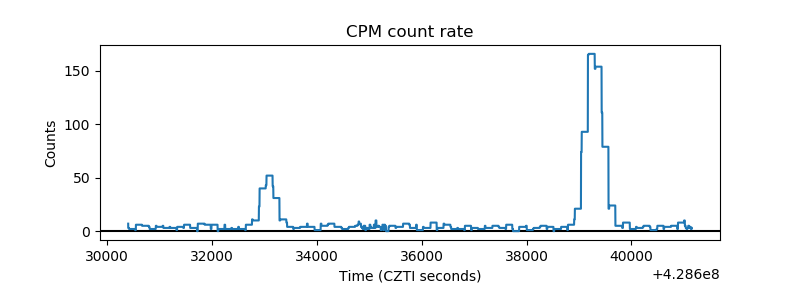 |
| CZT Counter | 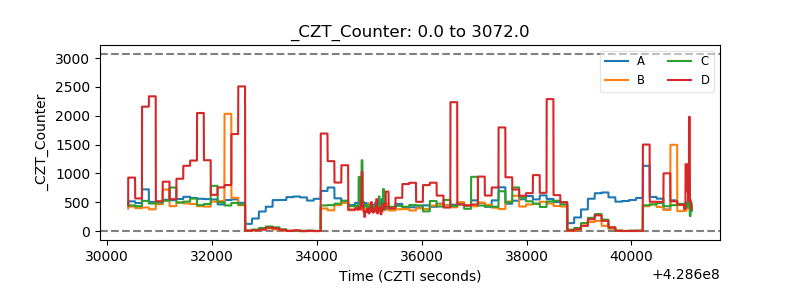 |
| +2.5 Volts monitor | 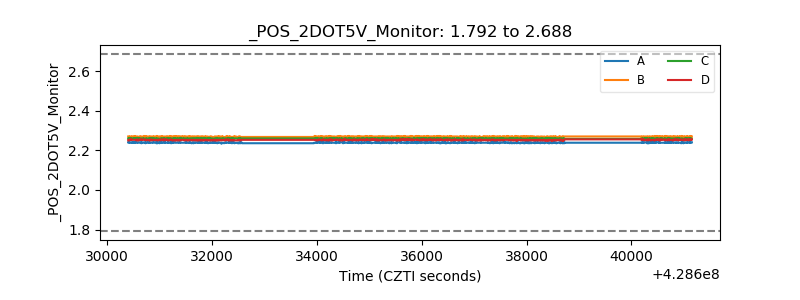 |
| +5 Volts monitor |  |
| _ROLL_ROT | 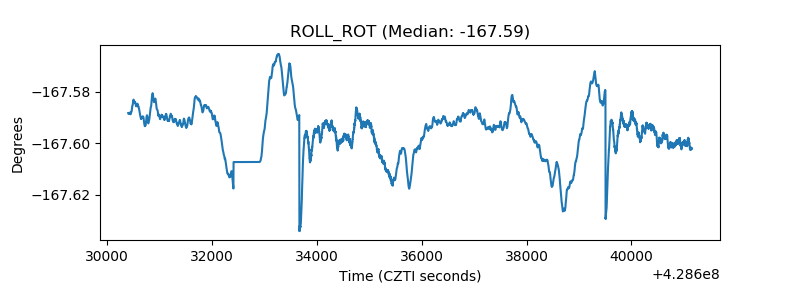 |
| _Roll_DEC | 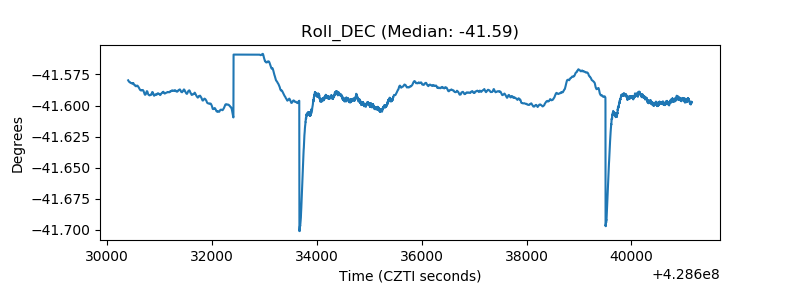 |
| _Roll_RA | 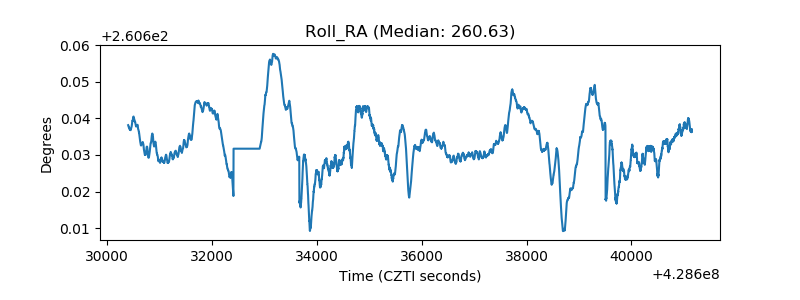 |
| Veto Counter | 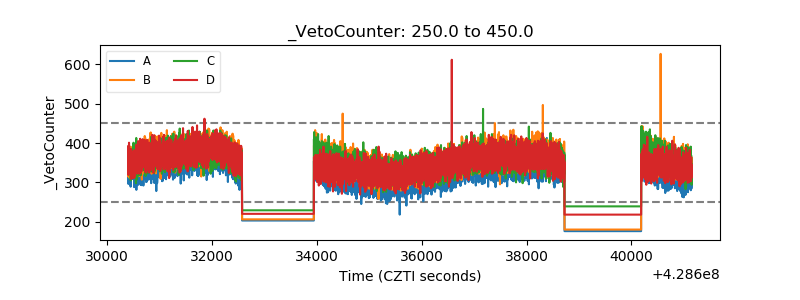 |