| Param | Original file | Final file |
|---|---|---|
| Filename | modeM0/AS1T05_138T01_9000005802_42411cztM0_level2.fits | modeM0/AS1T05_138T01_9000005802_42411cztM0_level2_quad_clean.evt |
| Size (bytes) | 336,576,960 | 91,411,200 |
| Size | 321.0 MB | 87.2 MB |
| Events in quadrant A | 2,988,860 | 612,283 |
| Events in quadrant B | 2,682,648 | 629,240 |
| Events in quadrant C | 2,773,228 | 592,795 |
| Events in quadrant D | 3,569,852 | 534,468 |
| Mode M9 | |||
|---|---|---|---|
| Quadrant | BADHDUFLAG | Total packets | Discarded packets |
| A | 0 | 24 | 0 |
| B | 0 | 25 | 0 |
| C | 0 | 25 | 0 |
| D | 0 | 25 | 0 |
| Mode M0 | |||
|---|---|---|---|
| Quadrant | BADHDUFLAG | Total packets | Discarded packets |
| A | 0 | 12273 | 2 |
| B | 0 | 12059 | 2 |
| C | 0 | 11909 | 2 |
| D | 0 | 14607 | 2 |
| Mode SS | |||
|---|---|---|---|
| Quadrant | BADHDUFLAG | Total packets | Discarded packets |
| A | 0 | 116 | 0 |
| B | 0 | 116 | 0 |
| C | 0 | 116 | 0 |
| D | 0 | 116 | 0 |
| Quadrant | Total seconds | Saturated seconds | Saturation percentage |
|---|---|---|---|
| A | 5704 | 6 | 0.105189% |
| B | 5703 | 30 | 0.526039% |
| C | 5703 | 23 | 0.403297% |
| D | 5703 | 188 | 3.296511% |
Noise dominated data is calculated using 1-second bins in cleaned event files. If a bin has >2000 counts, and if more than 50% of those come from <1% of pixels, then it is considered to be noise-dominated and hence unusable.
| Quadrant | # 1 sec bins | Bins with >0 counts | Bins with >2000 counts | High rate bins dominated by noise | Noise dominated (total time) | Noise dominated (detector-on time) | Marked lightcurve |
|---|---|---|---|---|---|---|---|
| A | 7287 | 5705 | 3 | 3 | 0.04% | 0.05% | 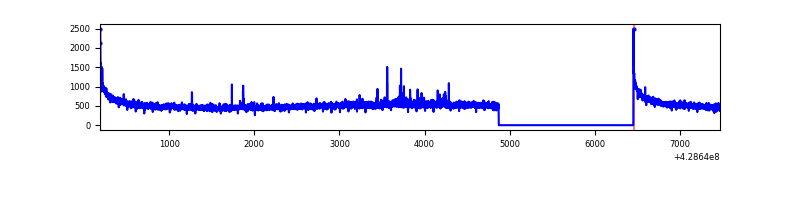 |
| B | 7286 | 5704 | 14 | 14 | 0.19% | 0.25% | 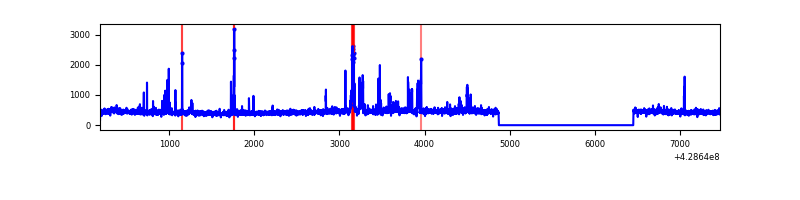 |
| C | 7286 | 5704 | 17 | 17 | 0.23% | 0.30% | 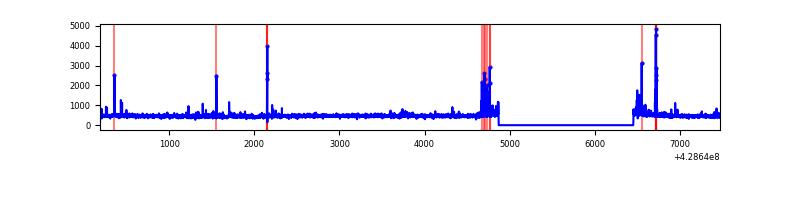 |
| D | 7286 | 5704 | 148 | 148 | 2.03% | 2.59% | 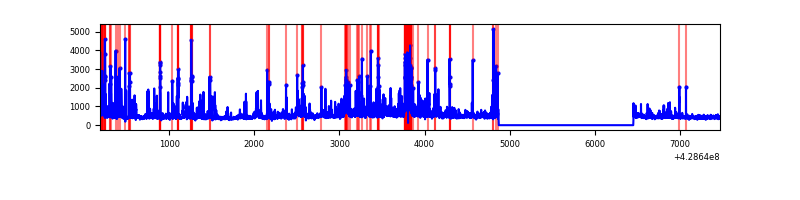 |
Top three noisy pixels from each quadrant. If the there are fewer than three noisy pixels in the level2.evt file, extra rows are filled as -1
| Pixel properties | Quadrant properties | ||||||
|---|---|---|---|---|---|---|---|
| Quadrant | DetID | PixID | Counts | Sigma | Mean | Median | Sigma |
| A | 10 | 83 | 568827 | 4488.68 | 613 | 599 | 126.6 |
| A | 13 | 248 | 29051 | 224.75 | 613 | 599 | 126.6 |
| A | 13 | 6 | 11706 | 87.74 | 613 | 599 | 126.6 |
| B | 15 | 32 | 74744 | 627.17 | 613 | 595 | 118.2 |
| B | 5 | 255 | 54294 | 454.2 | 613 | 595 | 118.2 |
| B | 0 | 186 | 52195 | 436.45 | 613 | 595 | 118.2 |
| C | 15 | 214 | 237850 | 1697.57 | 600 | 603 | 139.8 |
| C | 14 | 254 | 113936 | 810.93 | 600 | 603 | 139.8 |
| C | 4 | 254 | 47362 | 334.57 | 600 | 603 | 139.8 |
| D | 1 | 47 | 428898 | 2942.3 | 590 | 572 | 145.6 |
| D | 1 | 52 | 237185 | 1625.37 | 590 | 572 | 145.6 |
| D | 12 | 218 | 121433 | 830.23 | 590 | 572 | 145.6 |
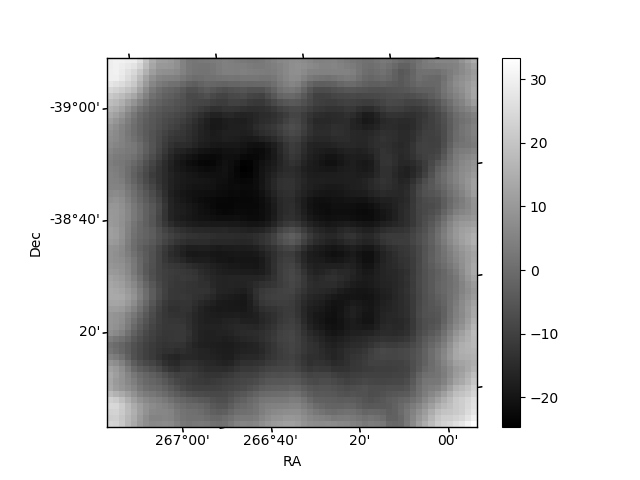
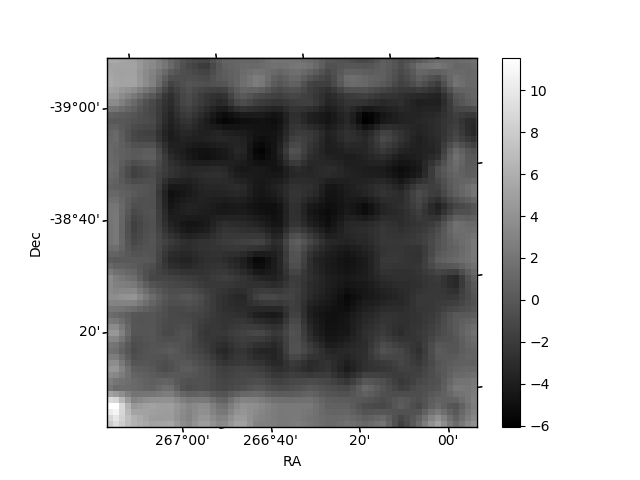
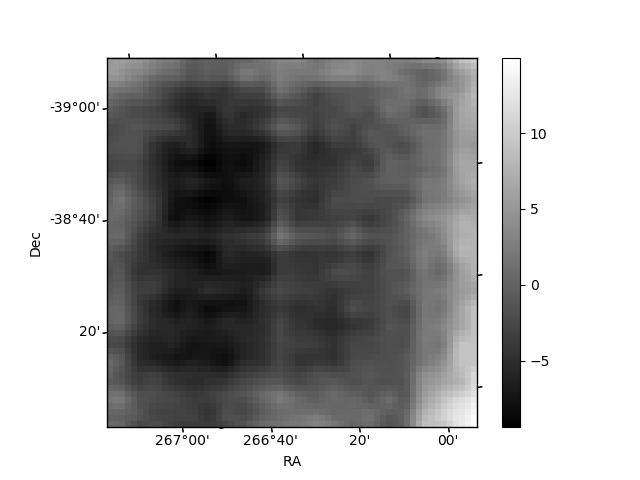
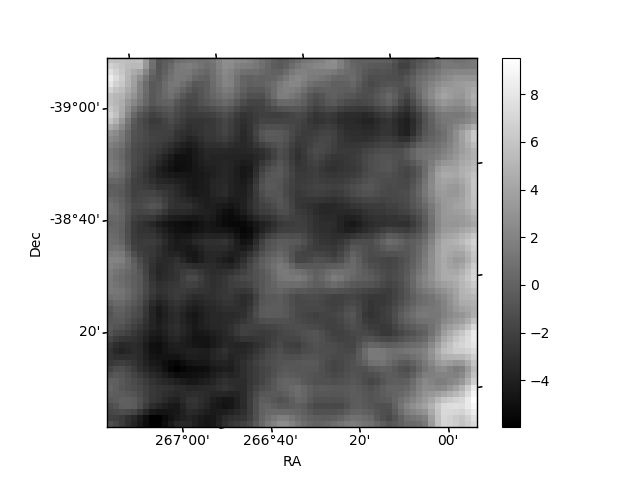
Histogram calculated using DETX and DETY for each event in the final _common_clean file
| Quadrant A | 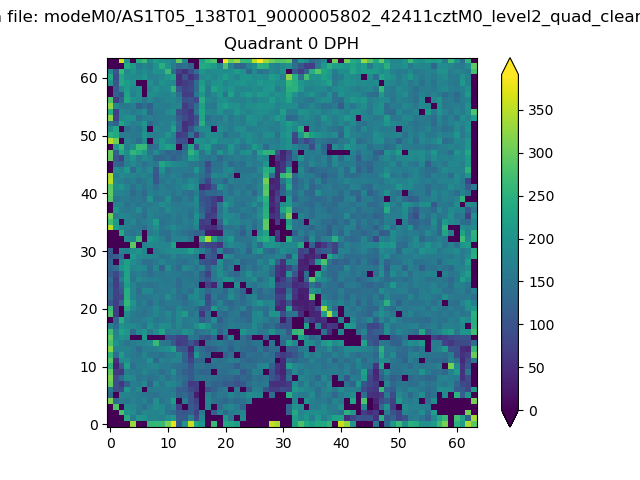 |
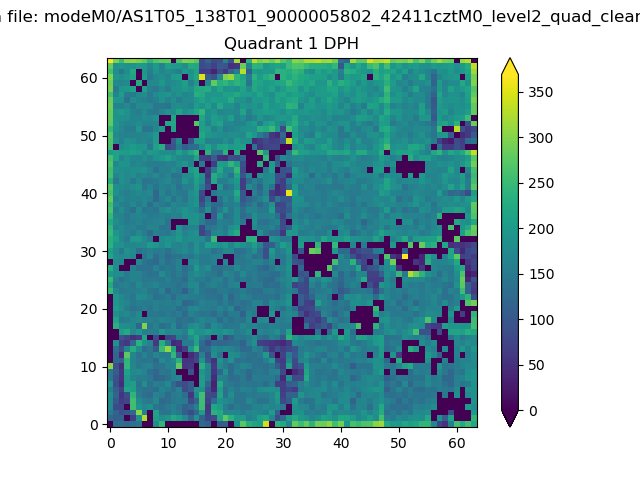 |
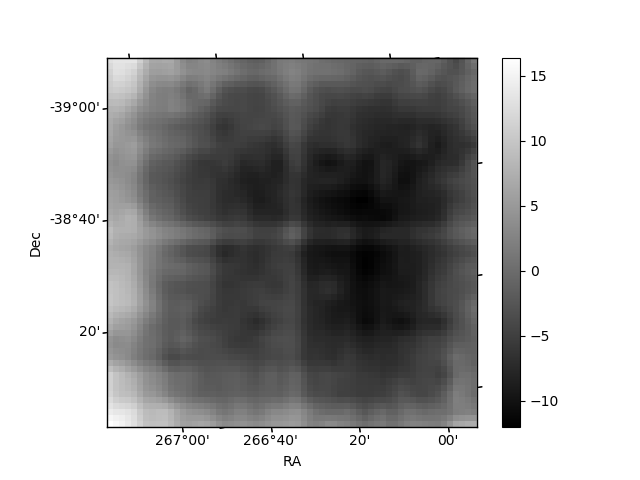
Quadrant B |
|---|---|---|---|
| Quadrant D | 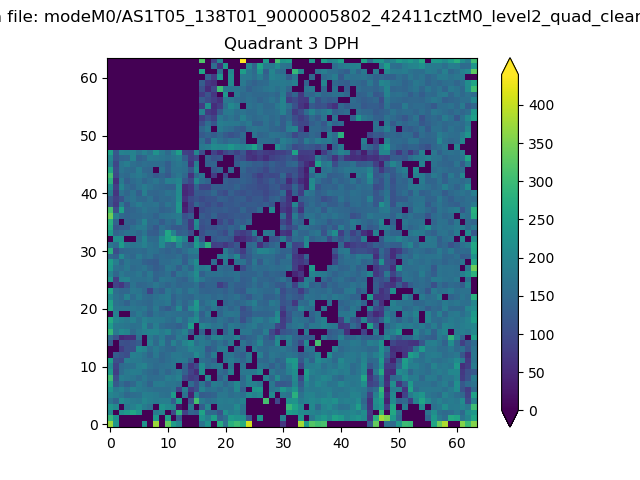 |
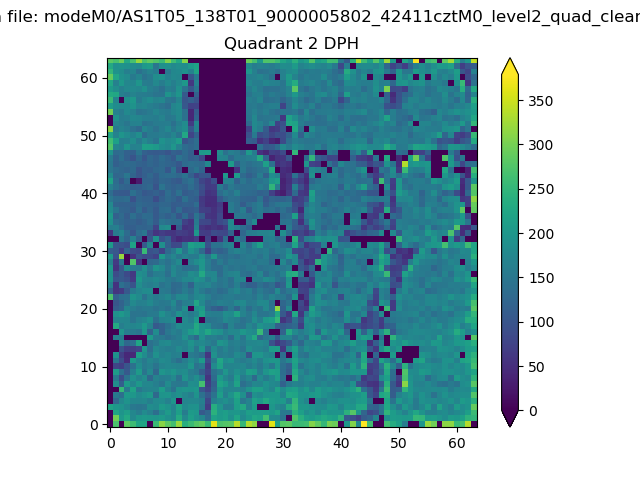 |
Quadrant C |
| Plot type | Count rate plots | Images |
|---|---|---|
| Comparison with Poisson distribution Blue bars denote a histogram of data divided into 1 sec bins. Red curve is a Poisson curve with rate = median count rate of data. |
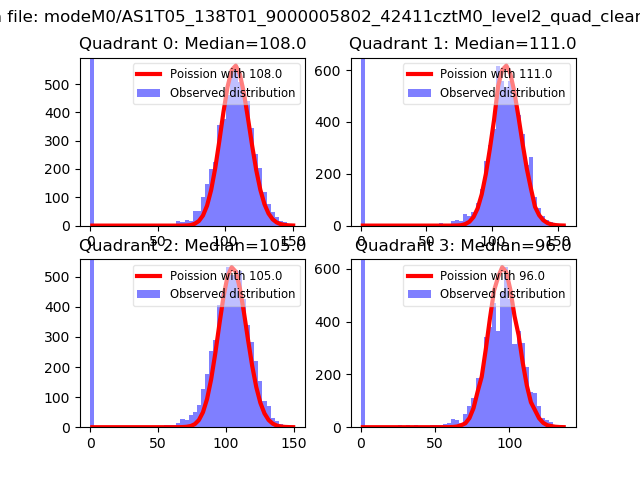 |
 |
| Quadrant-wise count rates Data is divided into 100 sec bins |
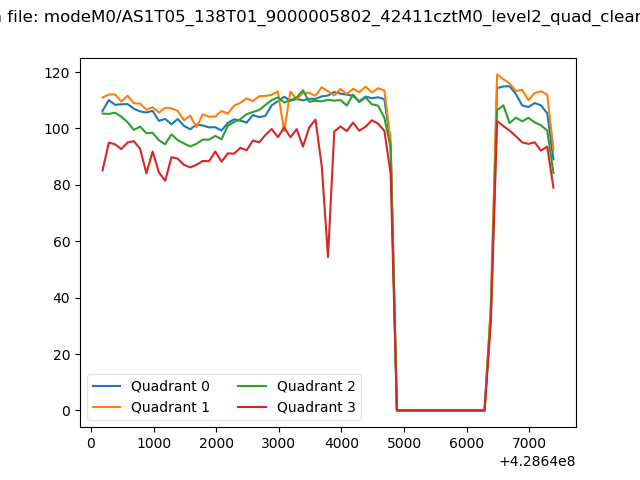 |
|
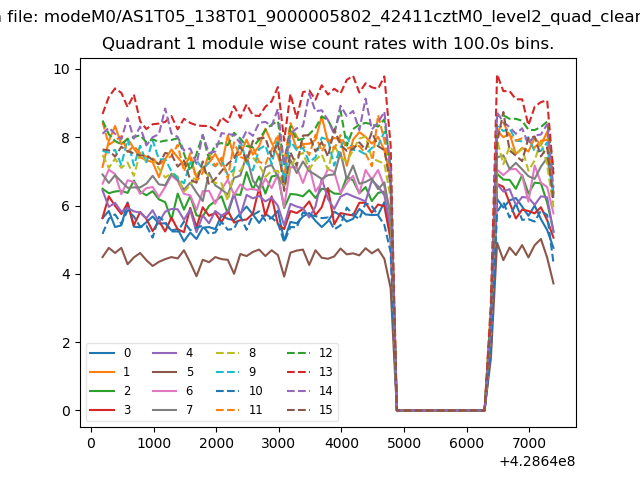
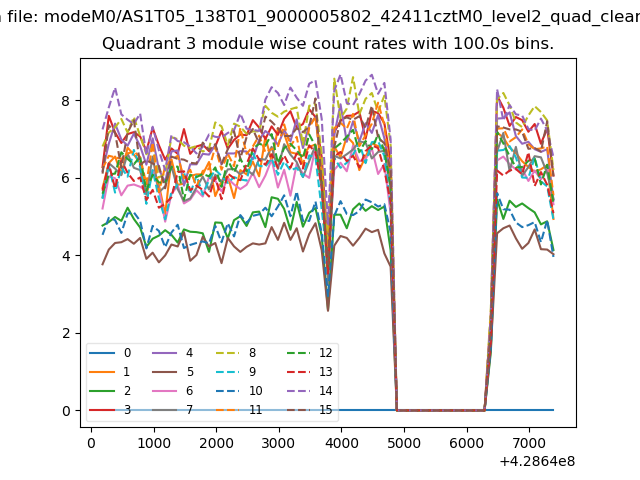
| Module-wise count rates for Quadrant A Data is divided into 100 sec bins |
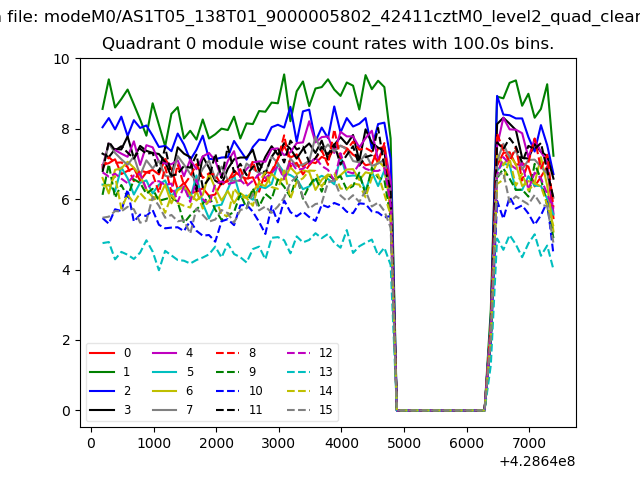 |
 |
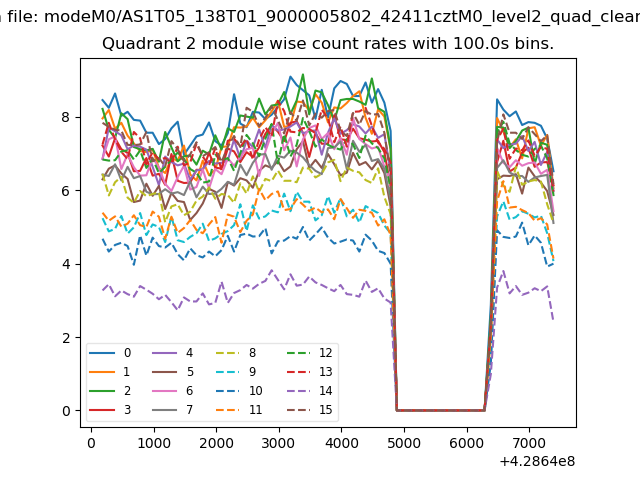
| Module-wise count rates for Quadrant B Data is divided into 100 sec bins |
 |
 |
| Module-wise count rates for Quadrant C Data is divided into 100 sec bins |
 |
 |
| Module-wise count rates for Quadrant D Data is divided into 100 sec bins |
 |
 |
| Parameter | Plot |
|---|---|
| CZT HV Monitor |  |
| D_VDD | 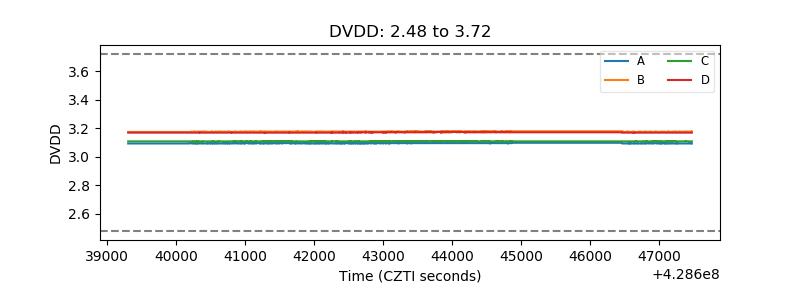 |
| Temperature 1 | 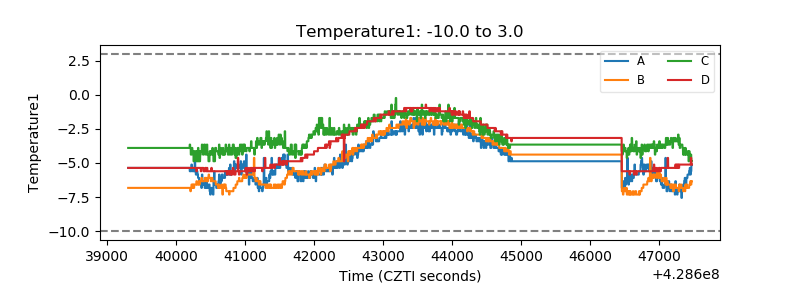 |
| Veto HV Monitor | 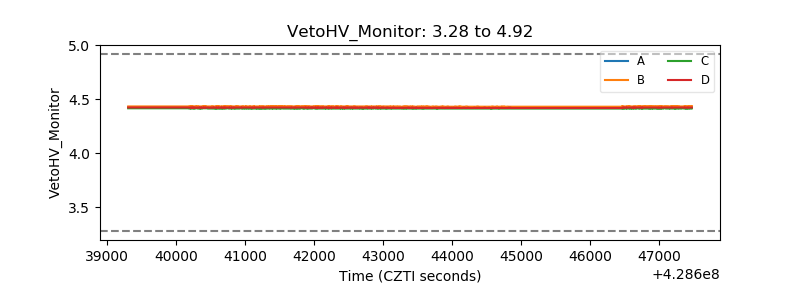 |
| Veto LLD | 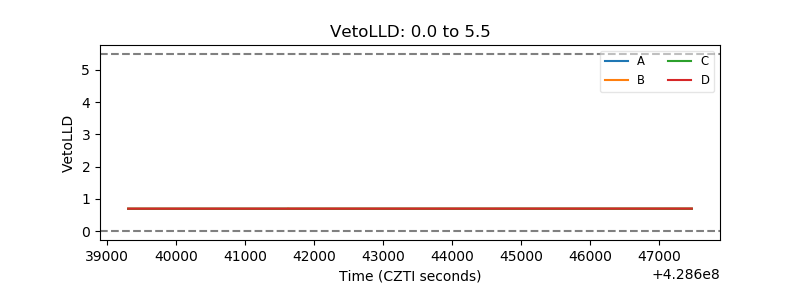 |
| Alpha Counter | 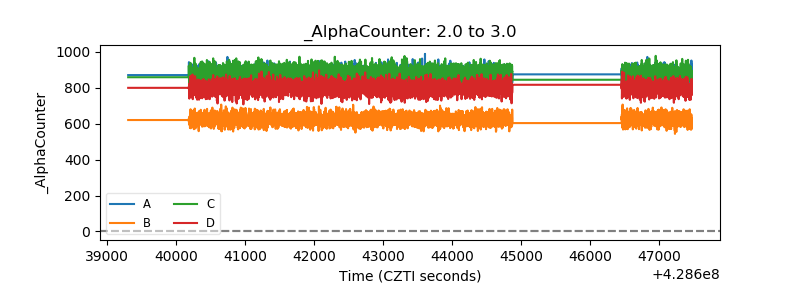 |
| _CPM_Rate | 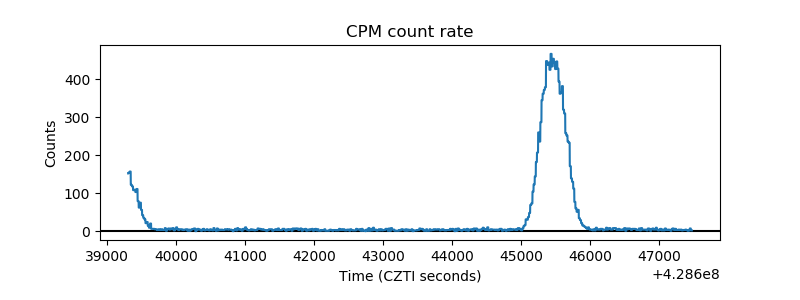 |
| CZT Counter | 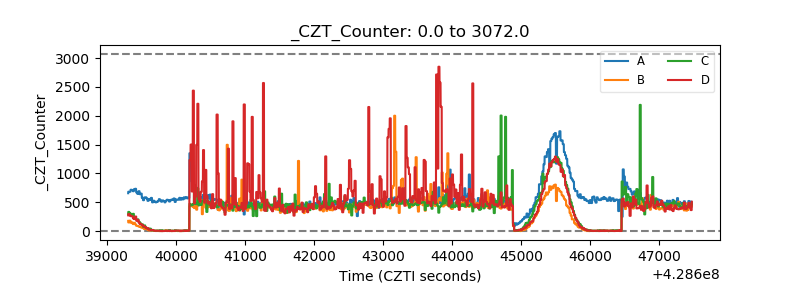 |
| +2.5 Volts monitor | 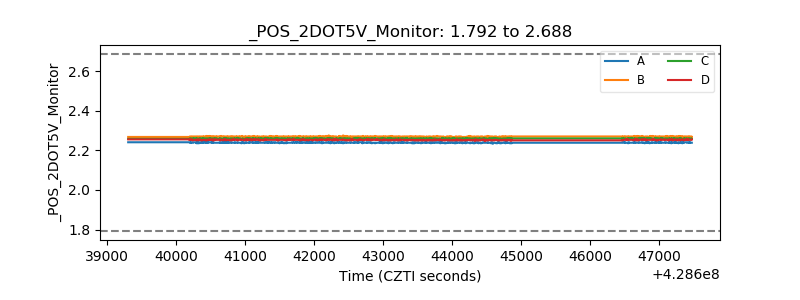 |
| +5 Volts monitor | 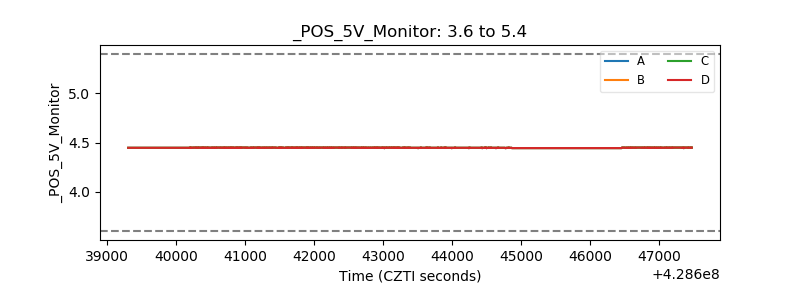 |
| _ROLL_ROT | 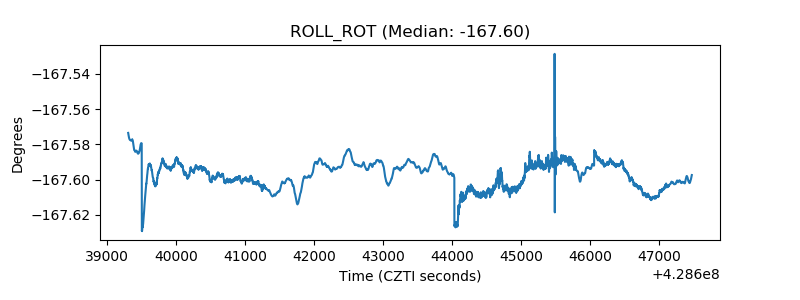 |
| _Roll_DEC | 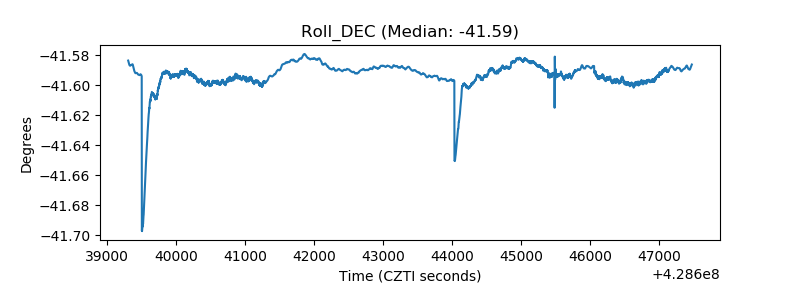 |
| _Roll_RA | 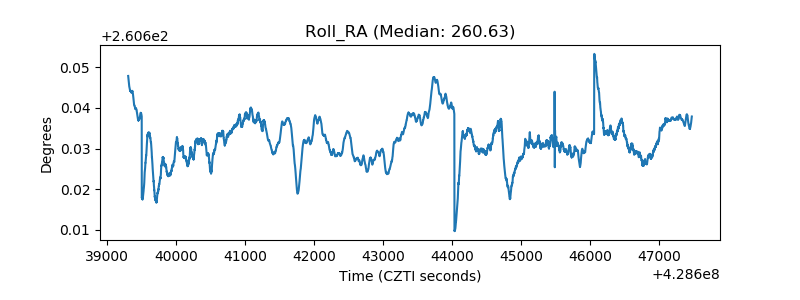 |
| Veto Counter | 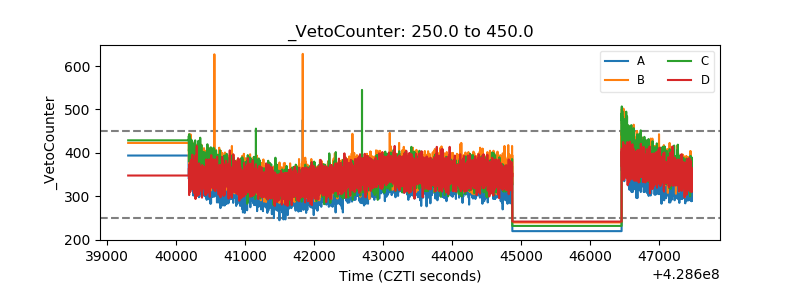 |