| Param | Original file | Final file |
|---|---|---|
| Filename | modeM0/AS1T05_138T01_9000005802_42413cztM0_level2.fits | modeM0/AS1T05_138T01_9000005802_42413cztM0_level2_quad_clean.evt |
| Size (bytes) | 318,841,920 | 86,837,760 |
| Size | 304.1 MB | 82.8 MB |
| Events in quadrant A | 2,795,995 | 581,002 |
| Events in quadrant B | 2,439,729 | 597,834 |
| Events in quadrant C | 2,518,778 | 568,833 |
| Events in quadrant D | 3,635,277 | 511,382 |
| Mode M9 | |||
|---|---|---|---|
| Quadrant | BADHDUFLAG | Total packets | Discarded packets |
| A | 0 | 21 | 0 |
| B | 0 | 22 | 0 |
| C | 0 | 22 | 0 |
| D | 0 | 22 | 0 |
| Mode M0 | |||
|---|---|---|---|
| Quadrant | BADHDUFLAG | Total packets | Discarded packets |
| A | 0 | 11396 | 2 |
| B | 0 | 10991 | 2 |
| C | 0 | 10891 | 2 |
| D | 0 | 14465 | 2 |
| Mode SS | |||
|---|---|---|---|
| Quadrant | BADHDUFLAG | Total packets | Discarded packets |
| A | 0 | 106 | 0 |
| B | 0 | 106 | 0 |
| C | 0 | 106 | 0 |
| D | 0 | 106 | 0 |
| Quadrant | Total seconds | Saturated seconds | Saturation percentage |
|---|---|---|---|
| A | 5295 | 8 | 0.151086% |
| B | 5295 | 31 | 0.585458% |
| C | 5295 | 13 | 0.245515% |
| D | 5295 | 217 | 4.098206% |
Noise dominated data is calculated using 1-second bins in cleaned event files. If a bin has >2000 counts, and if more than 50% of those come from <1% of pixels, then it is considered to be noise-dominated and hence unusable.
| Quadrant | # 1 sec bins | Bins with >0 counts | Bins with >2000 counts | High rate bins dominated by noise | Noise dominated (total time) | Noise dominated (detector-on time) | Marked lightcurve |
|---|---|---|---|---|---|---|---|
| A | 7027 | 5296 | 2 | 2 | 0.03% | 0.04% | 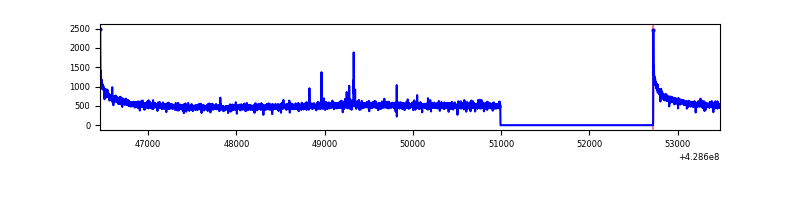 |
| B | 7027 | 5296 | 16 | 16 | 0.23% | 0.30% | 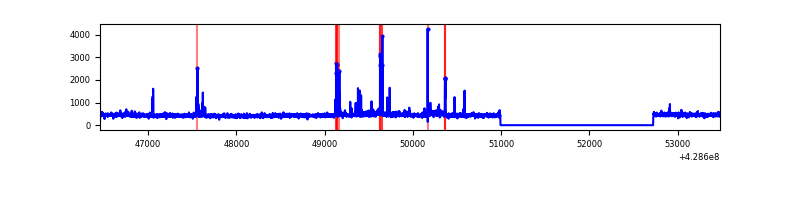 |
| C | 7027 | 5296 | 8 | 8 | 0.11% | 0.15% | 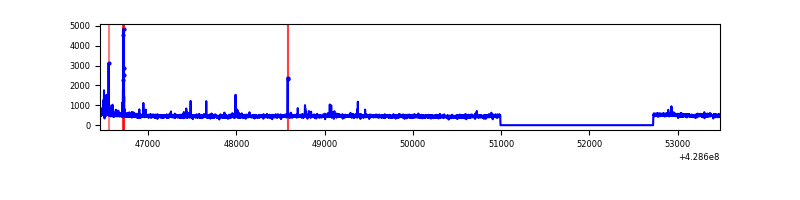 |
| D | 7027 | 5296 | 250 | 250 | 3.56% | 4.72% | 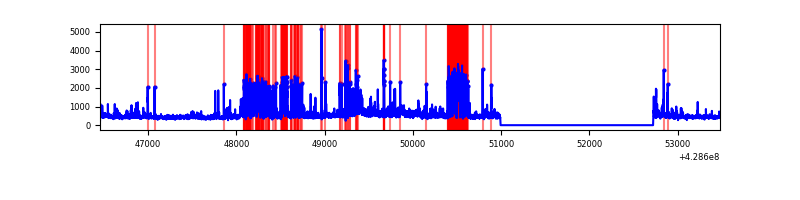 |
Top three noisy pixels from each quadrant. If the there are fewer than three noisy pixels in the level2.evt file, extra rows are filled as -1
| Pixel properties | Quadrant properties | ||||||
|---|---|---|---|---|---|---|---|
| Quadrant | DetID | PixID | Counts | Sigma | Mean | Median | Sigma |
| A | 10 | 83 | 543868 | 4554.86 | 577 | 564 | 119.3 |
| A | 13 | 248 | 9274 | 73.02 | 577 | 564 | 119.3 |
| A | 13 | 254 | 8058 | 62.82 | 577 | 564 | 119.3 |
| B | 3 | 112 | 54864 | 488.62 | 573 | 556 | 111.1 |
| B | 0 | 186 | 45022 | 400.07 | 573 | 556 | 111.1 |
| B | 5 | 172 | 27756 | 244.73 | 573 | 556 | 111.1 |
| C | 15 | 214 | 222055 | 1700.31 | 562 | 564 | 130.3 |
| C | 14 | 254 | 65466 | 498.23 | 562 | 564 | 130.3 |
| C | 4 | 254 | 32016 | 241.45 | 562 | 564 | 130.3 |
| D | 2 | 16 | 850782 | 6228.35 | 557 | 541 | 136.5 |
| D | 1 | 52 | 188618 | 1377.74 | 557 | 541 | 136.5 |
| D | 12 | 33 | 144723 | 1056.19 | 557 | 541 | 136.5 |
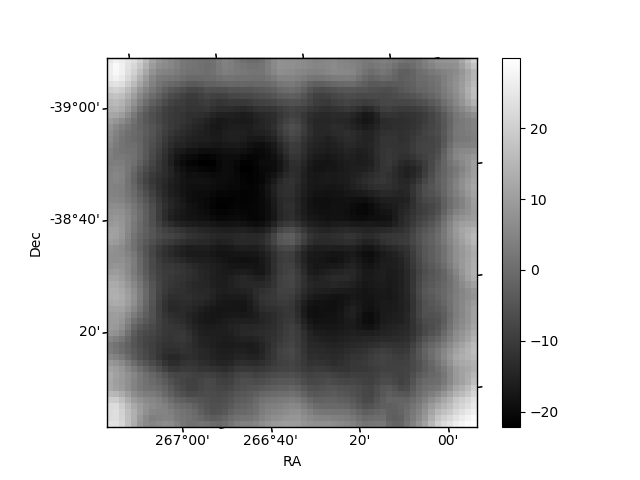
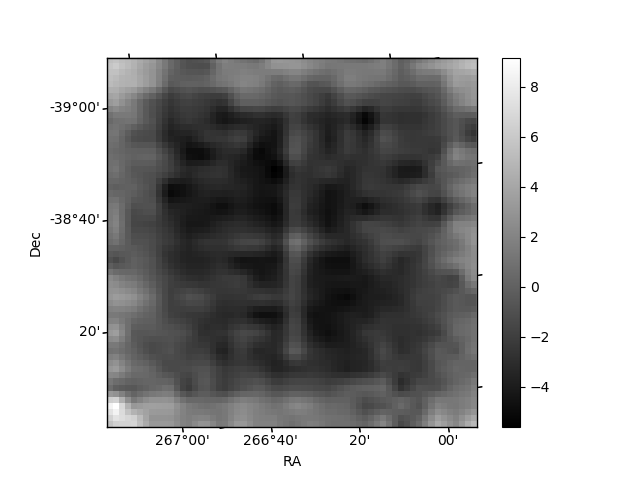
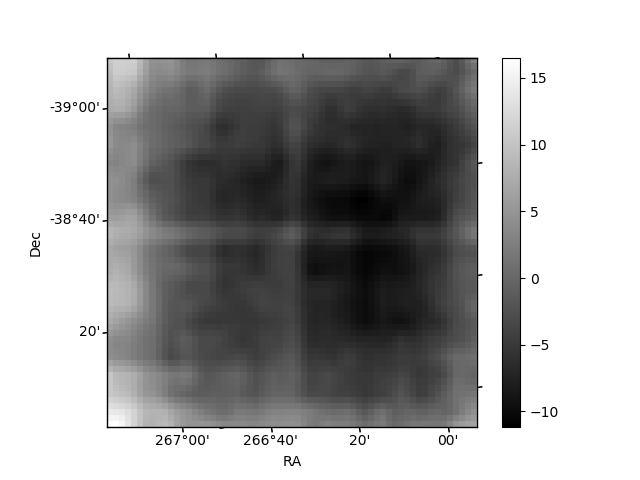
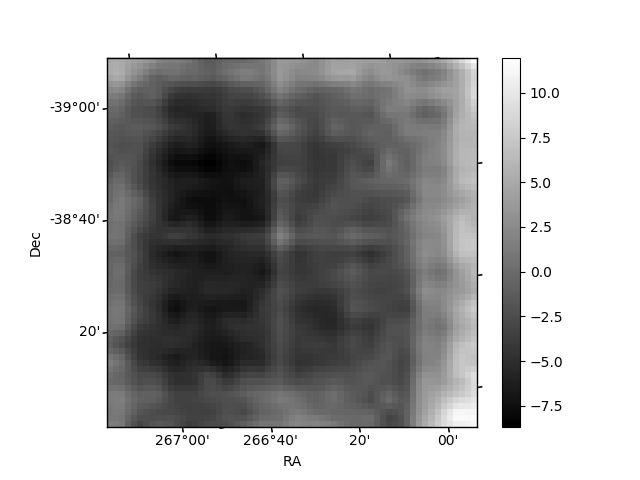
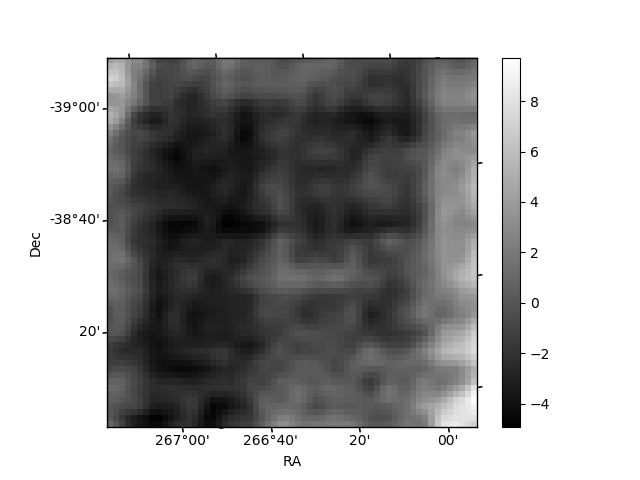
Histogram calculated using DETX and DETY for each event in the final _common_clean file
| Quadrant A | 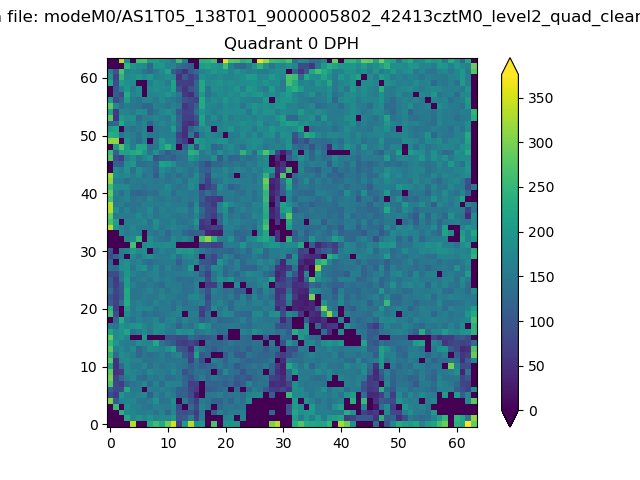 |
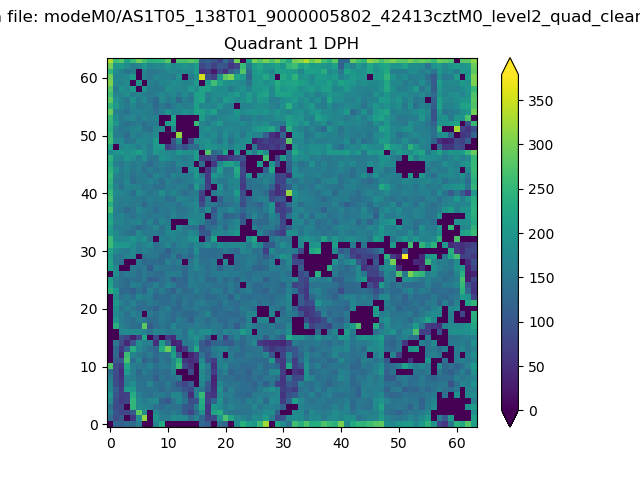 |
Quadrant B |
|---|---|---|---|
| Quadrant D | 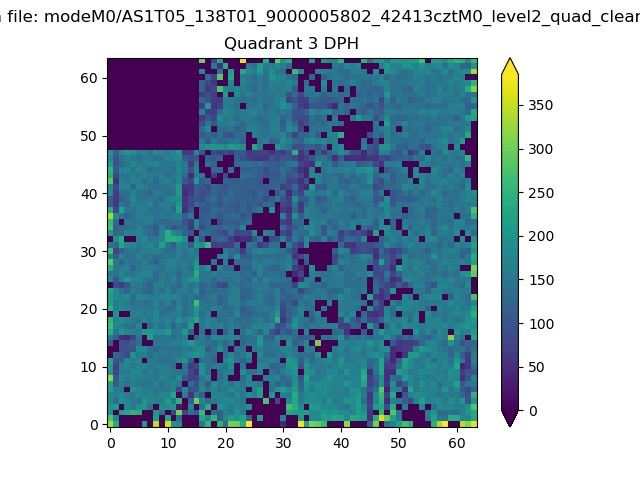 |
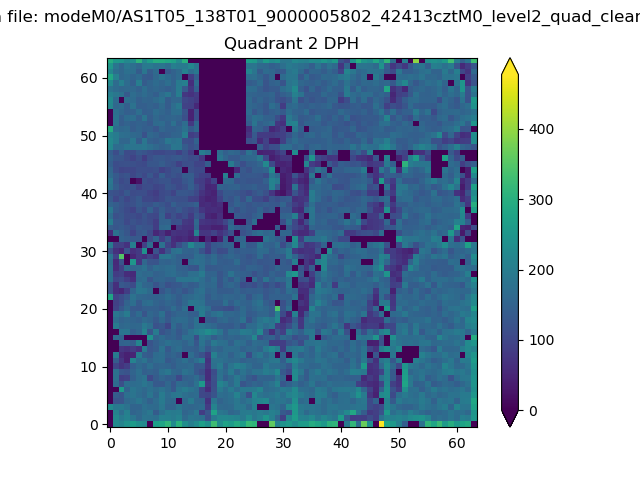 |
Quadrant C |
| Plot type | Count rate plots | Images |
|---|---|---|
| Comparison with Poisson distribution Blue bars denote a histogram of data divided into 1 sec bins. Red curve is a Poisson curve with rate = median count rate of data. |
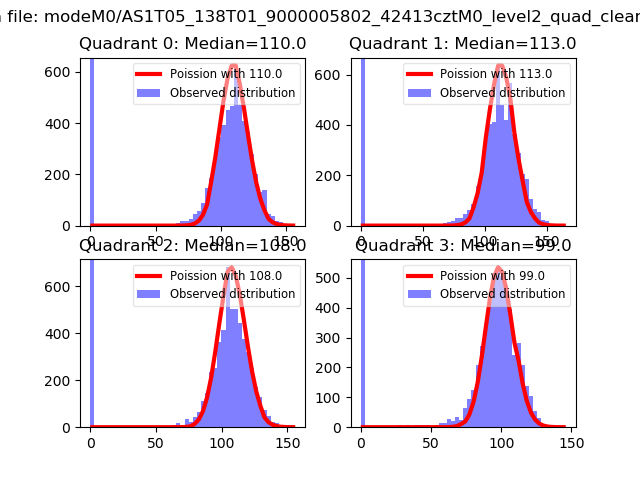 |
 |
| Quadrant-wise count rates Data is divided into 100 sec bins |
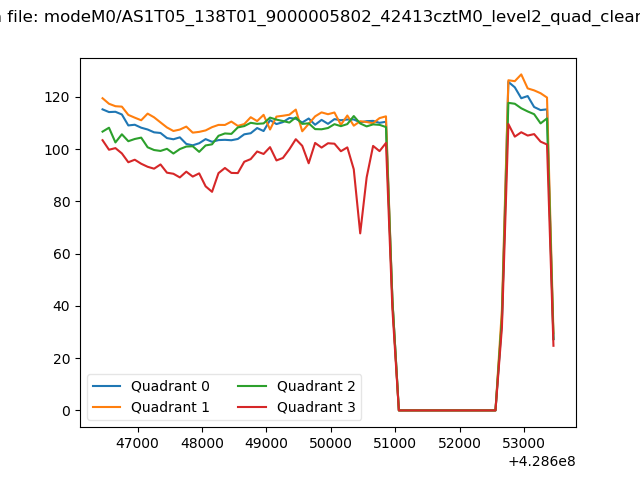 |
|
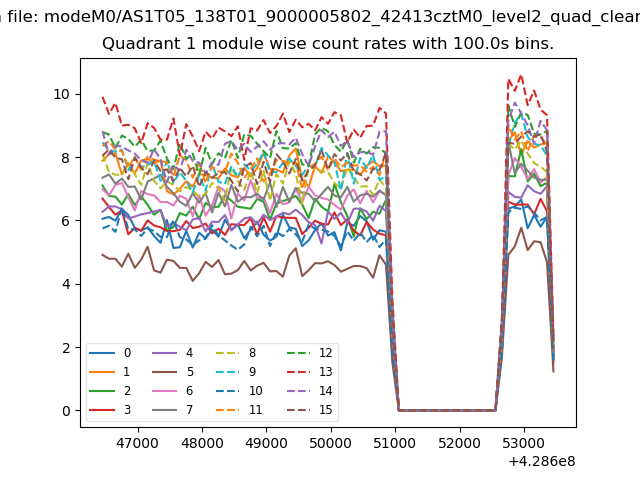
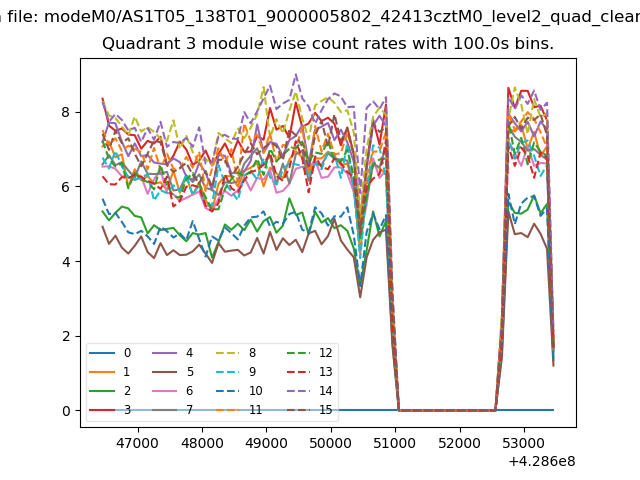
| Module-wise count rates for Quadrant A Data is divided into 100 sec bins |
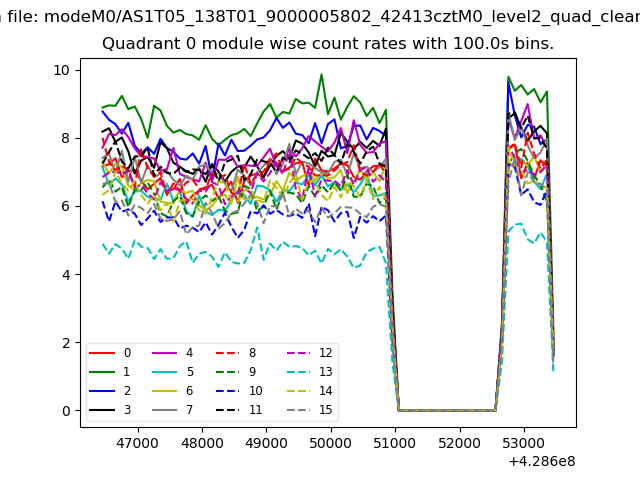 |
 |
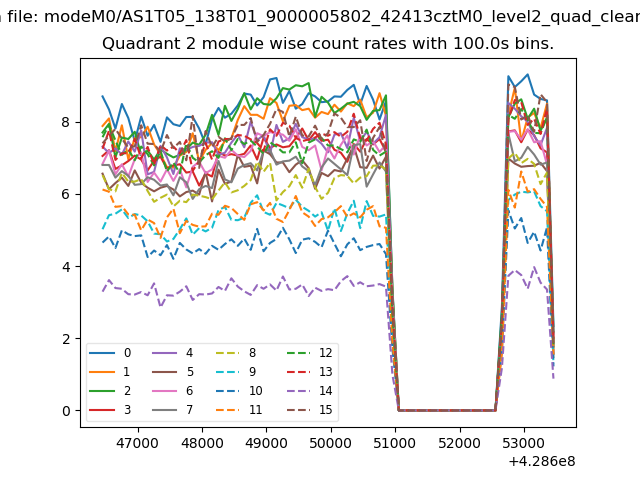
| Module-wise count rates for Quadrant B Data is divided into 100 sec bins |
 |
 |
| Module-wise count rates for Quadrant C Data is divided into 100 sec bins |
 |
 |
| Module-wise count rates for Quadrant D Data is divided into 100 sec bins |
 |
 |
| Parameter | Plot |
|---|---|
| CZT HV Monitor | 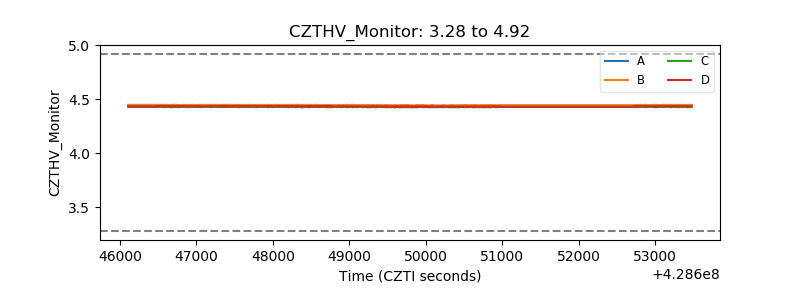 |
| D_VDD | 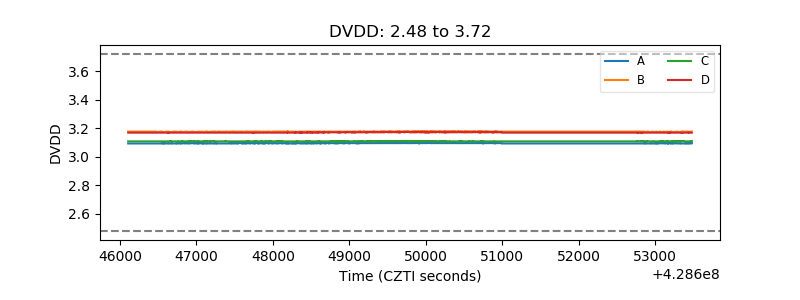 |
| Temperature 1 | 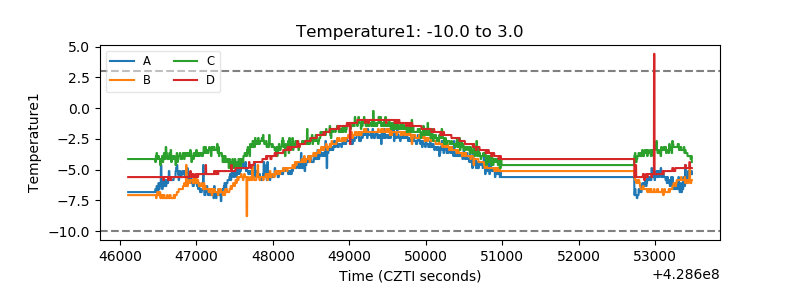 |
| Veto HV Monitor | 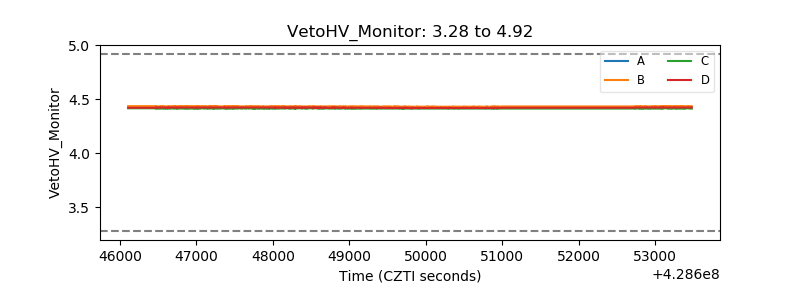 |
| Veto LLD | 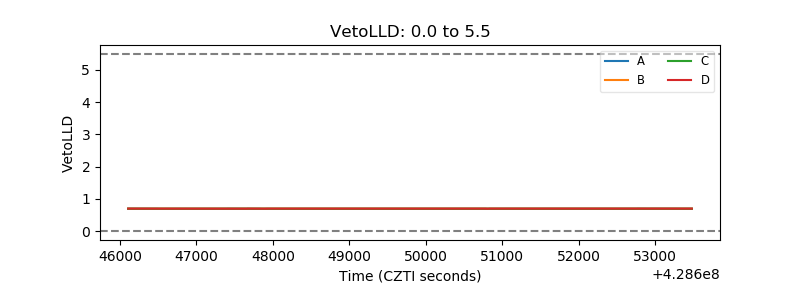 |
| Alpha Counter | 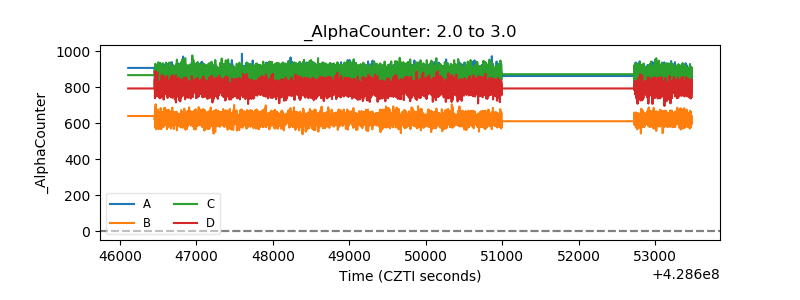 |
| _CPM_Rate | 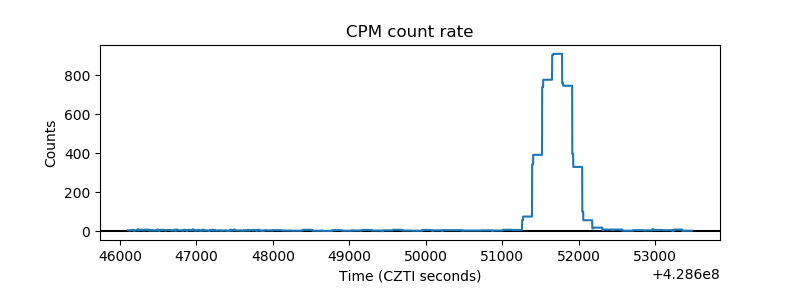 |
| CZT Counter | 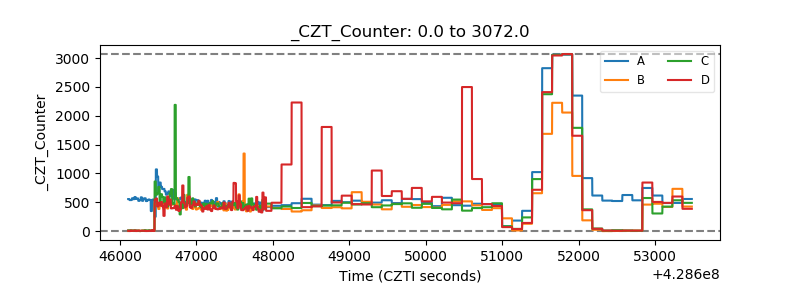 |
| +2.5 Volts monitor | 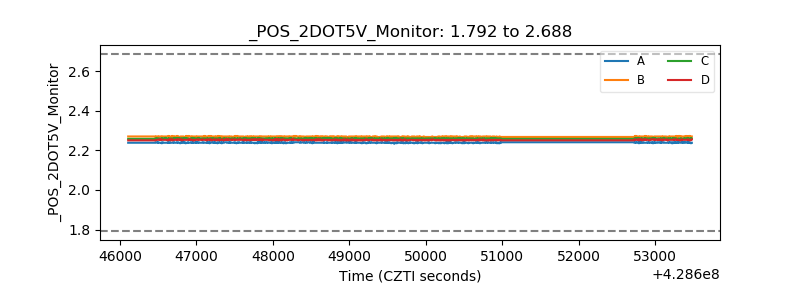 |
| +5 Volts monitor | 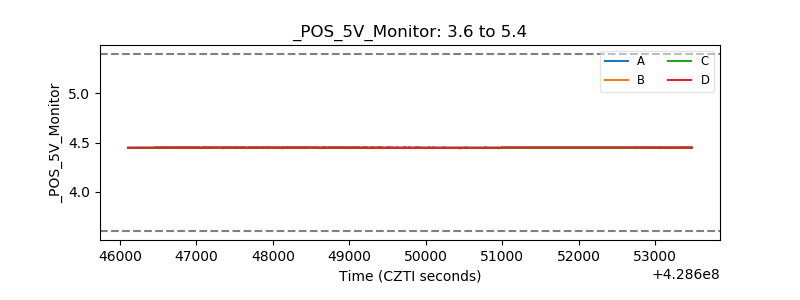 |
| _ROLL_ROT | 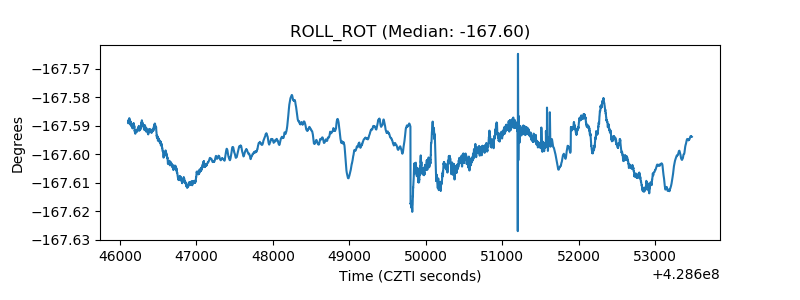 |
| _Roll_DEC | 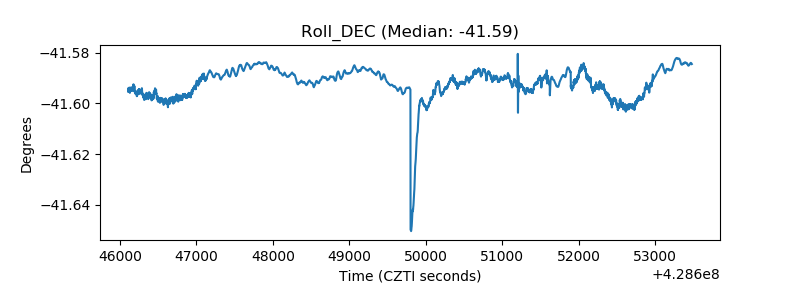 |
| _Roll_RA | 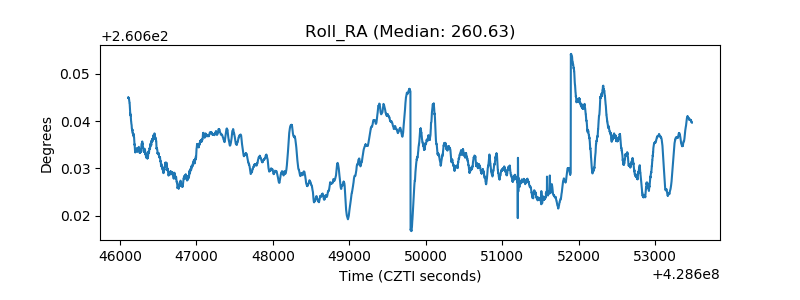 |
| Veto Counter | 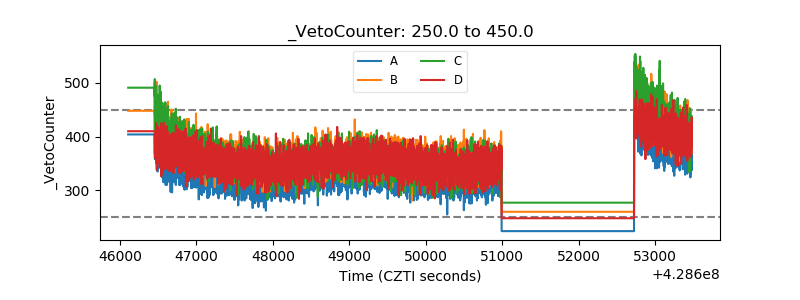 |