| Param | Original file | Final file |
|---|---|---|
| Filename | modeM0/AS1T05_138T01_9000005802_42414cztM0_level2.fits | modeM0/AS1T05_138T01_9000005802_42414cztM0_level2_quad_clean.evt |
| Size (bytes) | 320,682,240 | 93,507,840 |
| Size | 305.8 MB | 89.2 MB |
| Events in quadrant A | 2,987,749 | 627,854 |
| Events in quadrant B | 2,520,835 | 647,487 |
| Events in quadrant C | 2,593,313 | 618,629 |
| Events in quadrant D | 3,343,048 | 555,551 |
| Mode M9 | |||
|---|---|---|---|
| Quadrant | BADHDUFLAG | Total packets | Discarded packets |
| A | 0 | 36 | 0 |
| B | 0 | 36 | 0 |
| C | 0 | 36 | 0 |
| D | 0 | 36 | 0 |
| Mode M0 | |||
|---|---|---|---|
| Quadrant | BADHDUFLAG | Total packets | Discarded packets |
| A | 0 | 12013 | 2 |
| B | 0 | 11210 | 2 |
| C | 0 | 11099 | 2 |
| D | 0 | 13625 | 2 |
| Mode SS | |||
|---|---|---|---|
| Quadrant | BADHDUFLAG | Total packets | Discarded packets |
| A | 0 | 112 | 0 |
| B | 0 | 112 | 0 |
| C | 0 | 112 | 0 |
| D | 0 | 112 | 0 |
| Quadrant | Total seconds | Saturated seconds | Saturation percentage |
|---|---|---|---|
| A | 5460 | 12 | 0.219780% |
| B | 5460 | 15 | 0.274725% |
| C | 5460 | 5 | 0.091575% |
| D | 5461 | 143 | 2.618568% |
Noise dominated data is calculated using 1-second bins in cleaned event files. If a bin has >2000 counts, and if more than 50% of those come from <1% of pixels, then it is considered to be noise-dominated and hence unusable.
| Quadrant | # 1 sec bins | Bins with >0 counts | Bins with >2000 counts | High rate bins dominated by noise | Noise dominated (total time) | Noise dominated (detector-on time) | Marked lightcurve |
|---|---|---|---|---|---|---|---|
| A | 9074 | 5462 | 4 | 4 | 0.04% | 0.07% | 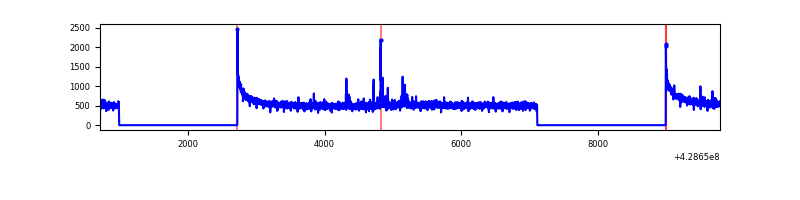 |
| B | 9074 | 5462 | 7 | 7 | 0.08% | 0.13% | 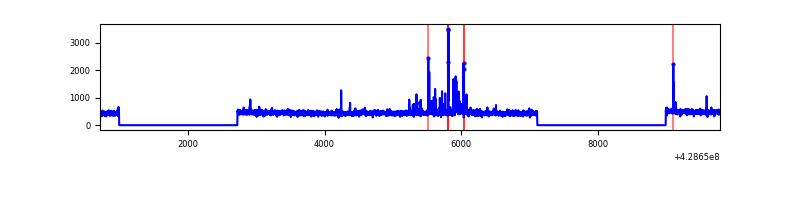 |
| C | 9074 | 5462 | 0 | 0 | 0.00% | 0.00% | 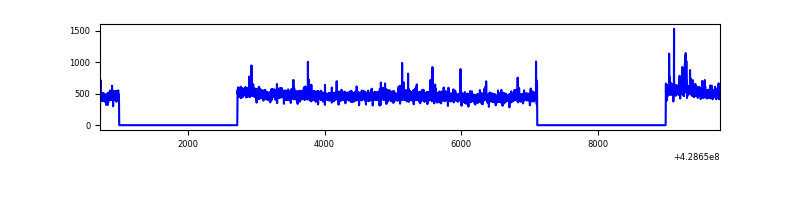 |
| D | 9075 | 5463 | 124 | 124 | 1.37% | 2.27% | 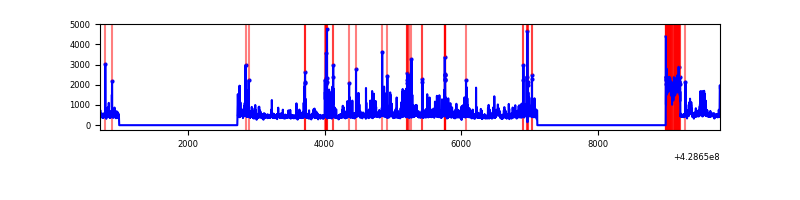 |
Top three noisy pixels from each quadrant. If the there are fewer than three noisy pixels in the level2.evt file, extra rows are filled as -1
| Pixel properties | Quadrant properties | ||||||
|---|---|---|---|---|---|---|---|
| Quadrant | DetID | PixID | Counts | Sigma | Mean | Median | Sigma |
| A | 10 | 83 | 573565 | 4530.76 | 613 | 599 | 126.5 |
| A | 13 | 248 | 28014 | 216.79 | 613 | 599 | 126.5 |
| A | 13 | 6 | 10875 | 81.26 | 613 | 599 | 126.5 |
| B | 3 | 112 | 49252 | 421.52 | 607 | 591 | 115.4 |
| B | 15 | 85 | 24045 | 203.17 | 607 | 591 | 115.4 |
| B | 5 | 252 | 20481 | 172.3 | 607 | 591 | 115.4 |
| C | 15 | 214 | 229648 | 1656.61 | 596 | 599 | 138.3 |
| C | 0 | 207 | 14535 | 100.79 | 596 | 599 | 138.3 |
| C | 4 | 254 | 7168 | 47.51 | 596 | 599 | 138.3 |
| D | 2 | 16 | 371658 | 2538.03 | 592 | 575 | 146.2 |
| D | 1 | 52 | 287911 | 1965.24 | 592 | 575 | 146.2 |
| D | 12 | 6 | 103763 | 705.76 | 592 | 575 | 146.2 |
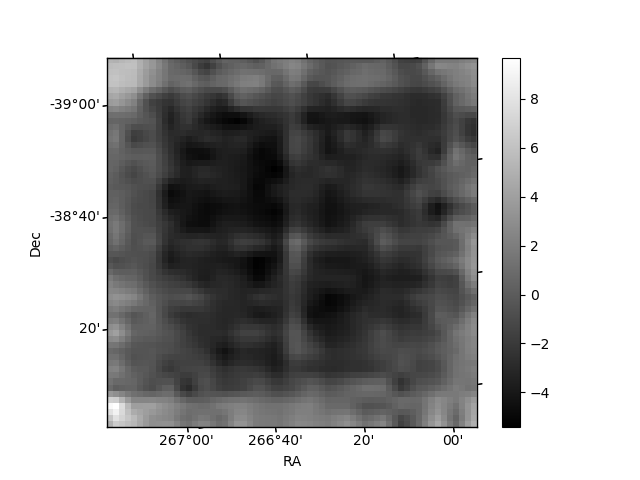
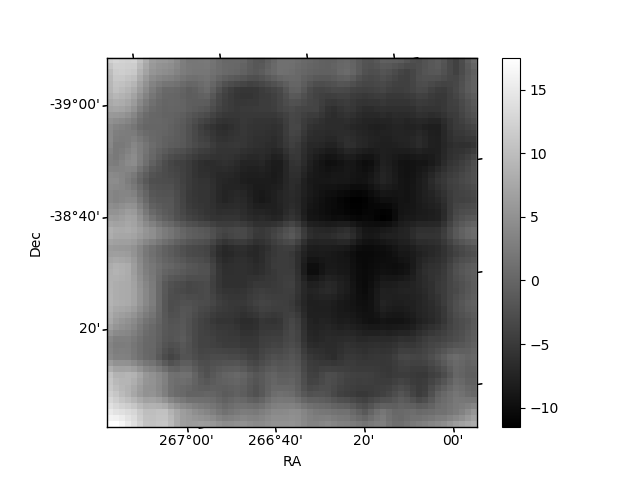
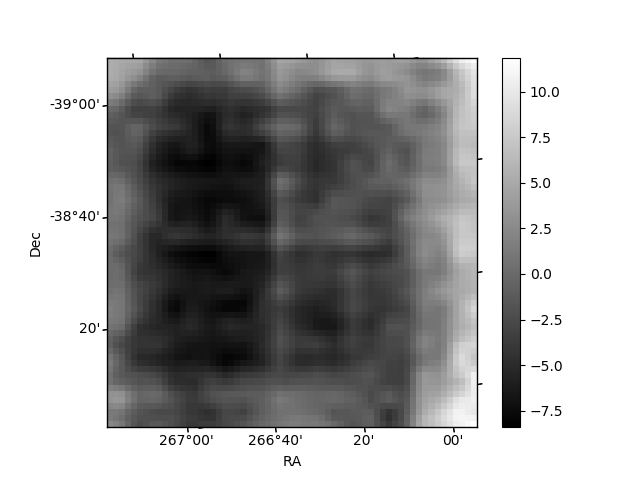
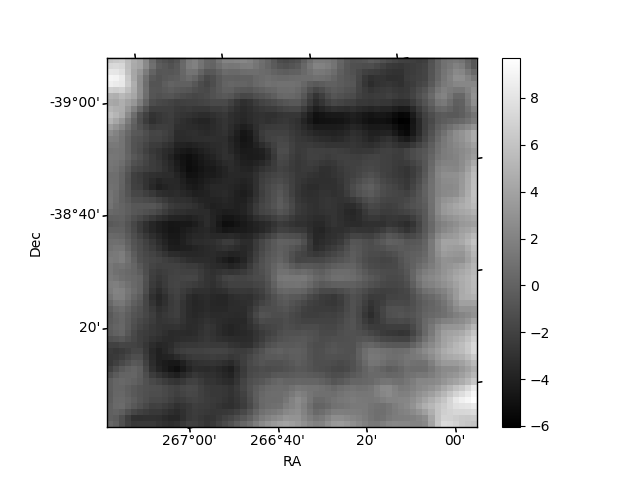
Histogram calculated using DETX and DETY for each event in the final _common_clean file
| Quadrant A | 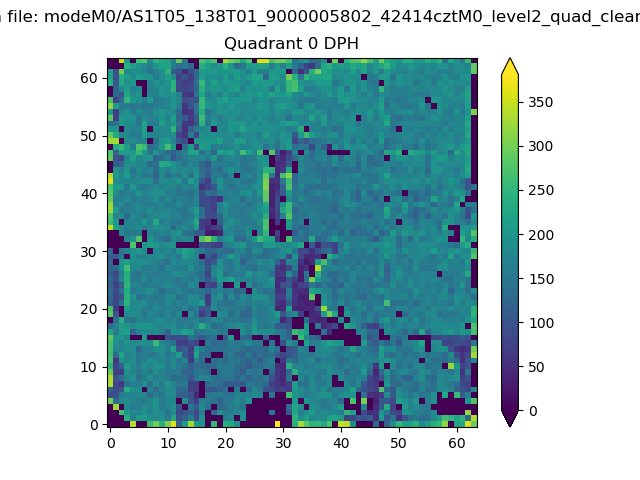 |
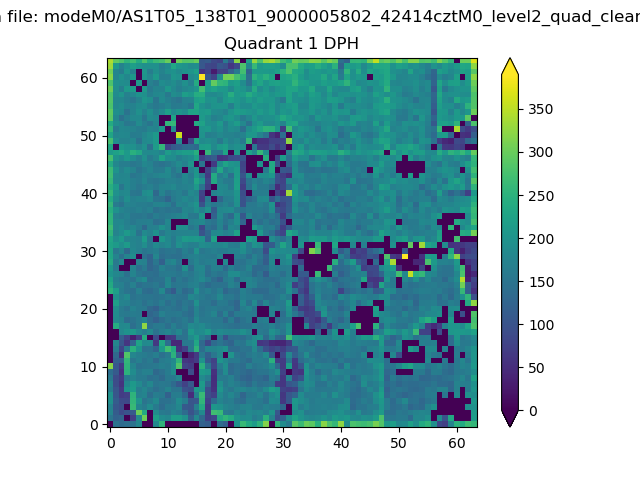 |
Quadrant B |
|---|---|---|---|
| Quadrant D | 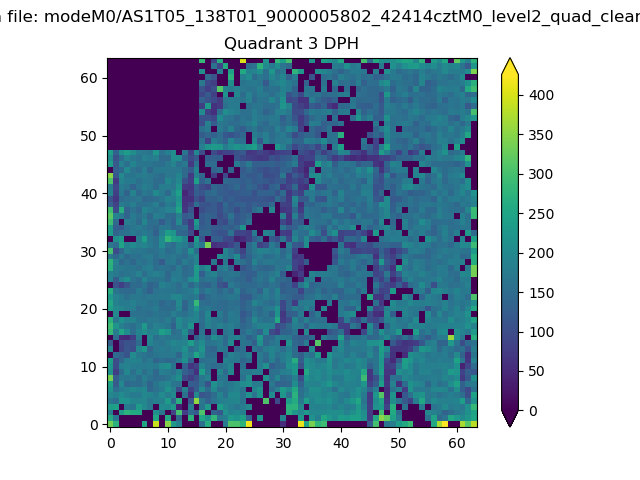 |
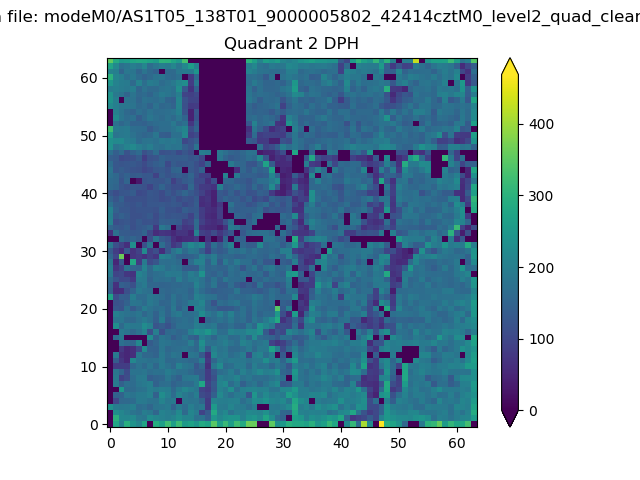 |
Quadrant C |
| Plot type | Count rate plots | Images |
|---|---|---|
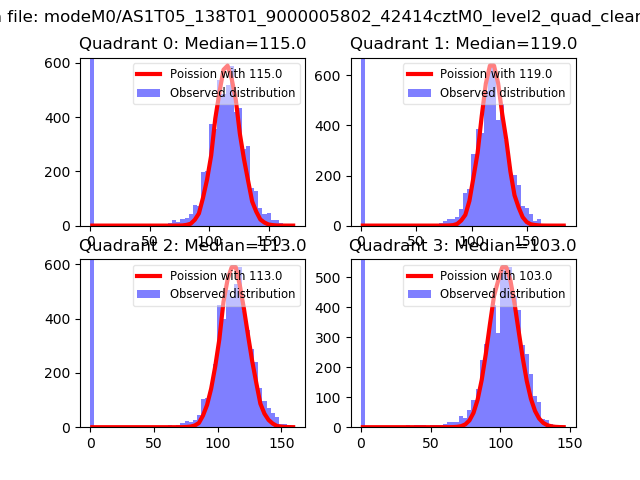
| Comparison with Poisson distribution Blue bars denote a histogram of data divided into 1 sec bins. Red curve is a Poisson curve with rate = median count rate of data. |
 |
 |
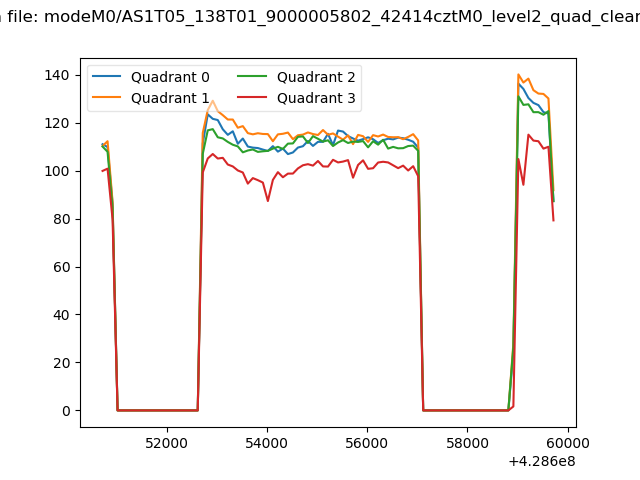
| Quadrant-wise count rates Data is divided into 100 sec bins |
 |
|
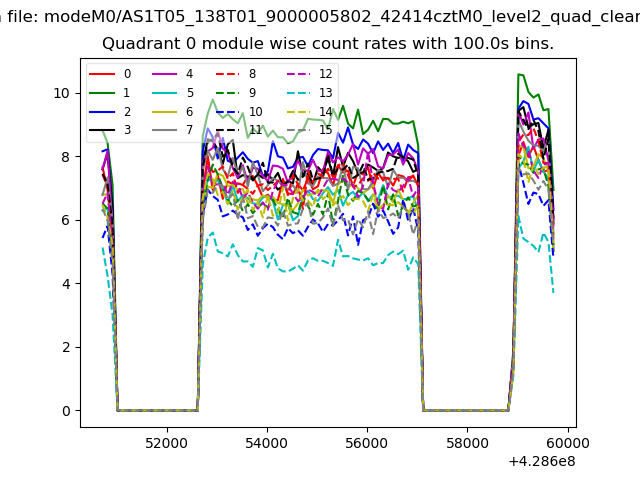
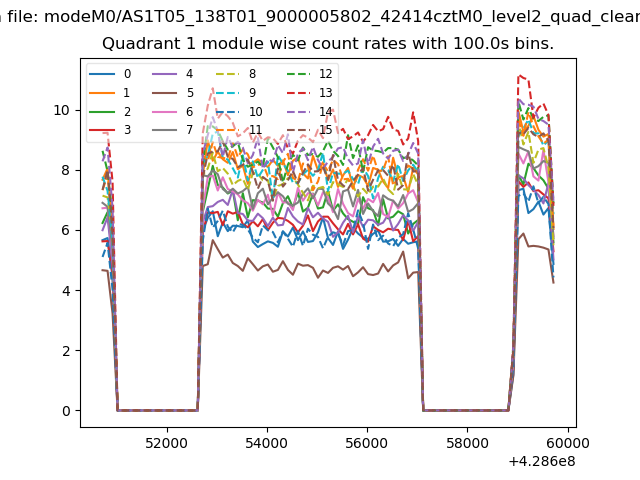
| Module-wise count rates for Quadrant A Data is divided into 100 sec bins |
 |
 |
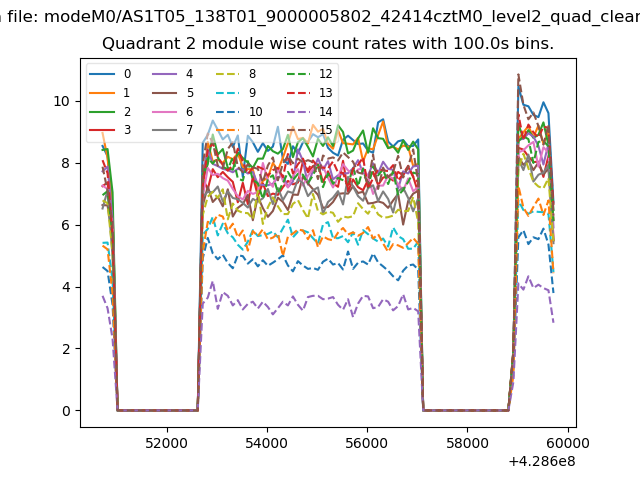
| Module-wise count rates for Quadrant B Data is divided into 100 sec bins |
 |
 |
| Module-wise count rates for Quadrant C Data is divided into 100 sec bins |
 |
 |
| Module-wise count rates for Quadrant D Data is divided into 100 sec bins |
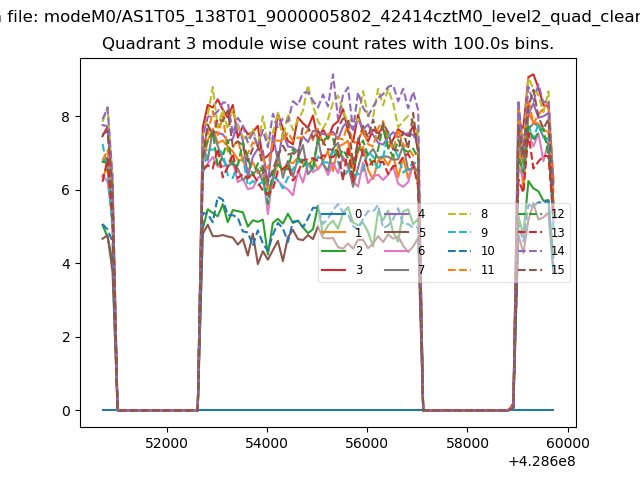 |
 |
| Parameter | Plot |
|---|---|
| CZT HV Monitor | 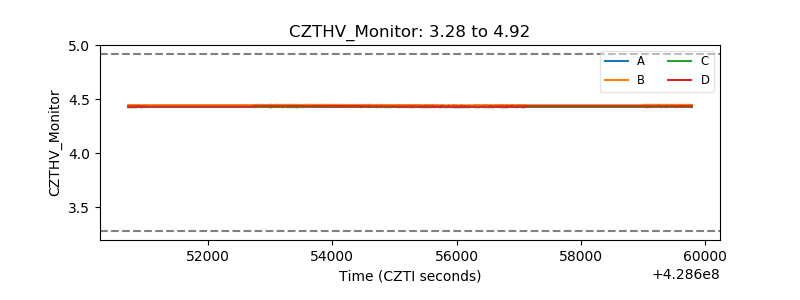 |
| D_VDD | 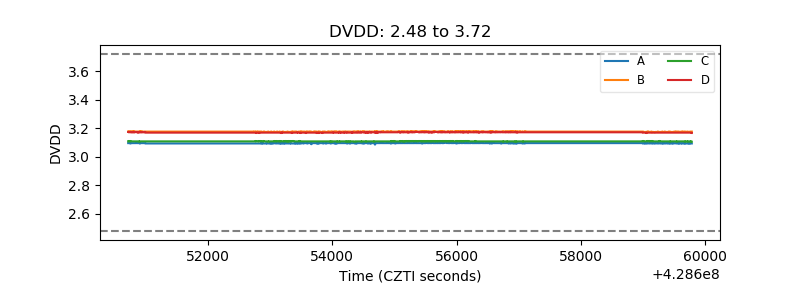 |
| Temperature 1 | 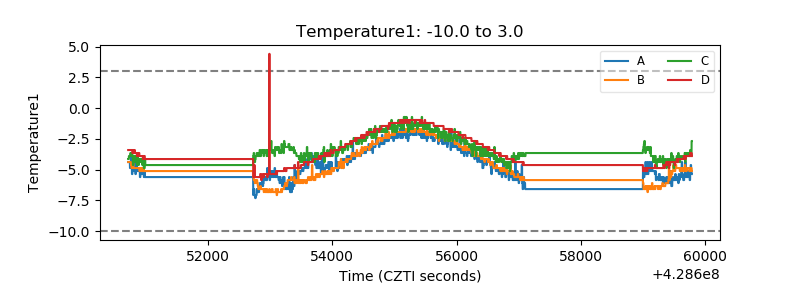 |
| Veto HV Monitor |  |
| Veto LLD | 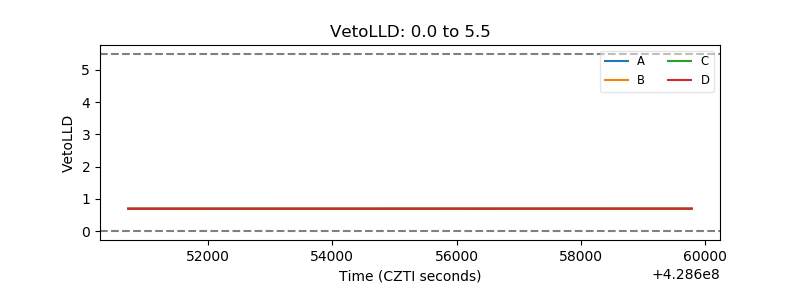 |
| Alpha Counter | 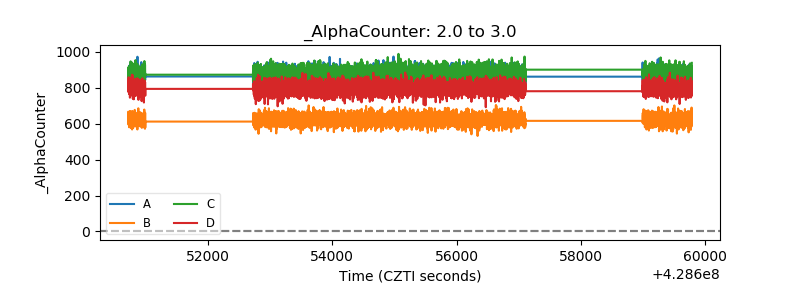 |
| _CPM_Rate | 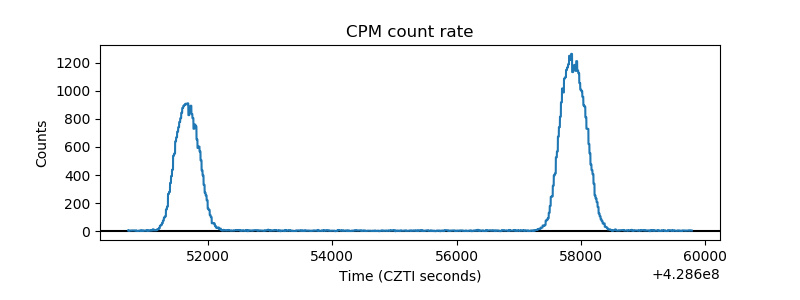 |
| CZT Counter | 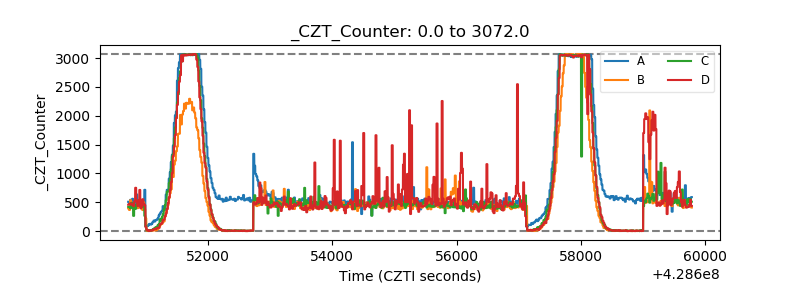 |
| +2.5 Volts monitor | 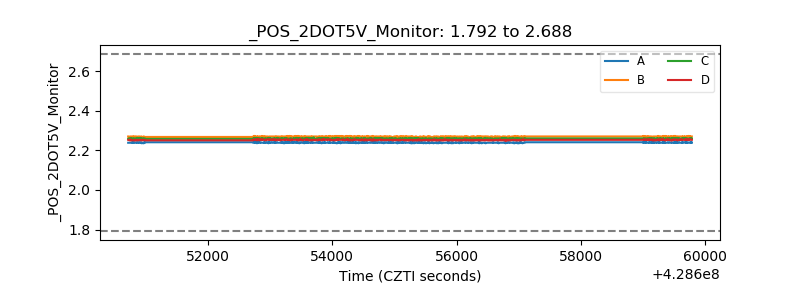 |
| +5 Volts monitor | 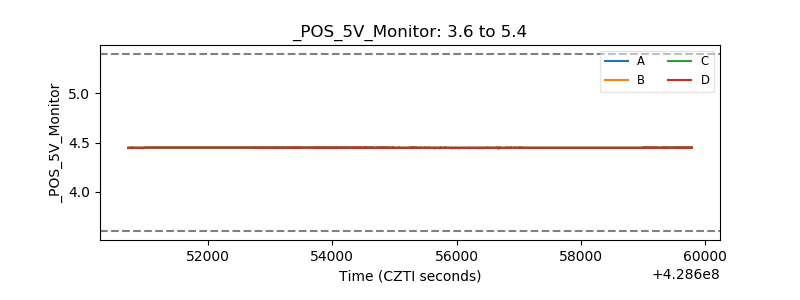 |
| _ROLL_ROT | 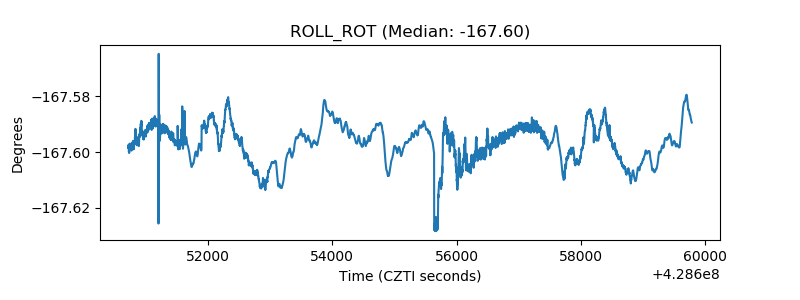 |
| _Roll_DEC | 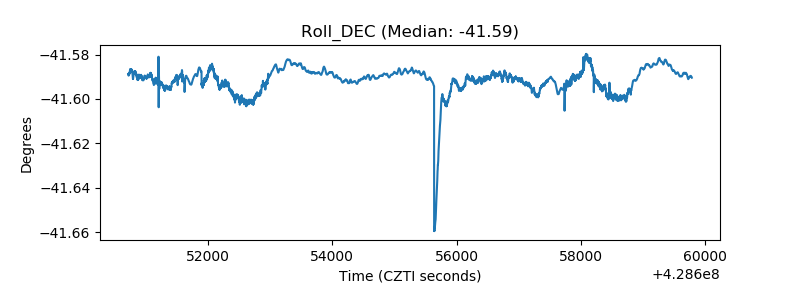 |
| _Roll_RA | 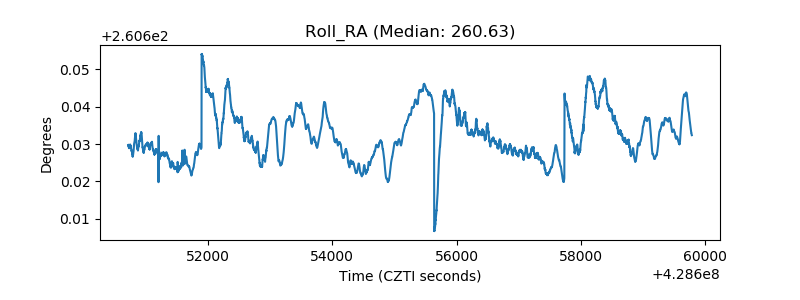 |
| Veto Counter | 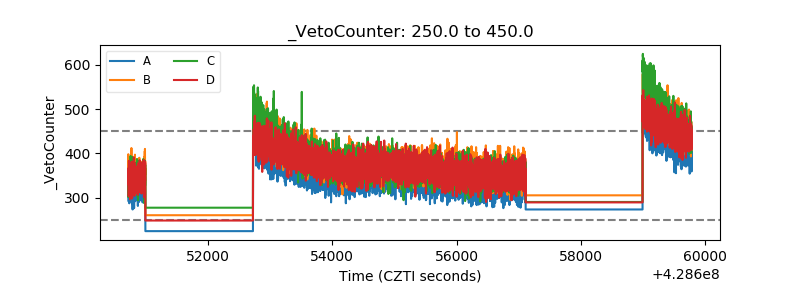 |