| Param | Original file | Final file |
|---|---|---|
| Filename | modeM0/AS1T05_138T01_9000005802_42415cztM0_level2.fits | modeM0/AS1T05_138T01_9000005802_42415cztM0_level2_quad_clean.evt |
| Size (bytes) | 325,365,120 | 91,656,000 |
| Size | 310.3 MB | 87.4 MB |
| Events in quadrant A | 2,859,861 | 621,667 |
| Events in quadrant B | 2,464,132 | 641,036 |
| Events in quadrant C | 2,532,835 | 614,066 |
| Events in quadrant D | 3,790,033 | 541,589 |
| Mode M9 | |||
|---|---|---|---|
| Quadrant | BADHDUFLAG | Total packets | Discarded packets |
| A | 0 | 36 | 0 |
| B | 0 | 36 | 0 |
| C | 0 | 37 | 0 |
| D | 0 | 37 | 0 |
| Mode M0 | |||
|---|---|---|---|
| Quadrant | BADHDUFLAG | Total packets | Discarded packets |
| A | 0 | 11484 | 2 |
| B | 0 | 10551 | 2 |
| C | 0 | 10567 | 2 |
| D | 0 | 14663 | 2 |
| Mode SS | |||
|---|---|---|---|
| Quadrant | BADHDUFLAG | Total packets | Discarded packets |
| A | 0 | 104 | 0 |
| B | 0 | 104 | 0 |
| C | 0 | 104 | 0 |
| D | 0 | 104 | 0 |
| Quadrant | Total seconds | Saturated seconds | Saturation percentage |
|---|---|---|---|
| A | 5097 | 11 | 0.215813% |
| B | 5097 | 17 | 0.333530% |
| C | 5097 | 4 | 0.078478% |
| D | 5097 | 279 | 5.473808% |
Noise dominated data is calculated using 1-second bins in cleaned event files. If a bin has >2000 counts, and if more than 50% of those come from <1% of pixels, then it is considered to be noise-dominated and hence unusable.
| Quadrant | # 1 sec bins | Bins with >0 counts | Bins with >2000 counts | High rate bins dominated by noise | Noise dominated (total time) | Noise dominated (detector-on time) | Marked lightcurve |
|---|---|---|---|---|---|---|---|
| A | 7069 | 5098 | 4 | 4 | 0.06% | 0.08% | 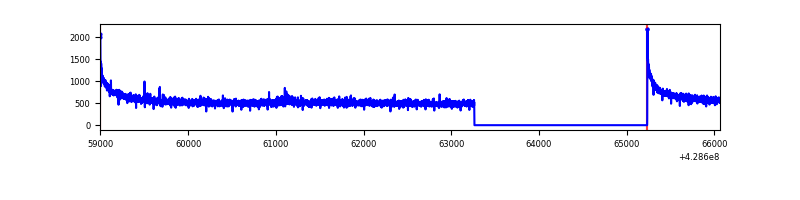 |
| B | 7069 | 5098 | 5 | 5 | 0.07% | 0.10% | 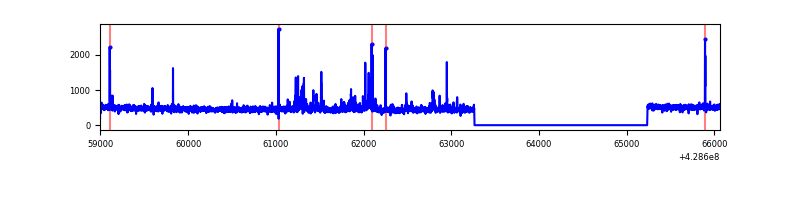 |
| C | 7069 | 5098 | 2 | 2 | 0.03% | 0.04% | 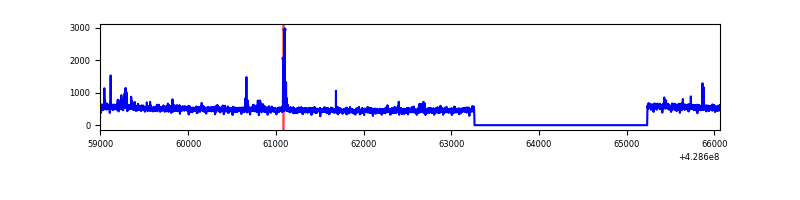 |
| D | 7069 | 5098 | 254 | 254 | 3.59% | 4.98% | 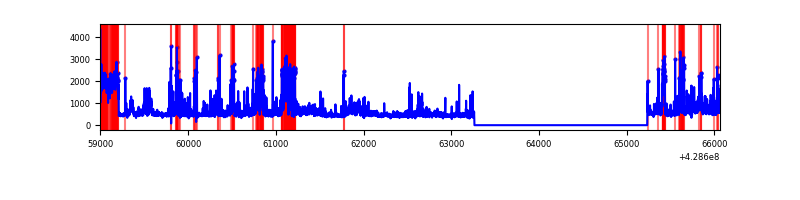 |
Top three noisy pixels from each quadrant. If the there are fewer than three noisy pixels in the level2.evt file, extra rows are filled as -1
| Pixel properties | Quadrant properties | ||||||
|---|---|---|---|---|---|---|---|
| Quadrant | DetID | PixID | Counts | Sigma | Mean | Median | Sigma |
| A | 10 | 83 | 541059 | 4462.71 | 594 | 582 | 121.1 |
| A | 13 | 6 | 12066 | 94.82 | 594 | 582 | 121.1 |
| A | 13 | 248 | 10936 | 85.49 | 594 | 582 | 121.1 |
| B | 3 | 112 | 35356 | 310.89 | 587 | 571 | 111.9 |
| B | 0 | 245 | 32686 | 287.02 | 587 | 571 | 111.9 |
| B | 5 | 252 | 29515 | 258.68 | 587 | 571 | 111.9 |
| C | 15 | 214 | 216397 | 1607.14 | 578 | 582 | 134.3 |
| C | 0 | 207 | 23095 | 167.65 | 578 | 582 | 134.3 |
| C | 9 | 54 | 21135 | 153.05 | 578 | 582 | 134.3 |
| D | 2 | 16 | 695912 | 4977.42 | 573 | 559 | 139.7 |
| D | 6 | 219 | 290963 | 2078.75 | 573 | 559 | 139.7 |
| D | 1 | 52 | 227541 | 1624.76 | 573 | 559 | 139.7 |
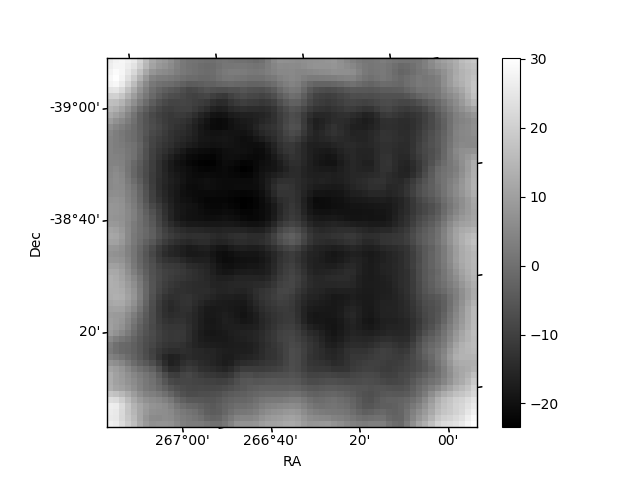
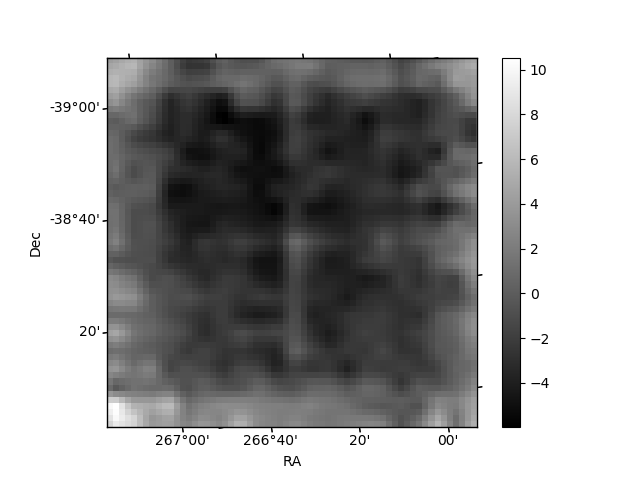
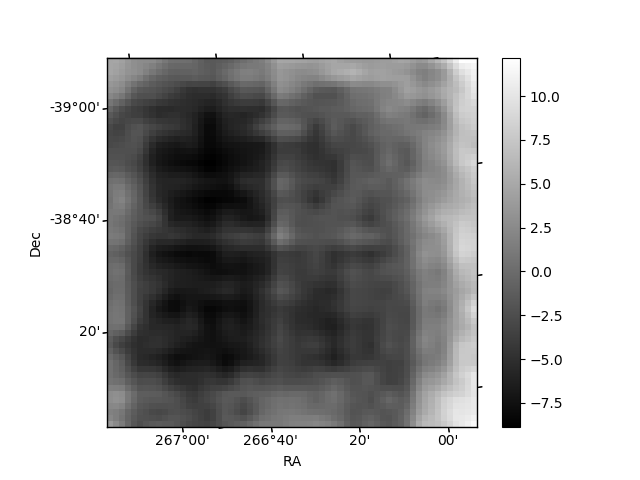
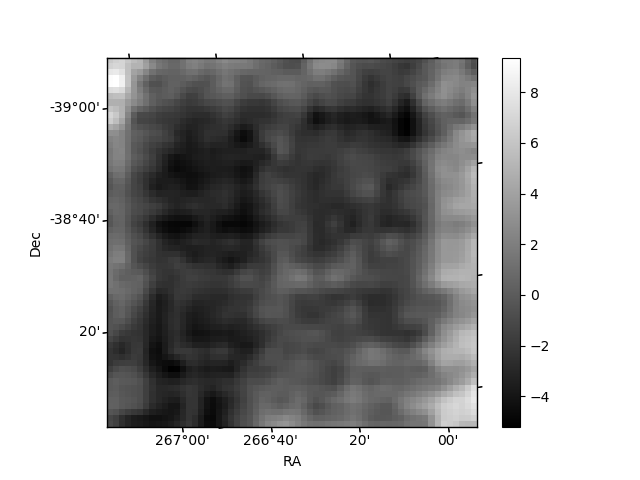
Histogram calculated using DETX and DETY for each event in the final _common_clean file
| Quadrant A | 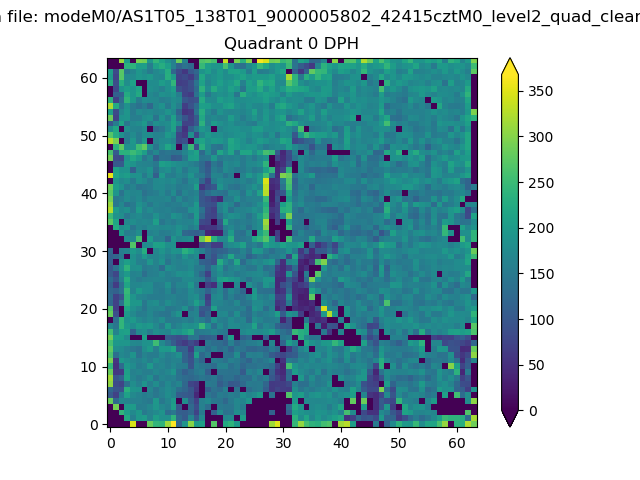 |
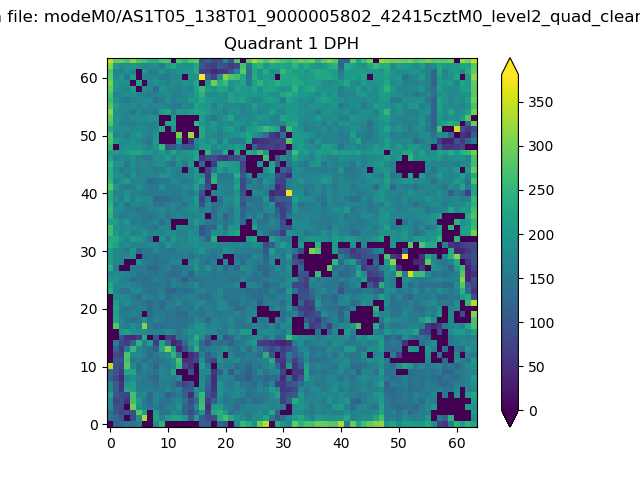 |
Quadrant B |
|---|---|---|---|
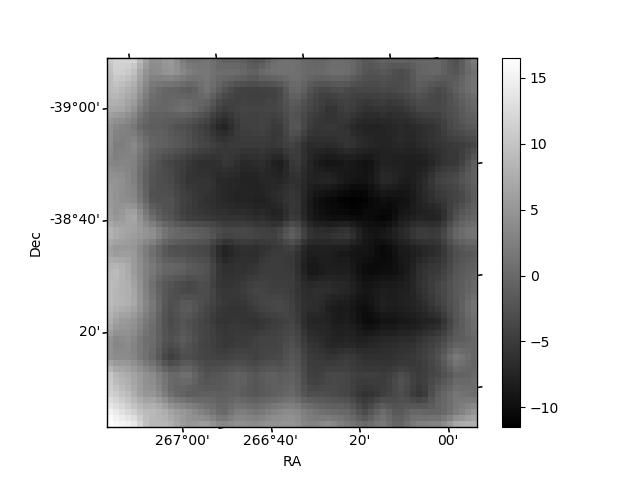
| Quadrant D | 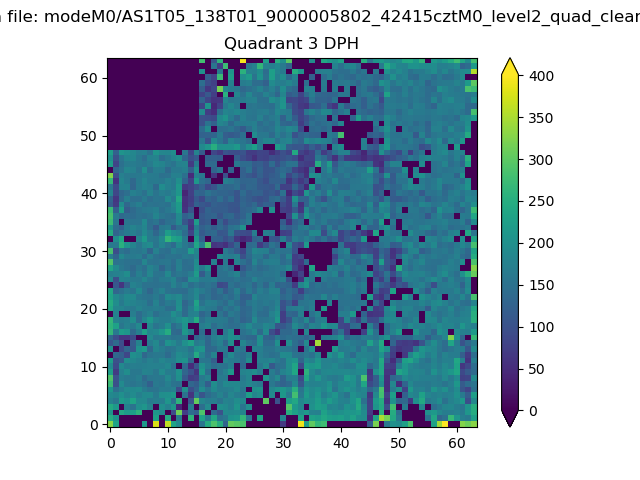 |
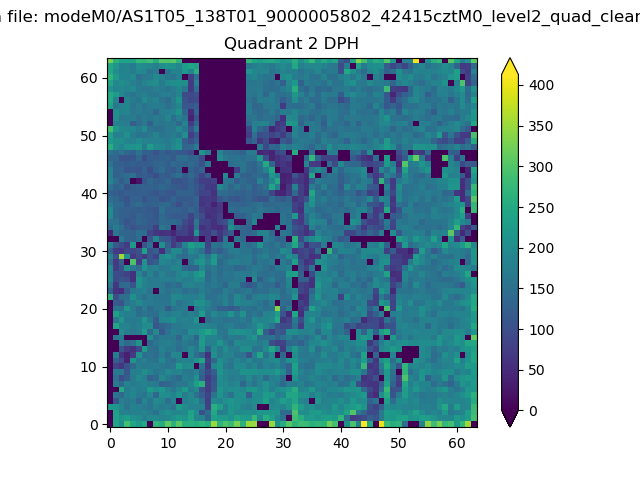 |
Quadrant C |
| Plot type | Count rate plots | Images |
|---|---|---|
| Comparison with Poisson distribution Blue bars denote a histogram of data divided into 1 sec bins. Red curve is a Poisson curve with rate = median count rate of data. |
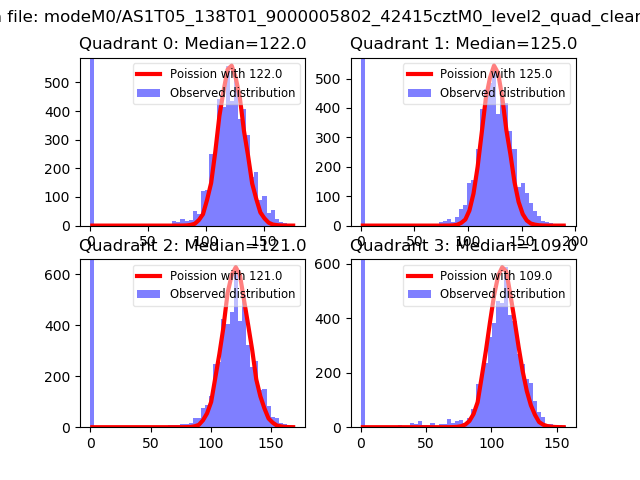 |
 |
| Quadrant-wise count rates Data is divided into 100 sec bins |
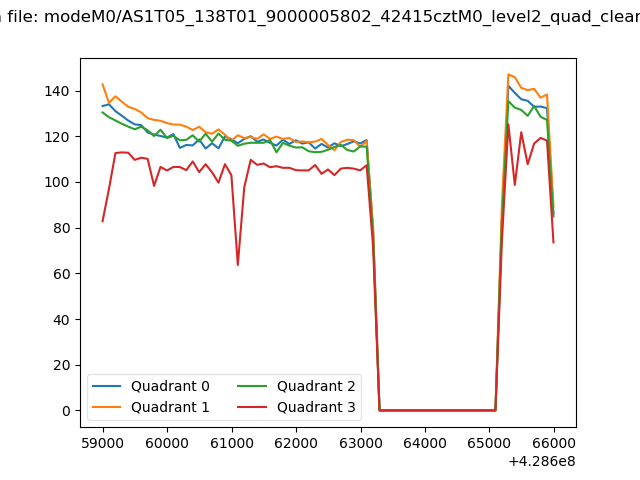 |
|
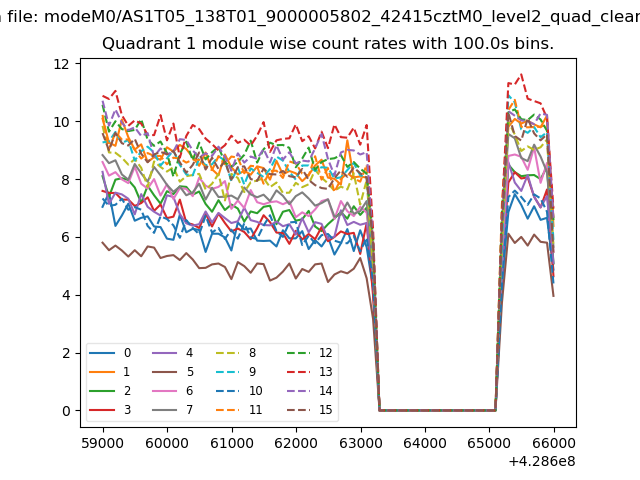
| Module-wise count rates for Quadrant A Data is divided into 100 sec bins |
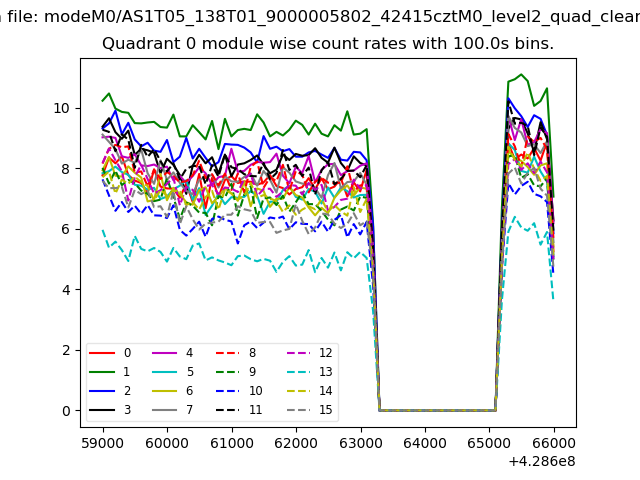 |
 |
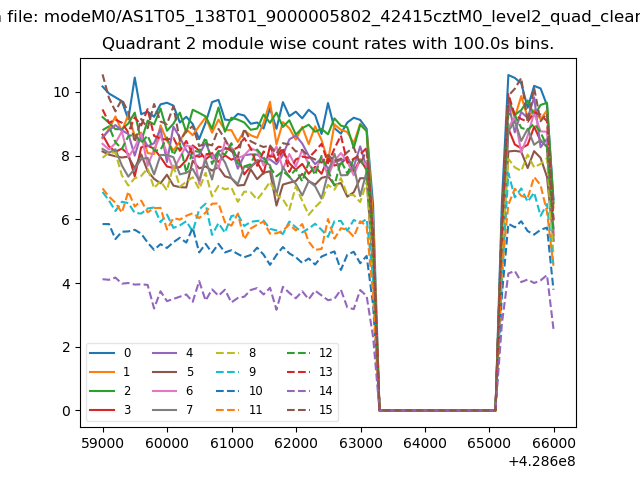
| Module-wise count rates for Quadrant B Data is divided into 100 sec bins |
 |
 |
| Module-wise count rates for Quadrant C Data is divided into 100 sec bins |
 |
 |
| Module-wise count rates for Quadrant D Data is divided into 100 sec bins |
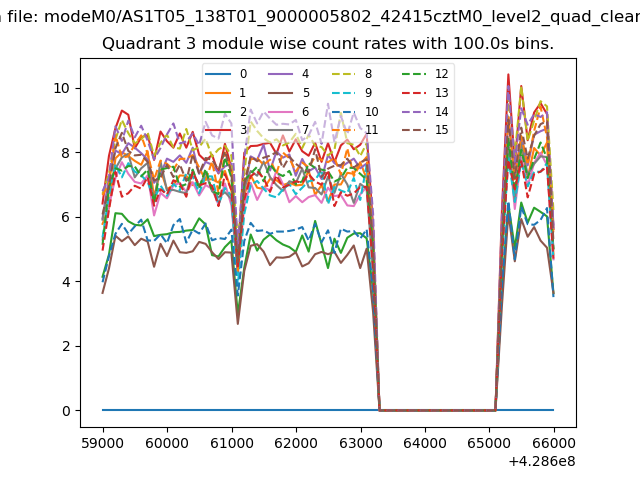 |
 |
| Parameter | Plot |
|---|---|
| CZT HV Monitor | 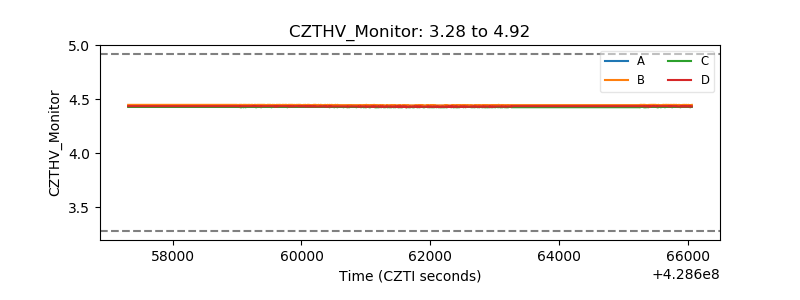 |
| D_VDD | 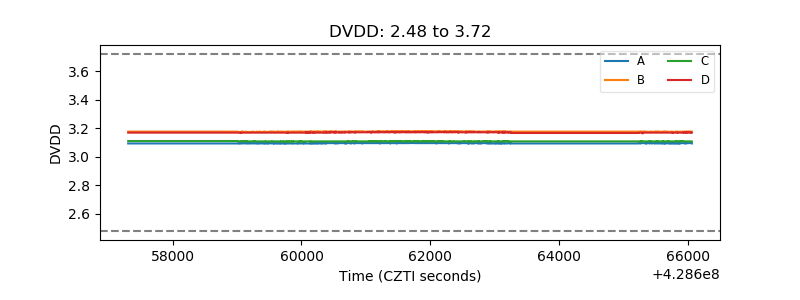 |
| Temperature 1 | 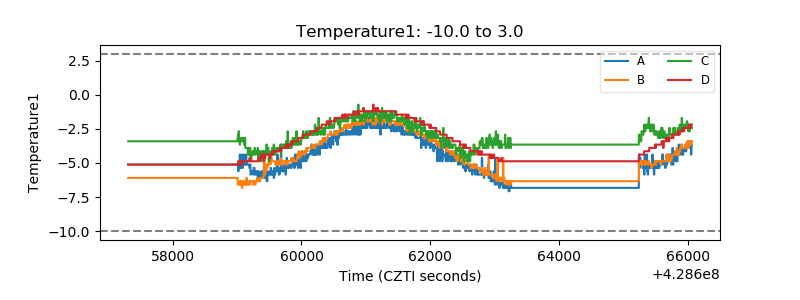 |
| Veto HV Monitor | 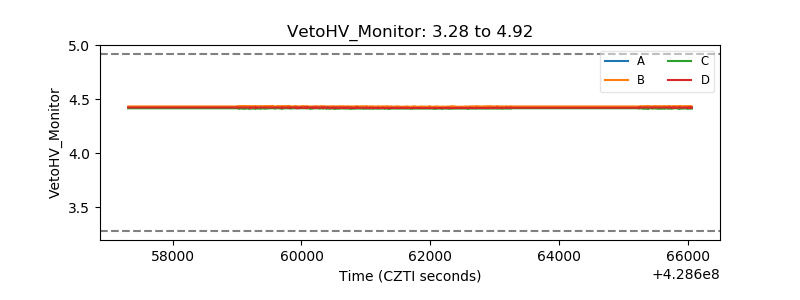 |
| Veto LLD | 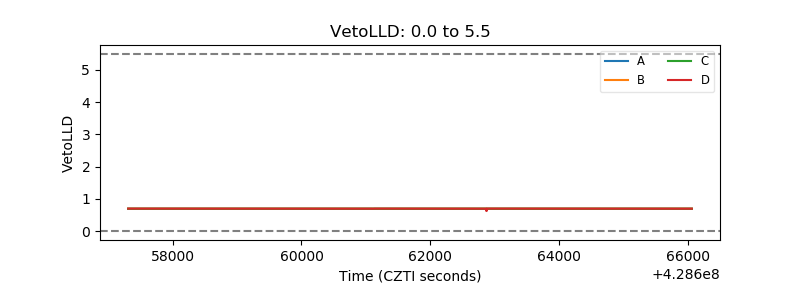 |
| Alpha Counter | 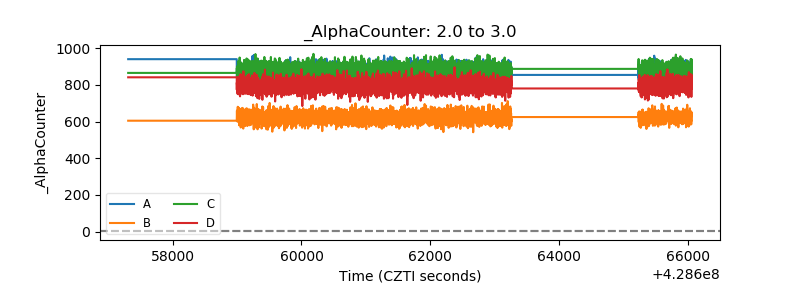 |
| _CPM_Rate | 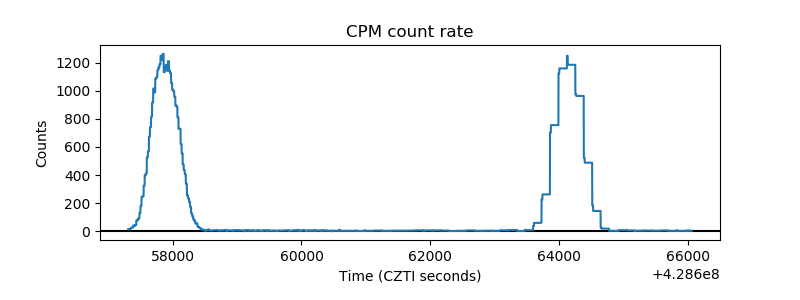 |
| CZT Counter | 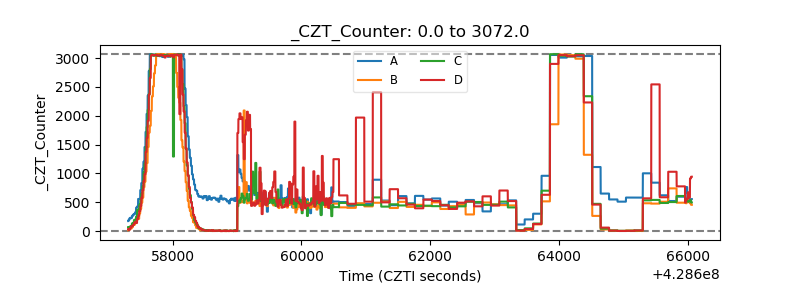 |
| +2.5 Volts monitor | 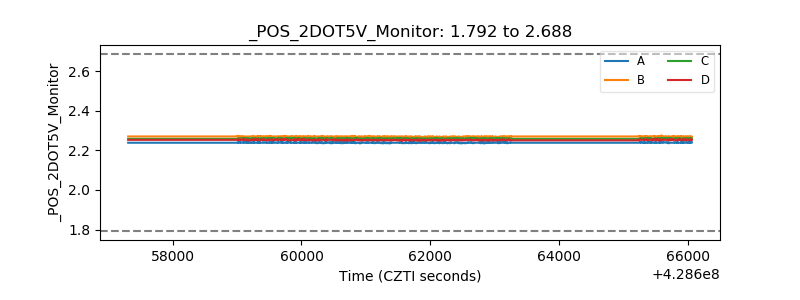 |
| +5 Volts monitor | 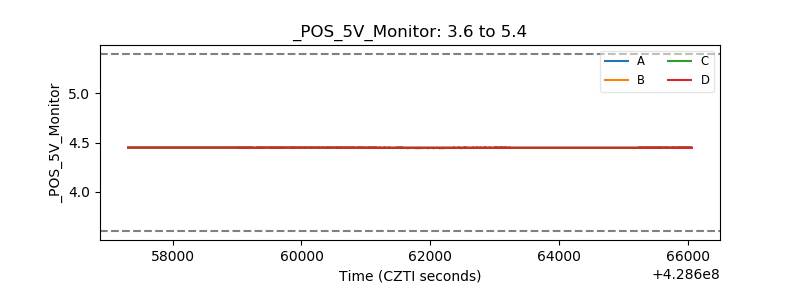 |
| _ROLL_ROT | 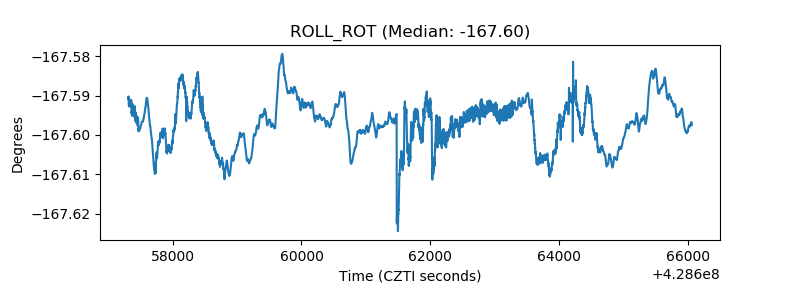 |
| _Roll_DEC | 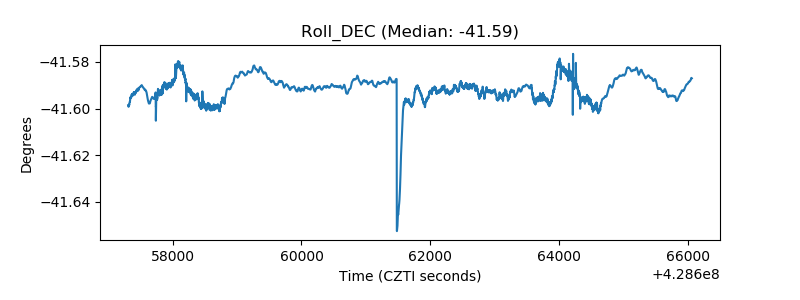 |
| _Roll_RA | 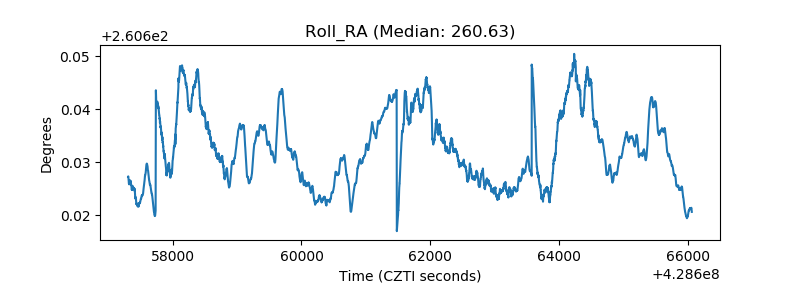 |
| Veto Counter | 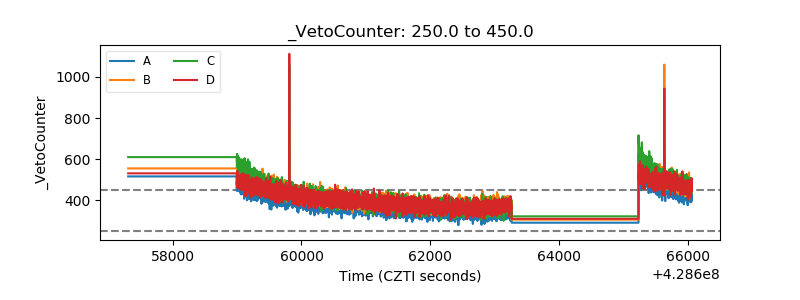 |