| Param | Original file | Final file |
|---|---|---|
| Filename | modeM0/AS1T05_138T01_9000005802_42416cztM0_level2.fits | modeM0/AS1T05_138T01_9000005802_42416cztM0_level2_quad_clean.evt |
| Size (bytes) | 393,203,520 | 89,527,680 |
| Size | 375.0 MB | 85.4 MB |
| Events in quadrant A | 2,875,411 | 623,410 |
| Events in quadrant B | 2,416,201 | 639,134 |
| Events in quadrant C | 2,500,142 | 610,980 |
| Events in quadrant D | 6,376,281 | 488,363 |
| Mode M9 | |||
|---|---|---|---|
| Quadrant | BADHDUFLAG | Total packets | Discarded packets |
| A | 0 | 34 | 0 |
| B | 0 | 35 | 0 |
| C | 0 | 35 | 0 |
| D | 0 | 35 | 0 |
| Mode M0 | |||
|---|---|---|---|
| Quadrant | BADHDUFLAG | Total packets | Discarded packets |
| A | 0 | 11472 | 2 |
| B | 0 | 10309 | 2 |
| C | 0 | 10403 | 4 |
| D | 0 | 22286 | 2 |
| Mode SS | |||
|---|---|---|---|
| Quadrant | BADHDUFLAG | Total packets | Discarded packets |
| A | 0 | 102 | 0 |
| B | 0 | 102 | 0 |
| C | 0 | 102 | 0 |
| D | 0 | 102 | 0 |
| Quadrant | Total seconds | Saturated seconds | Saturation percentage |
|---|---|---|---|
| A | 4978 | 9 | 0.180796% |
| B | 4978 | 18 | 0.361591% |
| C | 4977 | 9 | 0.180832% |
| D | 4977 | 912 | 18.324292% |
Noise dominated data is calculated using 1-second bins in cleaned event files. If a bin has >2000 counts, and if more than 50% of those come from <1% of pixels, then it is considered to be noise-dominated and hence unusable.
| Quadrant | # 1 sec bins | Bins with >0 counts | Bins with >2000 counts | High rate bins dominated by noise | Noise dominated (total time) | Noise dominated (detector-on time) | Marked lightcurve |
|---|---|---|---|---|---|---|---|
| A | 7041 | 4979 | 4 | 4 | 0.06% | 0.08% | 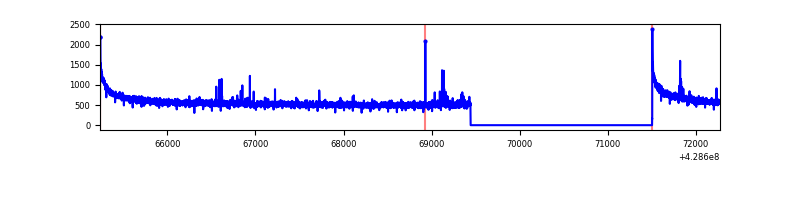 |
| B | 7041 | 4979 | 8 | 8 | 0.11% | 0.16% | 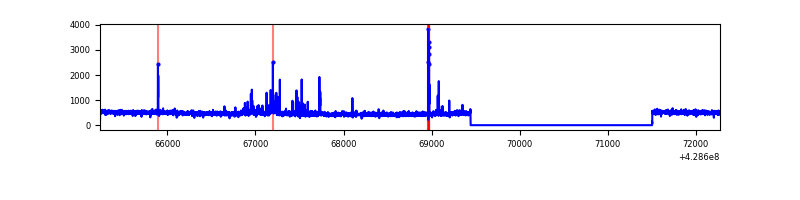 |
| C | 7040 | 4978 | 8 | 8 | 0.11% | 0.16% | 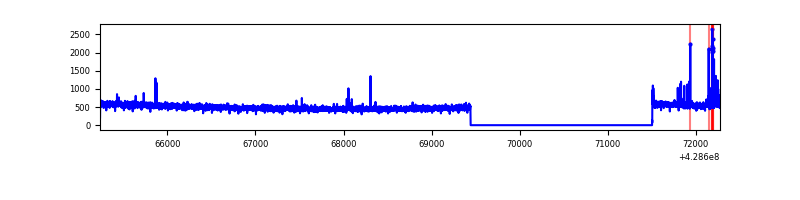 |
| D | 7040 | 4978 | 1050 | 1050 | 14.91% | 21.09% | 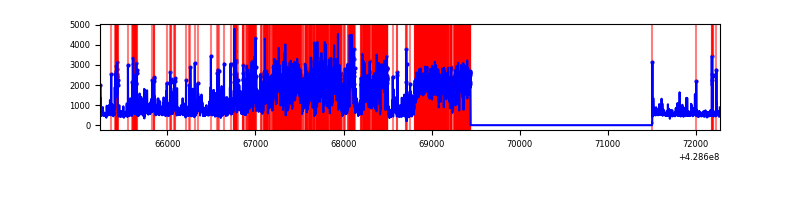 |
Top three noisy pixels from each quadrant. If the there are fewer than three noisy pixels in the level2.evt file, extra rows are filled as -1
| Pixel properties | Quadrant properties | ||||||
|---|---|---|---|---|---|---|---|
| Quadrant | DetID | PixID | Counts | Sigma | Mean | Median | Sigma |
| A | 10 | 83 | 544240 | 4498.31 | 590 | 580 | 120.9 |
| A | 13 | 248 | 20290 | 163.08 | 590 | 580 | 120.9 |
| A | 7 | 3 | 16710 | 133.46 | 590 | 580 | 120.9 |
| B | 15 | 36 | 37805 | 334.06 | 582 | 568 | 111.5 |
| B | 3 | 112 | 35197 | 310.66 | 582 | 568 | 111.5 |
| B | 0 | 245 | 28183 | 247.74 | 582 | 568 | 111.5 |
| C | 15 | 214 | 210452 | 1615.12 | 568 | 573 | 129.9 |
| C | 3 | 110 | 40628 | 308.24 | 568 | 573 | 129.9 |
| C | 14 | 254 | 18172 | 135.43 | 568 | 573 | 129.9 |
| D | 12 | 33 | 2697619 | 20426.71 | 544 | 530 | 132.0 |
| D | 1 | 52 | 776712 | 5878.5 | 544 | 530 | 132.0 |
| D | 6 | 219 | 423549 | 3203.78 | 544 | 530 | 132.0 |
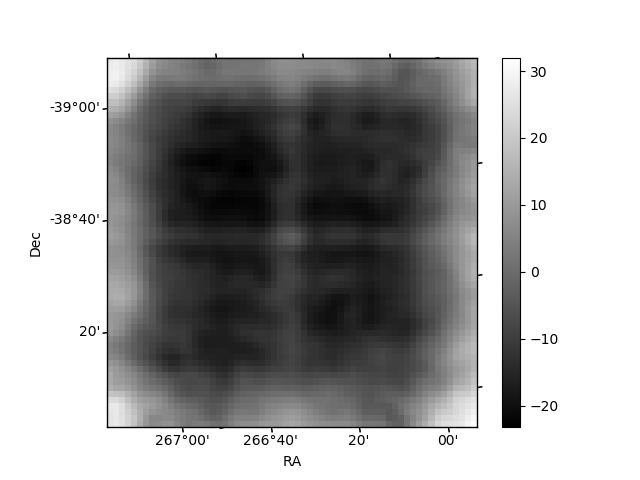
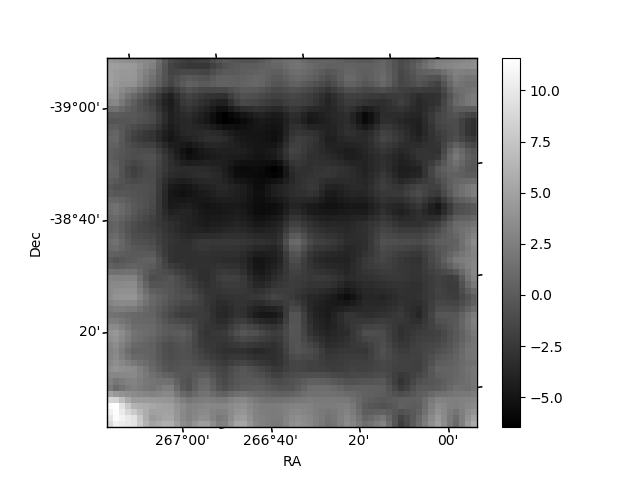
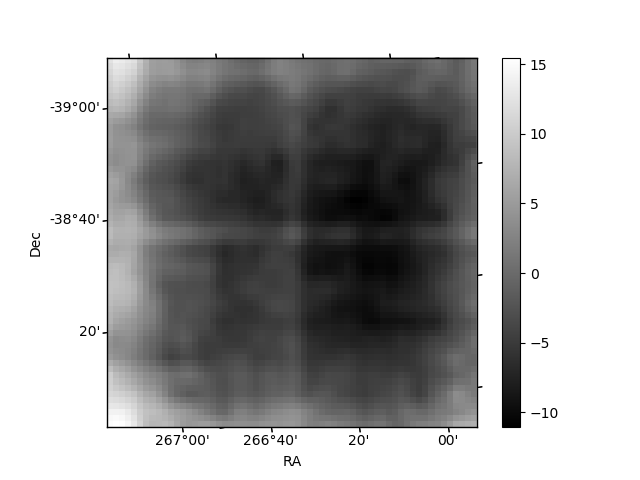
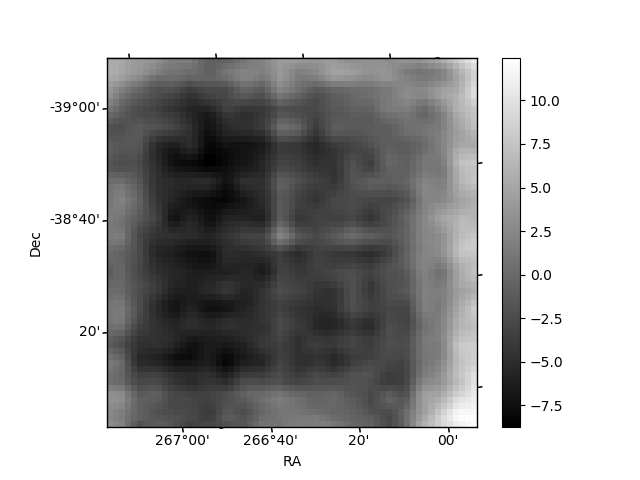
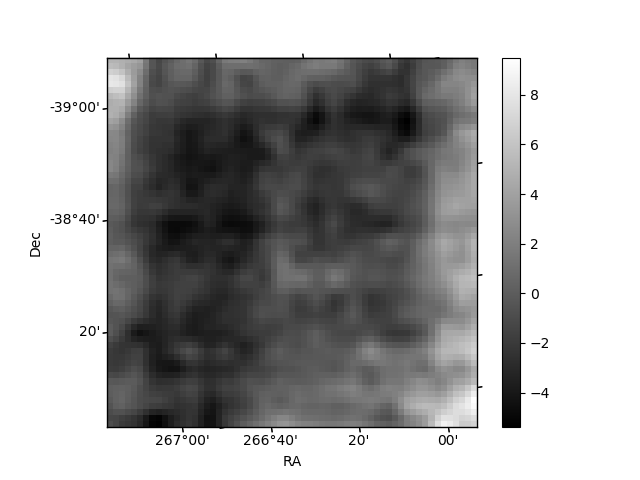
Histogram calculated using DETX and DETY for each event in the final _common_clean file
| Quadrant A | 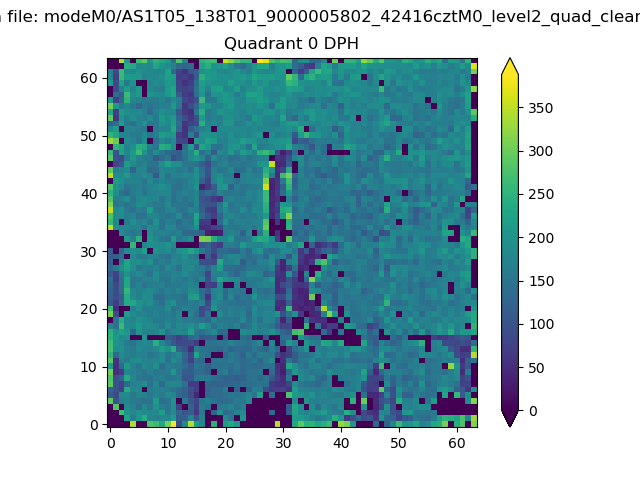 |
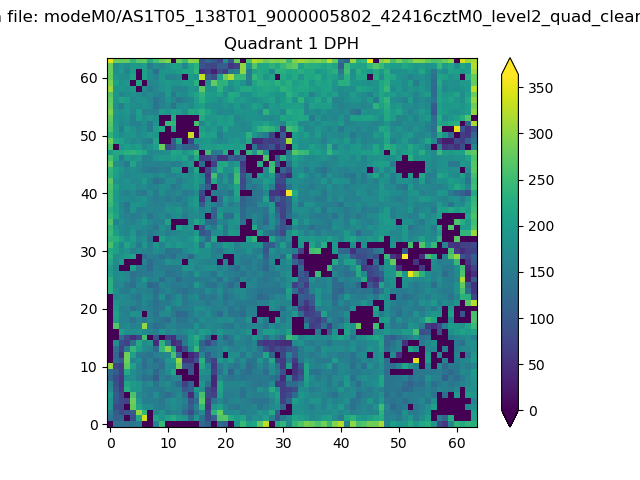 |
Quadrant B |
|---|---|---|---|
| Quadrant D | 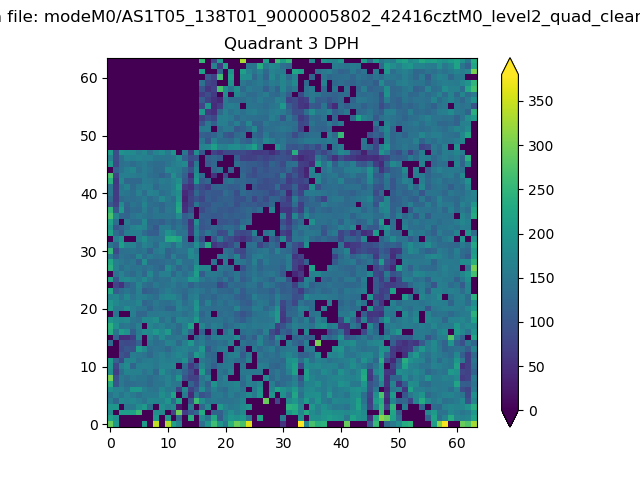 |
 |
Quadrant C |
| Plot type | Count rate plots | Images |
|---|---|---|
| Comparison with Poisson distribution Blue bars denote a histogram of data divided into 1 sec bins. Red curve is a Poisson curve with rate = median count rate of data. |
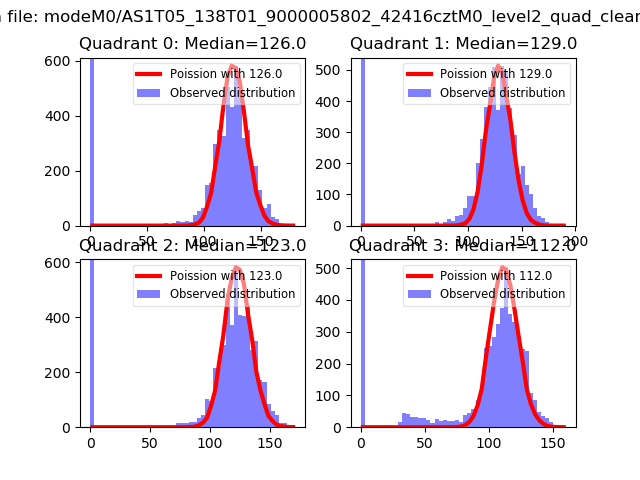 |
 |
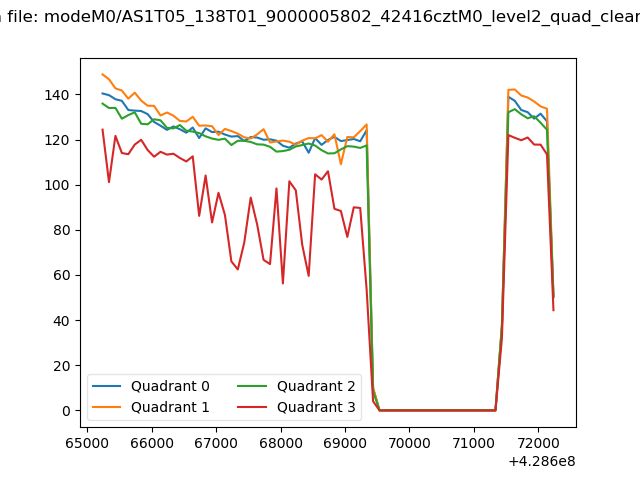
| Quadrant-wise count rates Data is divided into 100 sec bins |
 |
|
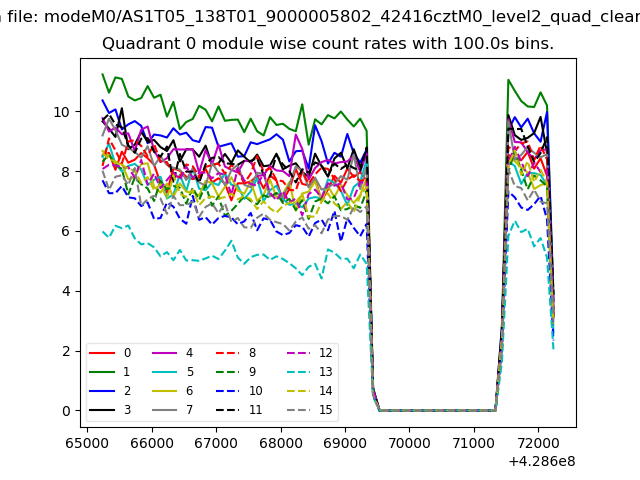
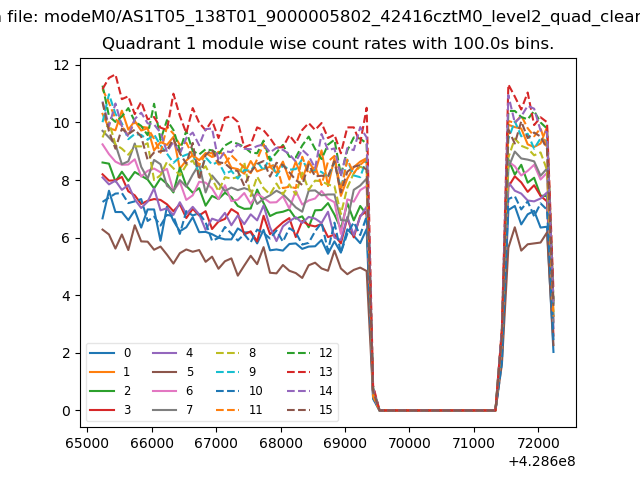
| Module-wise count rates for Quadrant A Data is divided into 100 sec bins |
 |
 |
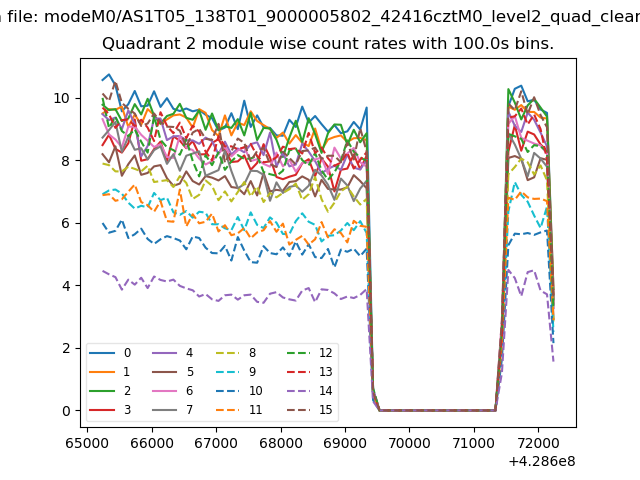
| Module-wise count rates for Quadrant B Data is divided into 100 sec bins |
 |
 |
| Module-wise count rates for Quadrant C Data is divided into 100 sec bins |
 |
 |
| Module-wise count rates for Quadrant D Data is divided into 100 sec bins |
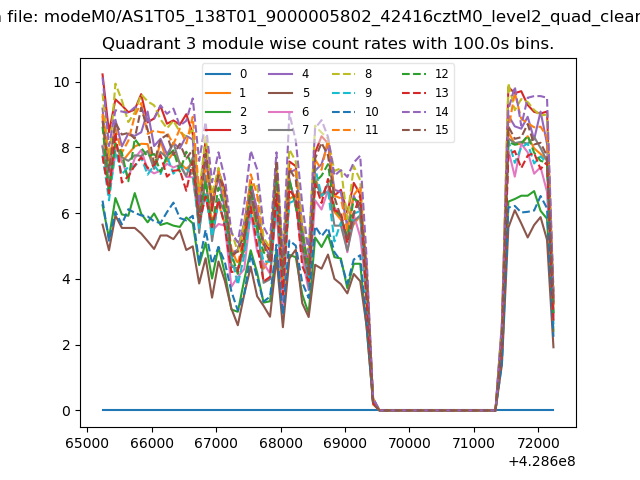 |
 |
| Parameter | Plot |
|---|---|
| CZT HV Monitor | 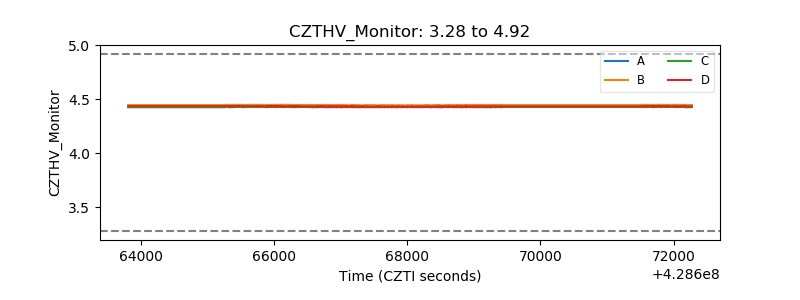 |
| D_VDD | 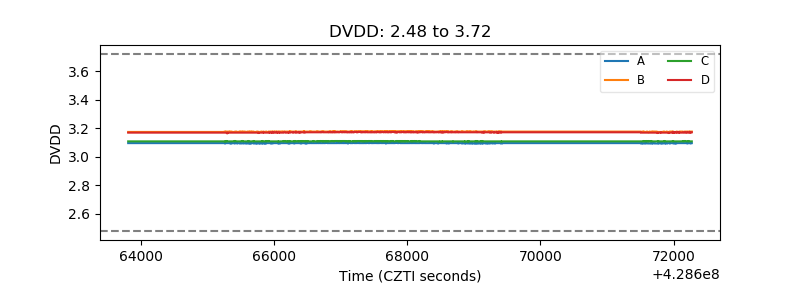 |
| Temperature 1 | 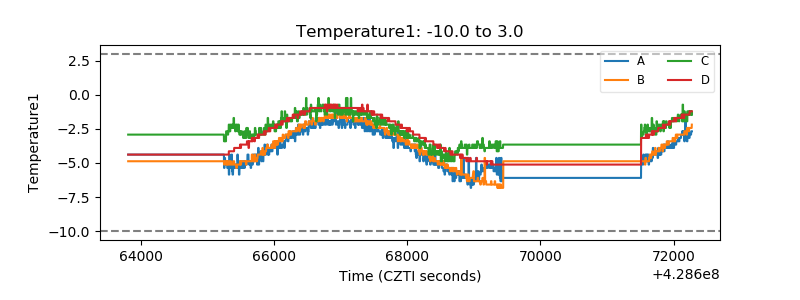 |
| Veto HV Monitor | 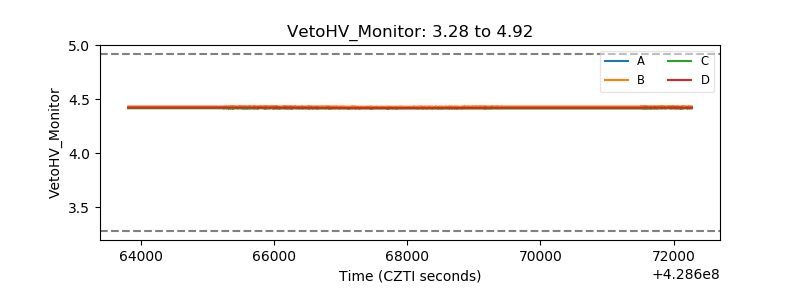 |
| Veto LLD | 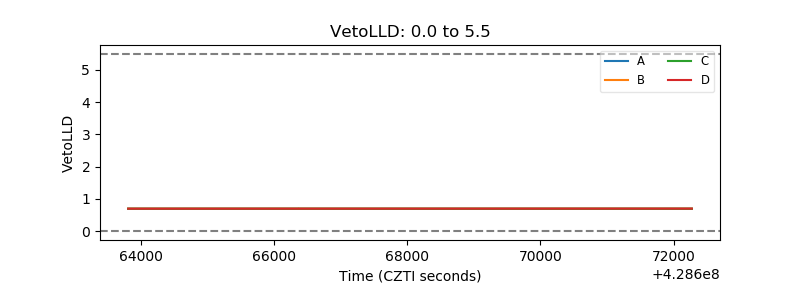 |
| Alpha Counter | 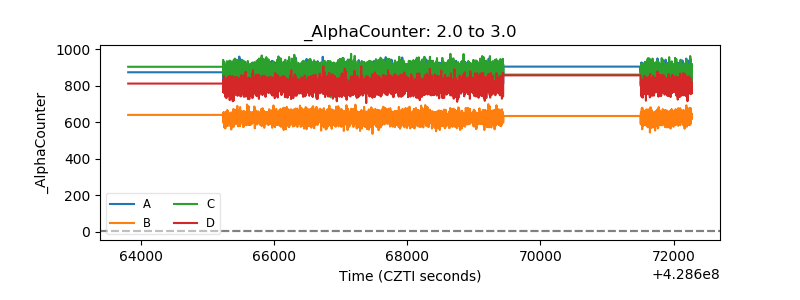 |
| _CPM_Rate | 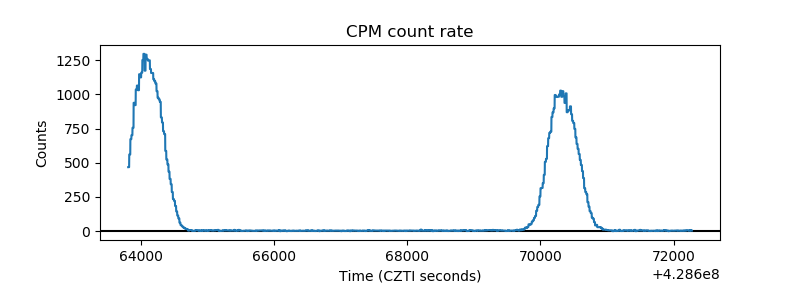 |
| CZT Counter | 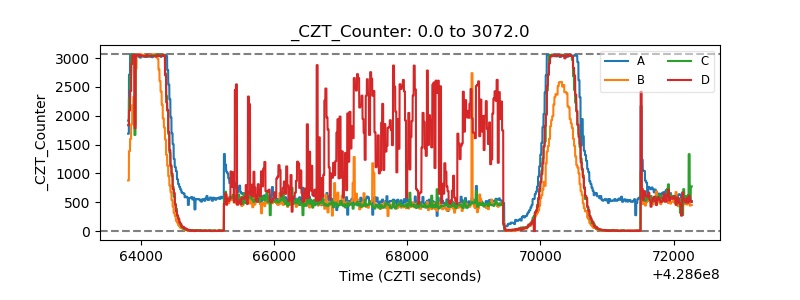 |
| +2.5 Volts monitor | 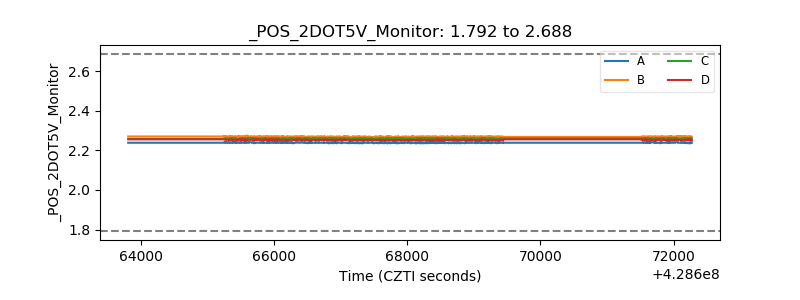 |
| +5 Volts monitor | 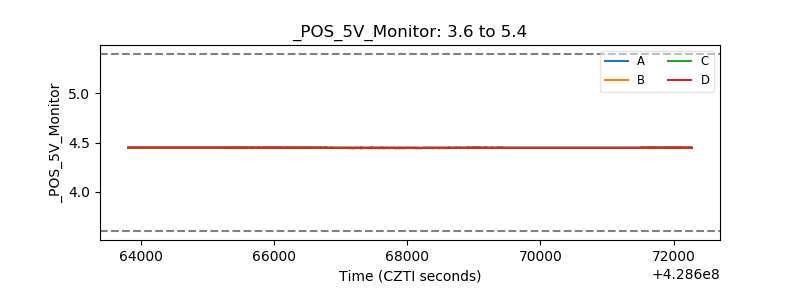 |
| _ROLL_ROT | 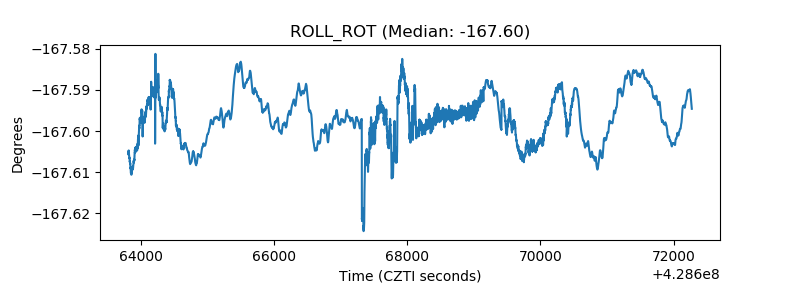 |
| _Roll_DEC | 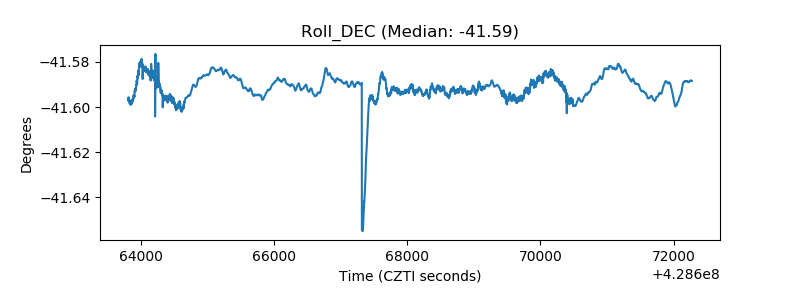 |
| _Roll_RA | 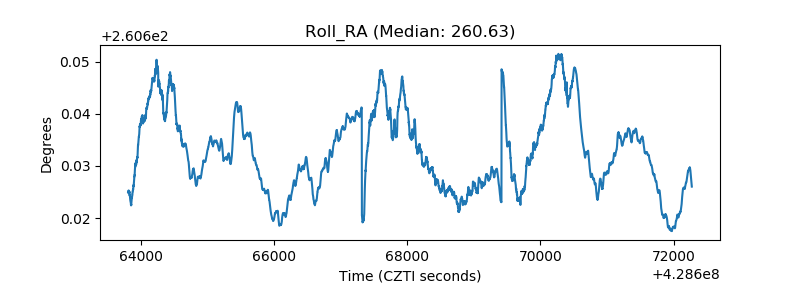 |
| Veto Counter | 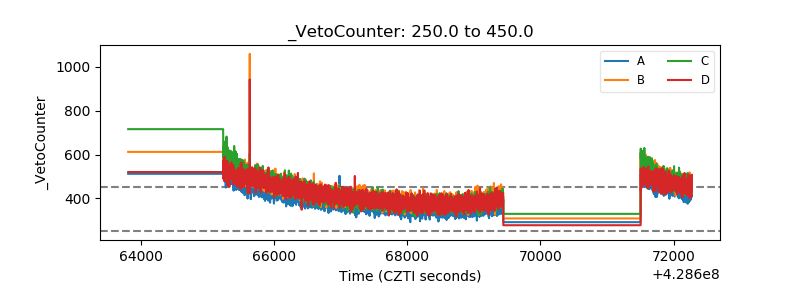 |