| Param | Original file | Final file |
|---|---|---|
| Filename | modeM0/AS1T05_138T01_9000005802_42417cztM0_level2.fits | modeM0/AS1T05_138T01_9000005802_42417cztM0_level2_quad_clean.evt |
| Size (bytes) | 196,364,160 | 52,597,440 |
| Size | 187.3 MB | 50.2 MB |
| Events in quadrant A | 1,686,978 | 359,491 |
| Events in quadrant B | 1,393,521 | 367,772 |
| Events in quadrant C | 1,439,019 | 352,968 |
| Events in quadrant D | 2,521,959 | 305,733 |
| Mode M9 | |||
|---|---|---|---|
| Quadrant | BADHDUFLAG | Total packets | Discarded packets |
| A | 0 | 14 | 0 |
| B | 0 | 15 | 0 |
| C | 0 | 15 | 0 |
| D | 0 | 15 | 0 |
| Mode M0 | |||
|---|---|---|---|
| Quadrant | BADHDUFLAG | Total packets | Discarded packets |
| A | 0 | 6726 | 1 |
| B | 0 | 6054 | 5 |
| C | 0 | 6096 | 4 |
| D | 0 | 9435 | 8 |
| Mode SS | |||
|---|---|---|---|
| Quadrant | BADHDUFLAG | Total packets | Discarded packets |
| A | 0 | 58 | 0 |
| B | 0 | 58 | 0 |
| C | 0 | 58 | 0 |
| D | 0 | 58 | 0 |
| Quadrant | Total seconds | Saturated seconds | Saturation percentage |
|---|---|---|---|
| A | 2898 | 17 | 0.586611% |
| B | 2895 | 3 | 0.103627% |
| C | 2896 | 9 | 0.310773% |
| D | 2897 | 238 | 8.215395% |
Noise dominated data is calculated using 1-second bins in cleaned event files. If a bin has >2000 counts, and if more than 50% of those come from <1% of pixels, then it is considered to be noise-dominated and hence unusable.
| Quadrant | # 1 sec bins | Bins with >0 counts | Bins with >2000 counts | High rate bins dominated by noise | Noise dominated (total time) | Noise dominated (detector-on time) | Marked lightcurve |
|---|---|---|---|---|---|---|---|
| A | 2898 | 2898 | 9 | 9 | 0.31% | 0.31% | 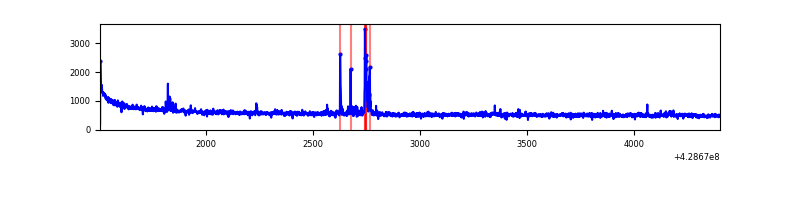 |
| B | 2898 | 2897 | 0 | 0 | 0.00% | 0.00% | 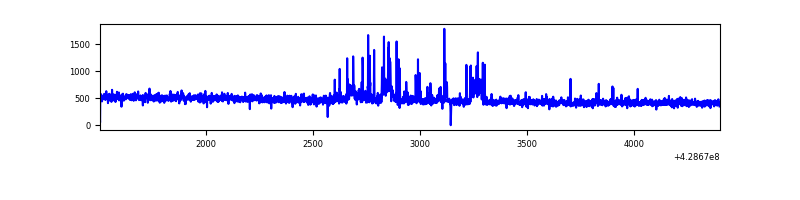 |
| C | 2898 | 2897 | 8 | 8 | 0.28% | 0.28% | 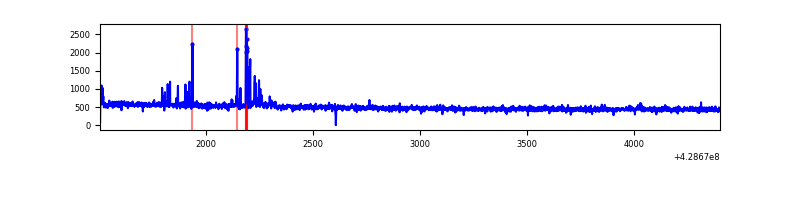 |
| D | 2898 | 2898 | 240 | 240 | 8.28% | 8.28% | 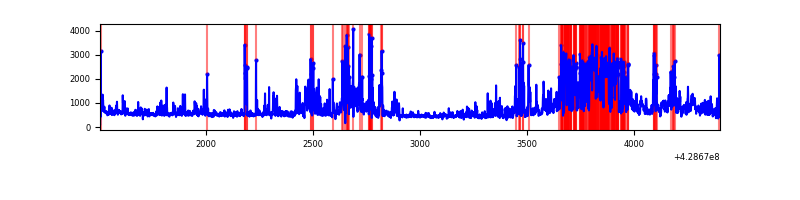 |
Top three noisy pixels from each quadrant. If the there are fewer than three noisy pixels in the level2.evt file, extra rows are filled as -1
| Pixel properties | Quadrant properties | ||||||
|---|---|---|---|---|---|---|---|
| Quadrant | DetID | PixID | Counts | Sigma | Mean | Median | Sigma |
| A | 10 | 83 | 307971 | 4402.53 | 337 | 331 | 69.9 |
| A | 7 | 3 | 54324 | 772.67 | 337 | 331 | 69.9 |
| A | 13 | 6 | 11943 | 166.18 | 337 | 331 | 69.9 |
| B | 15 | 36 | 26613 | 414.17 | 330 | 323 | 63.5 |
| B | 0 | 245 | 25389 | 394.89 | 330 | 323 | 63.5 |
| B | 5 | 255 | 22362 | 347.2 | 330 | 323 | 63.5 |
| C | 15 | 214 | 121092 | 1606.15 | 321 | 324 | 75.2 |
| C | 3 | 110 | 42586 | 562.06 | 321 | 324 | 75.2 |
| C | 14 | 254 | 13687 | 177.72 | 321 | 324 | 75.2 |
| D | 12 | 33 | 377586 | 4879.63 | 318 | 310 | 77.3 |
| D | 2 | 16 | 367004 | 4742.76 | 318 | 310 | 77.3 |
| D | 12 | 233 | 230205 | 2973.43 | 318 | 310 | 77.3 |
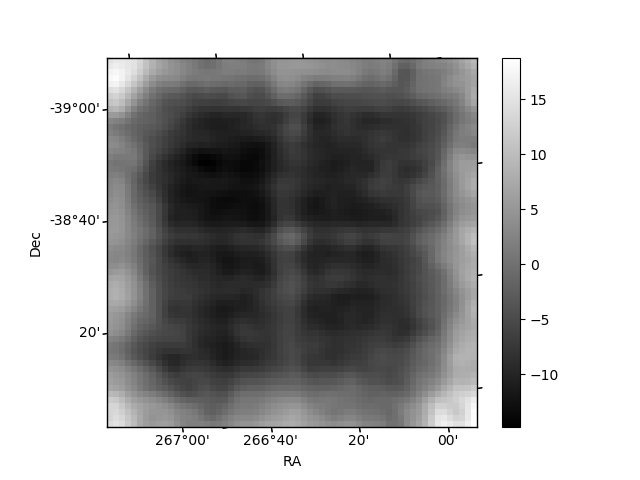
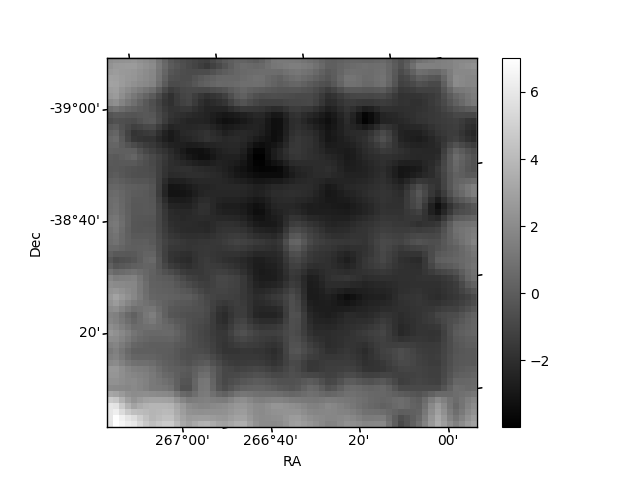
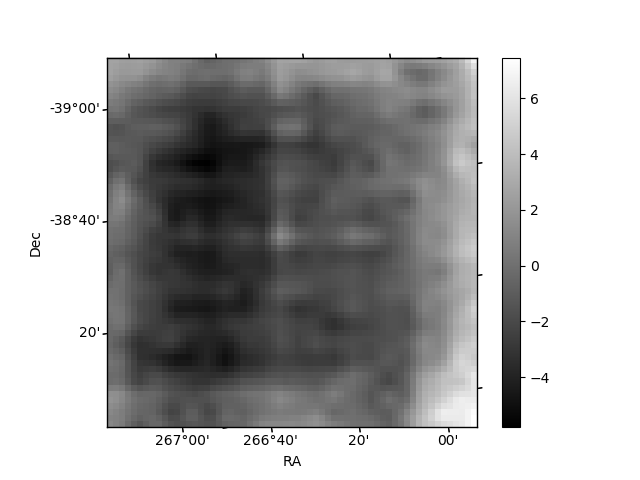
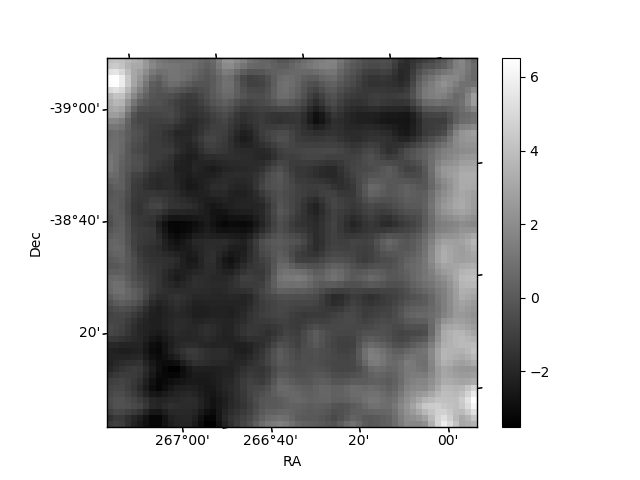
Histogram calculated using DETX and DETY for each event in the final _common_clean file
| Quadrant A | 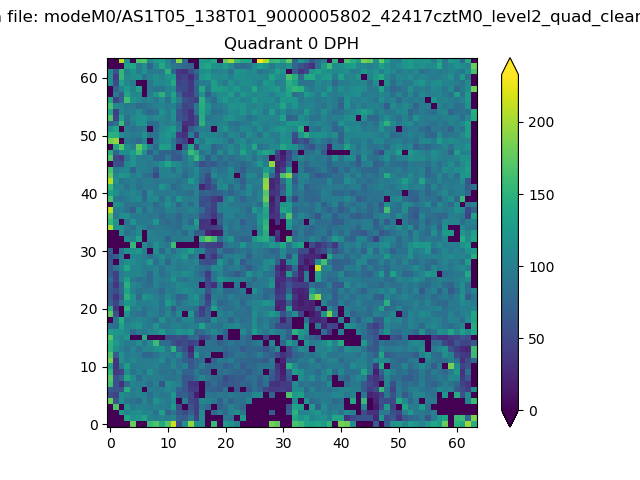 |
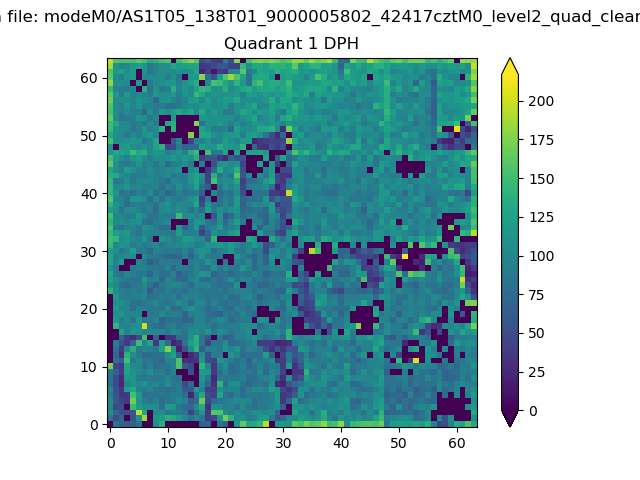 |
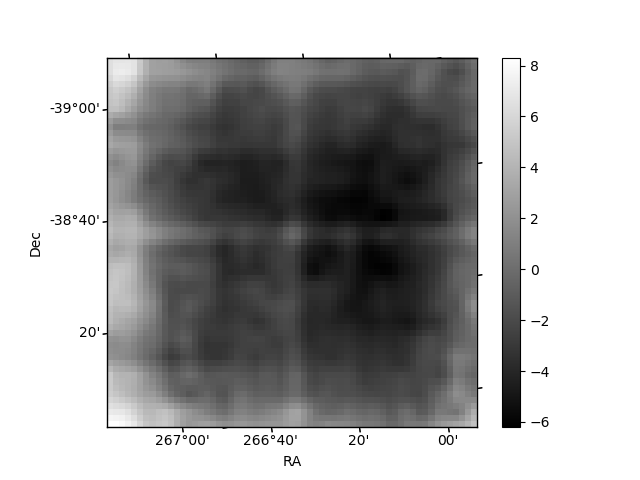
Quadrant B |
|---|---|---|---|
| Quadrant D | 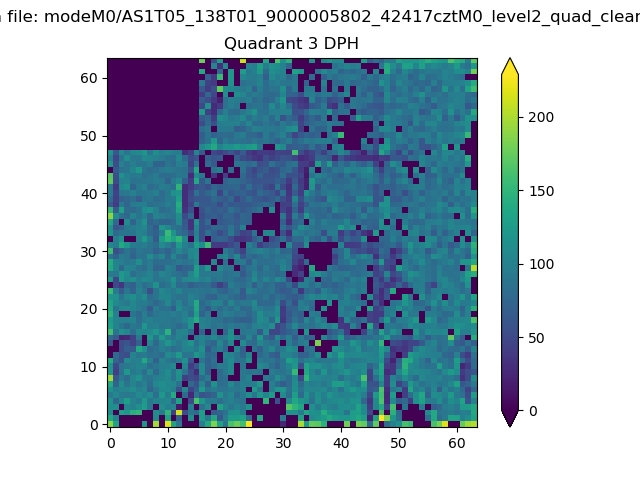 |
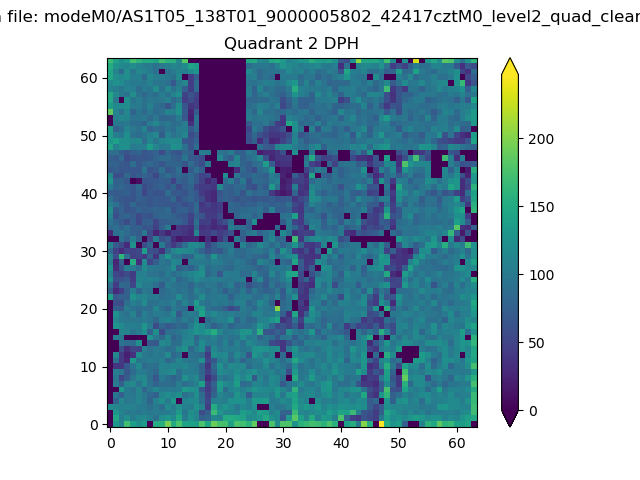 |
Quadrant C |
| Plot type | Count rate plots | Images |
|---|---|---|
| Comparison with Poisson distribution Blue bars denote a histogram of data divided into 1 sec bins. Red curve is a Poisson curve with rate = median count rate of data. |
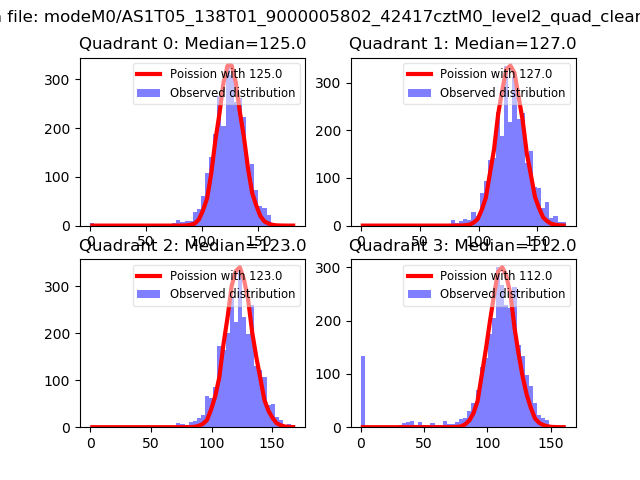 |
 |
| Quadrant-wise count rates Data is divided into 100 sec bins |
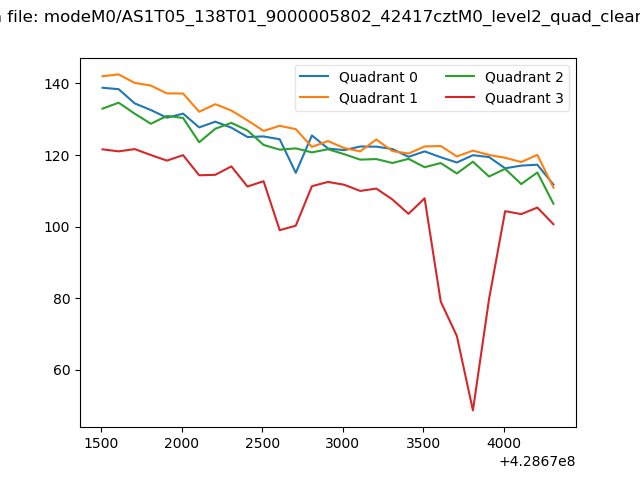 |
|
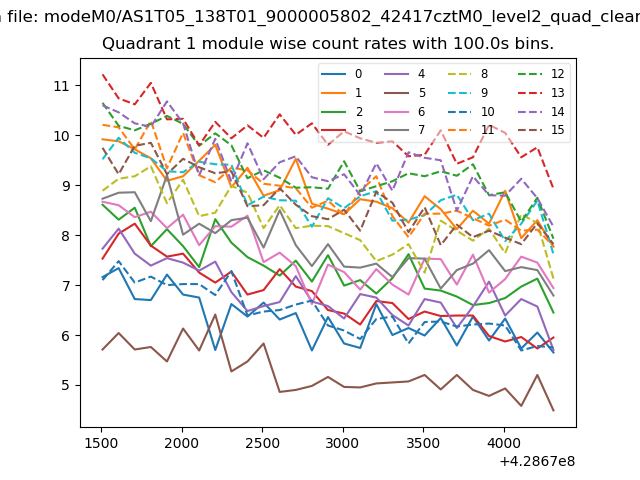
| Module-wise count rates for Quadrant A Data is divided into 100 sec bins |
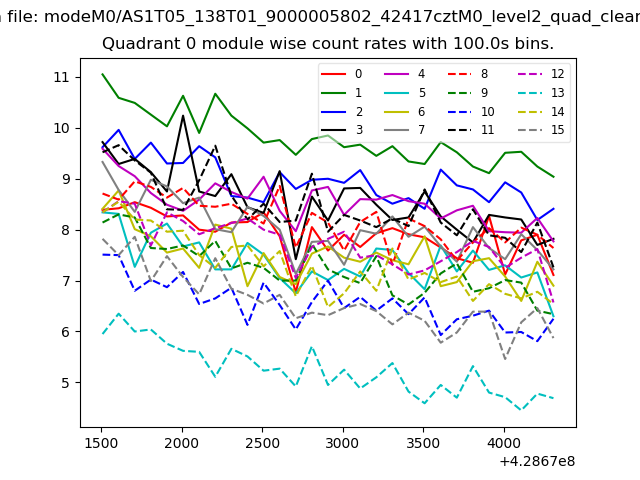 |
 |
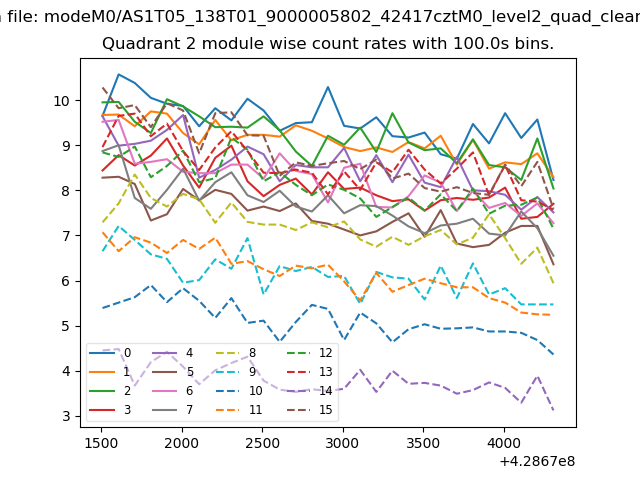
| Module-wise count rates for Quadrant B Data is divided into 100 sec bins |
 |
 |
| Module-wise count rates for Quadrant C Data is divided into 100 sec bins |
 |
 |
| Module-wise count rates for Quadrant D Data is divided into 100 sec bins |
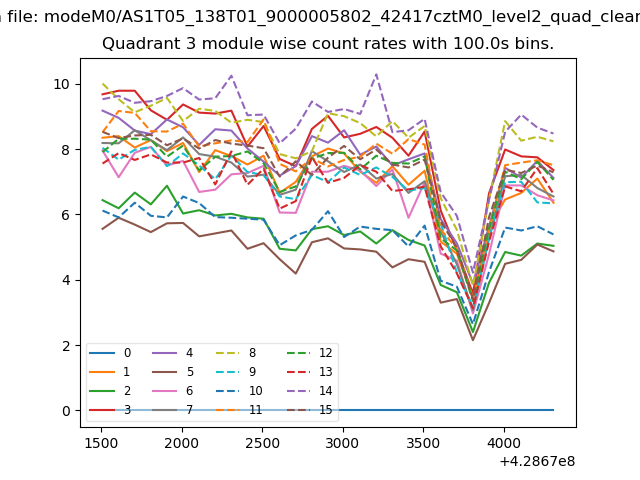 |
 |
| Parameter | Plot |
|---|---|
| CZT HV Monitor | 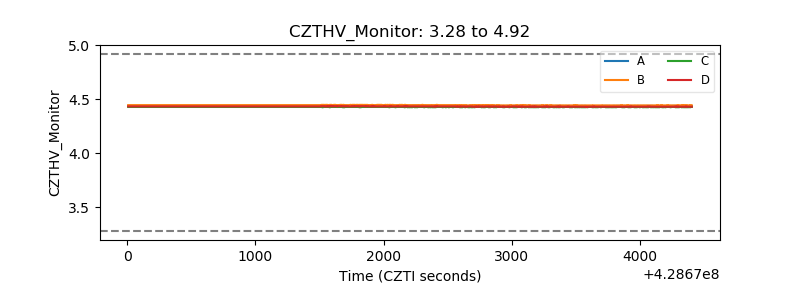 |
| D_VDD | 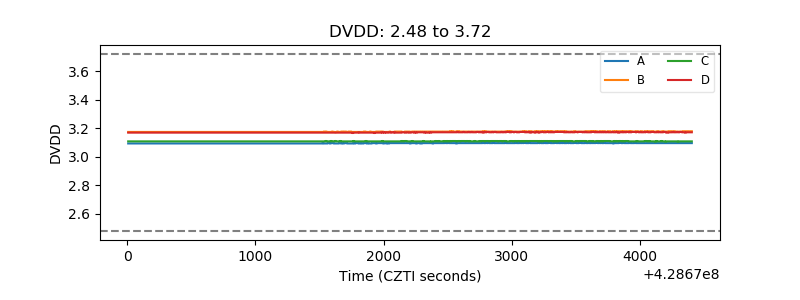 |
| Temperature 1 | 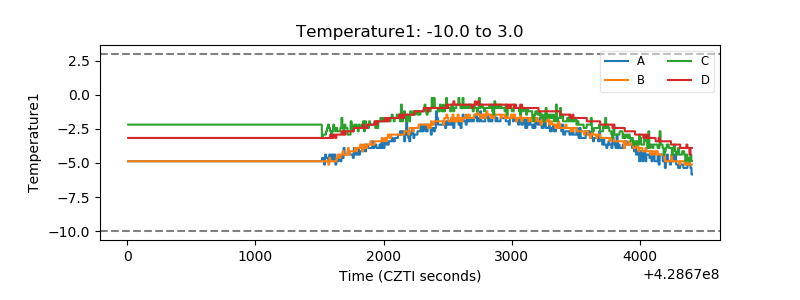 |
| Veto HV Monitor | 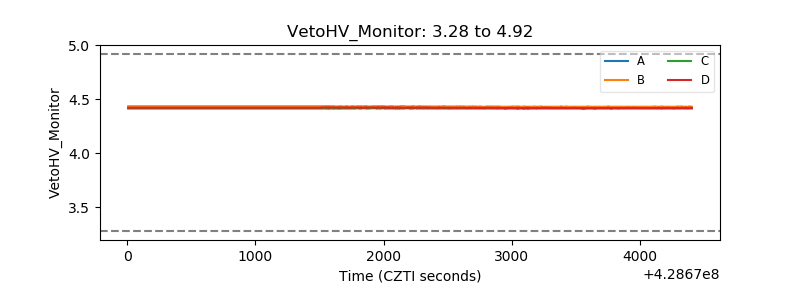 |
| Veto LLD | 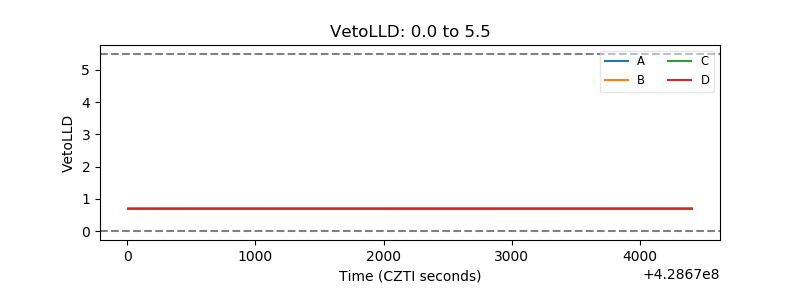 |
| Alpha Counter | 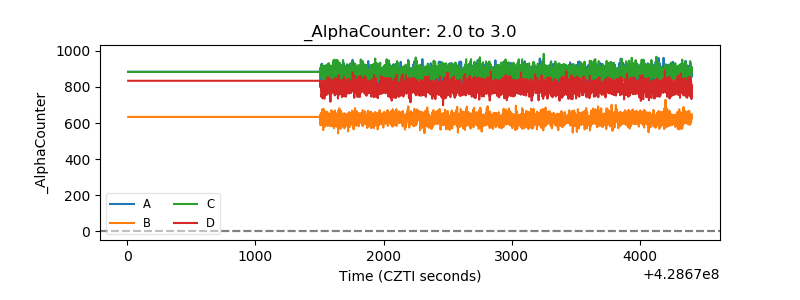 |
| _CPM_Rate | 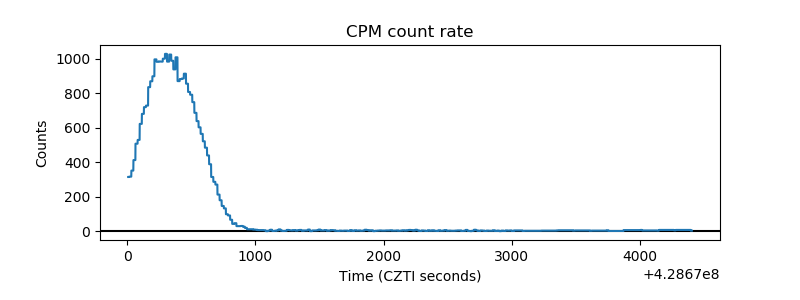 |
| CZT Counter | 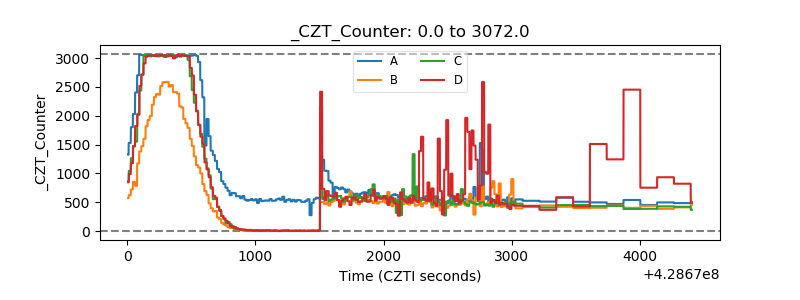 |
| +2.5 Volts monitor | 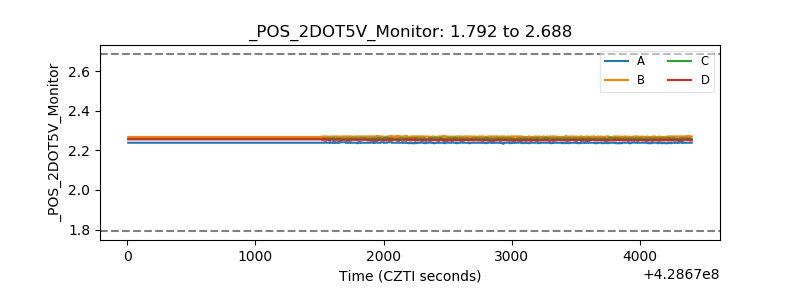 |
| +5 Volts monitor |  |
| _ROLL_ROT | 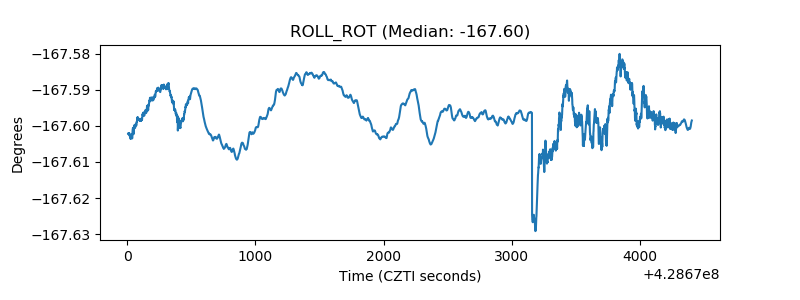 |
| _Roll_DEC | 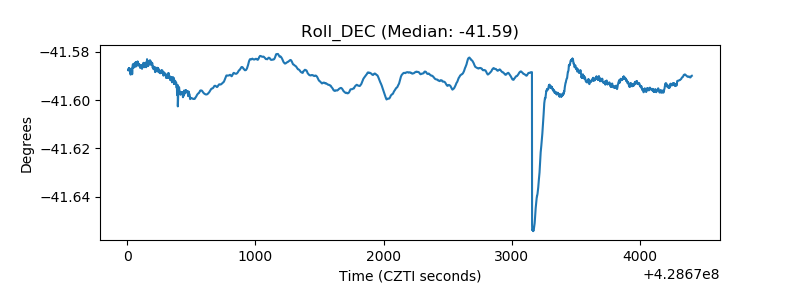 |
| _Roll_RA | 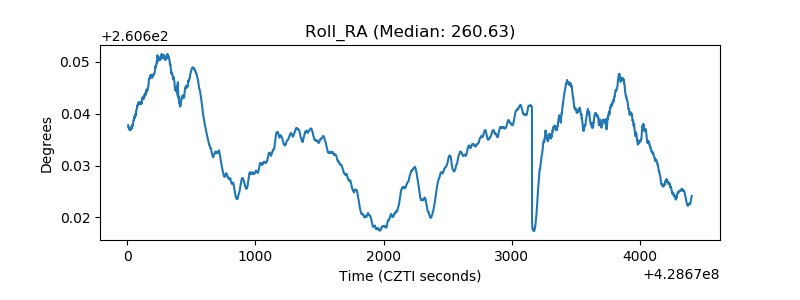 |
| Veto Counter | 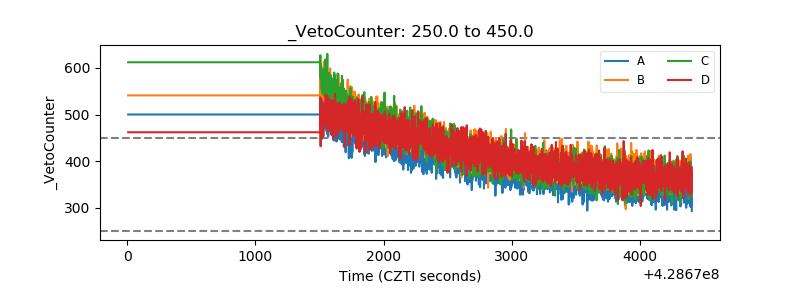 |