| Param | Original file | Final file |
|---|---|---|
| Filename | modeM0/AS1T05_138T01_9000005802_42419cztM0_level2.fits | modeM0/AS1T05_138T01_9000005802_42419cztM0_level2_quad_clean.evt |
| Size (bytes) | 169,064,640 | 44,884,800 |
| Size | 161.2 MB | 42.8 MB |
| Events in quadrant A | 1,369,256 | 305,781 |
| Events in quadrant B | 1,195,255 | 313,223 |
| Events in quadrant C | 1,213,134 | 301,686 |
| Events in quadrant D | 2,283,222 | 258,718 |
| Mode M0 | |||
|---|---|---|---|
| Quadrant | BADHDUFLAG | Total packets | Discarded packets |
| A | 0 | 5471 | 0 |
| B | 0 | 5265 | 0 |
| C | 0 | 5213 | 0 |
| D | 0 | 8466 | 0 |
| Mode SS | |||
|---|---|---|---|
| Quadrant | BADHDUFLAG | Total packets | Discarded packets |
| A | 0 | 50 | 0 |
| B | 0 | 50 | 0 |
| C | 0 | 50 | 0 |
| D | 0 | 50 | 0 |
| Quadrant | Total seconds | Saturated seconds | Saturation percentage |
|---|---|---|---|
| A | 2507 | 14 | 0.558436% |
| B | 2507 | 2 | 0.079777% |
| C | 2508 | 8 | 0.318979% |
| D | 2508 | 235 | 9.370016% |
Noise dominated data is calculated using 1-second bins in cleaned event files. If a bin has >2000 counts, and if more than 50% of those come from <1% of pixels, then it is considered to be noise-dominated and hence unusable.
| Quadrant | # 1 sec bins | Bins with >0 counts | Bins with >2000 counts | High rate bins dominated by noise | Noise dominated (total time) | Noise dominated (detector-on time) | Marked lightcurve |
|---|---|---|---|---|---|---|---|
| A | 2507 | 2507 | 8 | 8 | 0.32% | 0.32% | 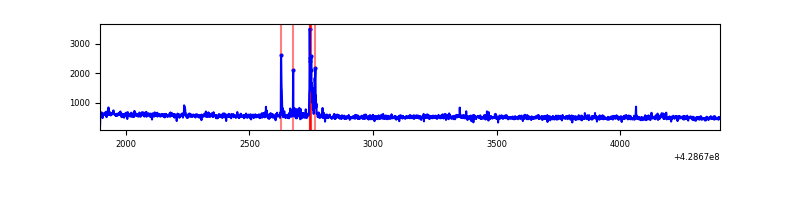 |
| B | 2507 | 2507 | 0 | 0 | 0.00% | 0.00% | 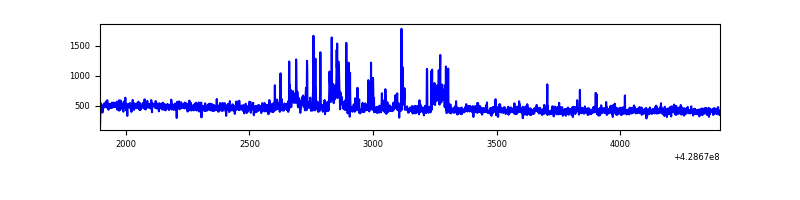 |
| C | 2508 | 2508 | 8 | 8 | 0.32% | 0.32% | 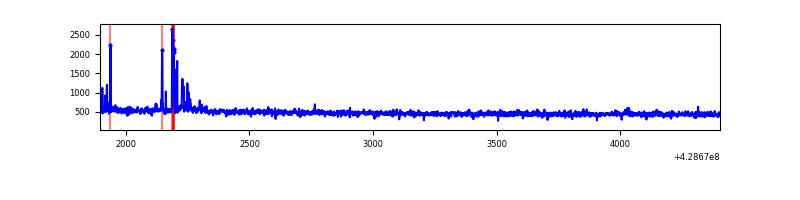 |
| D | 2508 | 2508 | 240 | 240 | 9.57% | 9.57% | 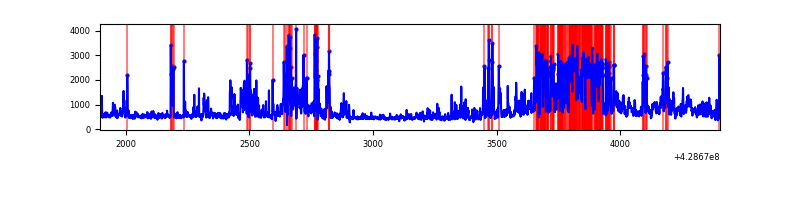 |
Top three noisy pixels from each quadrant. If the there are fewer than three noisy pixels in the level2.evt file, extra rows are filled as -1
| Pixel properties | Quadrant properties | ||||||
|---|---|---|---|---|---|---|---|
| Quadrant | DetID | PixID | Counts | Sigma | Mean | Median | Sigma |
| A | 10 | 83 | 198986 | 3325.91 | 285 | 281 | 59.7 |
| A | 7 | 3 | 47049 | 782.8 | 285 | 281 | 59.7 |
| A | 13 | 6 | 10518 | 171.35 | 285 | 281 | 59.7 |
| B | 15 | 36 | 26542 | 483.87 | 280 | 274 | 54.3 |
| B | 0 | 245 | 25332 | 461.58 | 280 | 274 | 54.3 |
| B | 5 | 255 | 22167 | 403.28 | 280 | 274 | 54.3 |
| C | 15 | 214 | 99930 | 1556.93 | 271 | 273 | 64.0 |
| C | 3 | 110 | 41758 | 648.12 | 271 | 273 | 64.0 |
| C | 14 | 254 | 4973 | 73.43 | 271 | 273 | 64.0 |
| D | 12 | 33 | 368024 | 5568.52 | 268 | 261 | 66.0 |
| D | 2 | 16 | 366222 | 5541.24 | 268 | 261 | 66.0 |
| D | 12 | 233 | 232408 | 3515.08 | 268 | 261 | 66.0 |
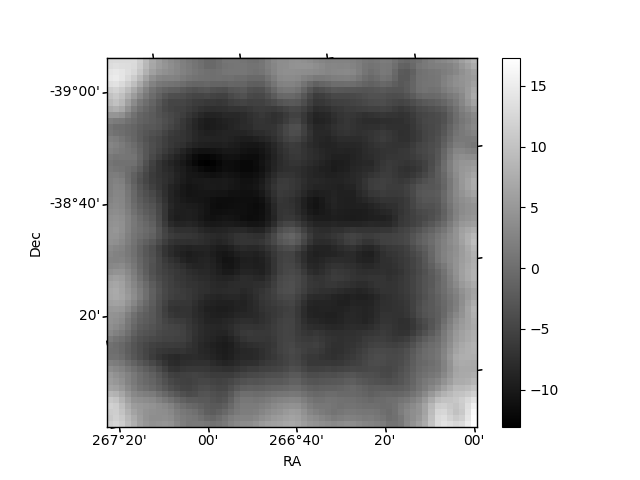
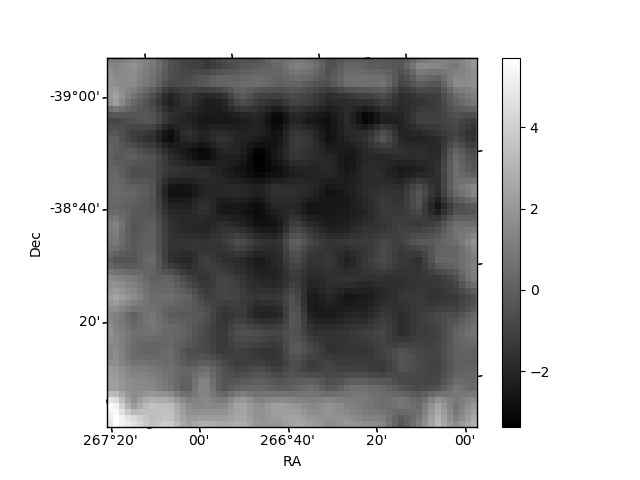
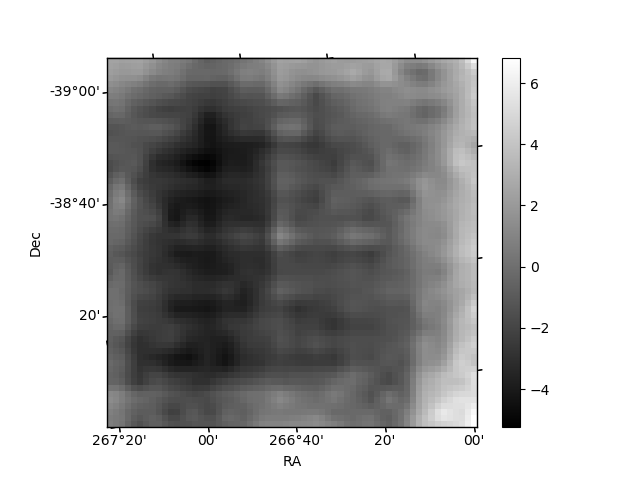
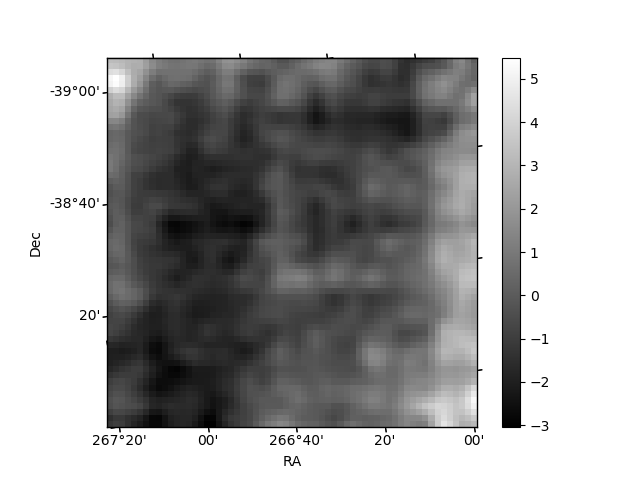
Histogram calculated using DETX and DETY for each event in the final _common_clean file
| Quadrant A | 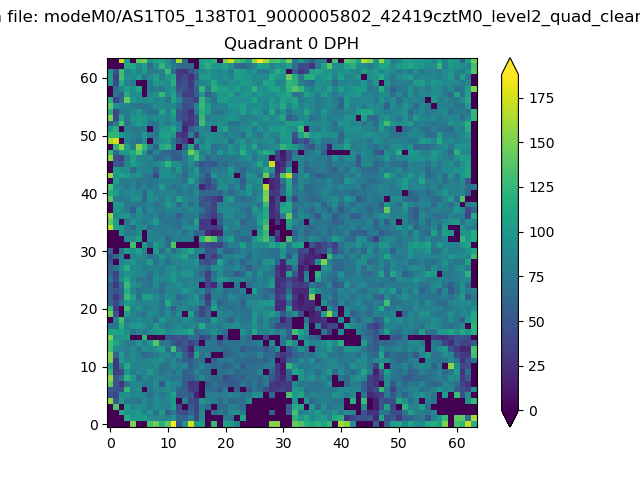 |
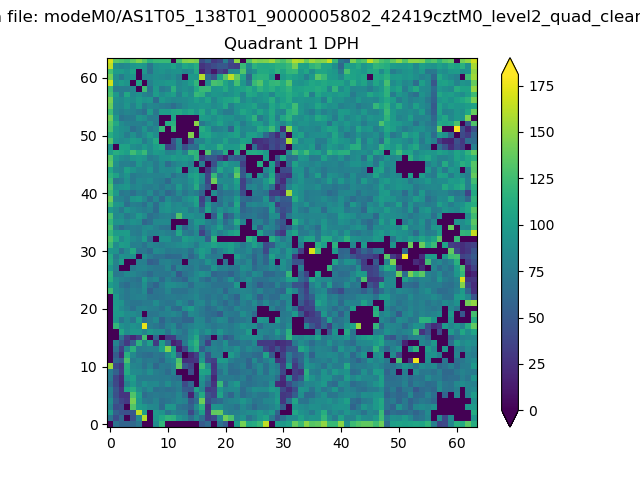 |
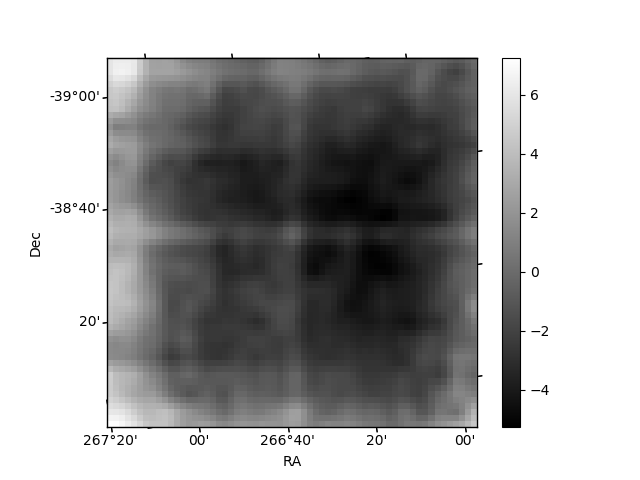
Quadrant B |
|---|---|---|---|
| Quadrant D | 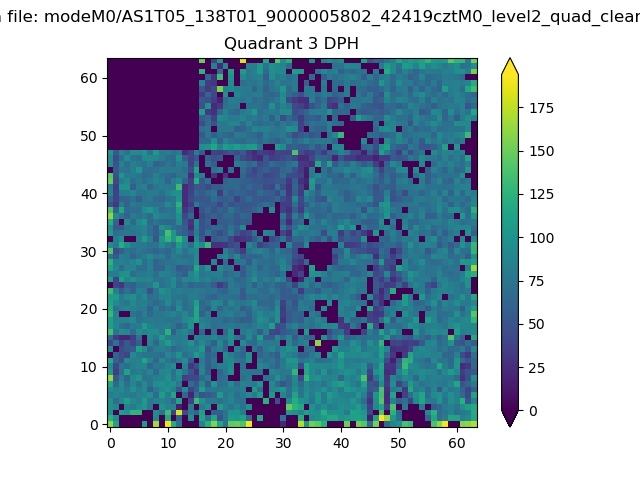 |
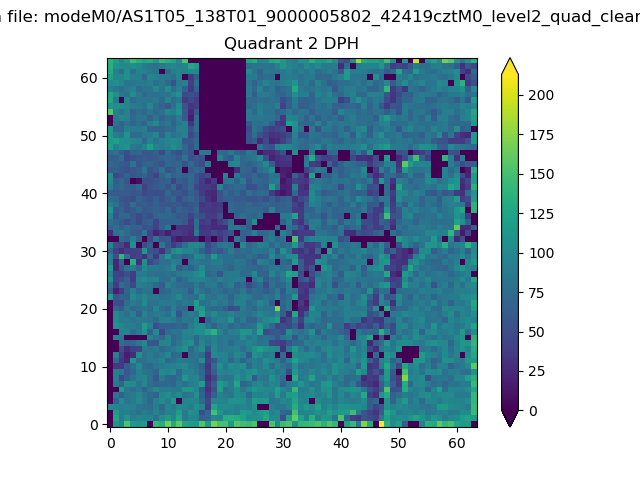 |
Quadrant C |
| Plot type | Count rate plots | Images |
|---|---|---|
| Comparison with Poisson distribution Blue bars denote a histogram of data divided into 1 sec bins. Red curve is a Poisson curve with rate = median count rate of data. |
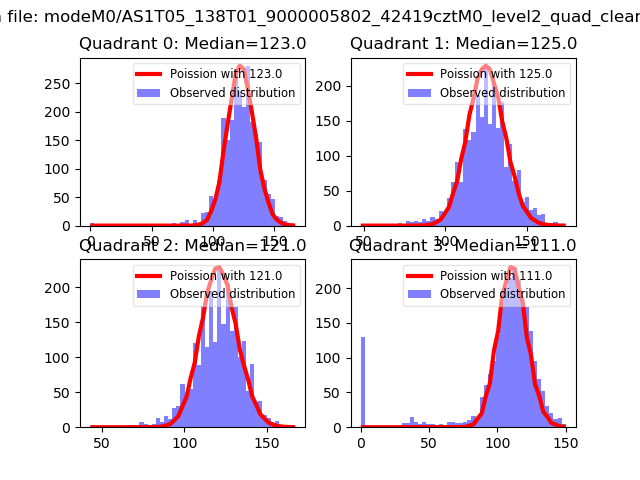 |
 |
| Quadrant-wise count rates Data is divided into 100 sec bins |
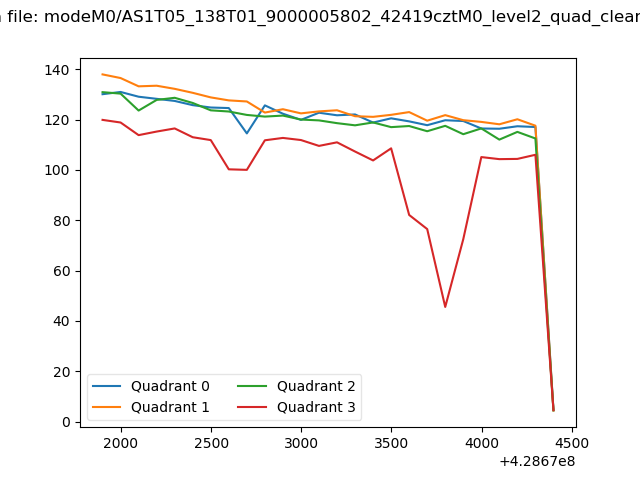 |
|
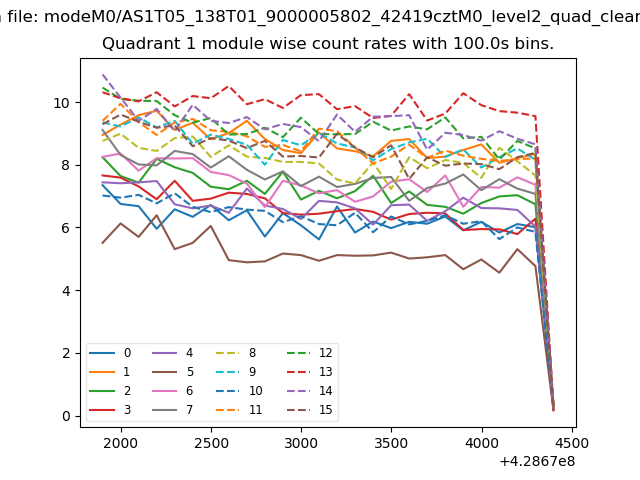
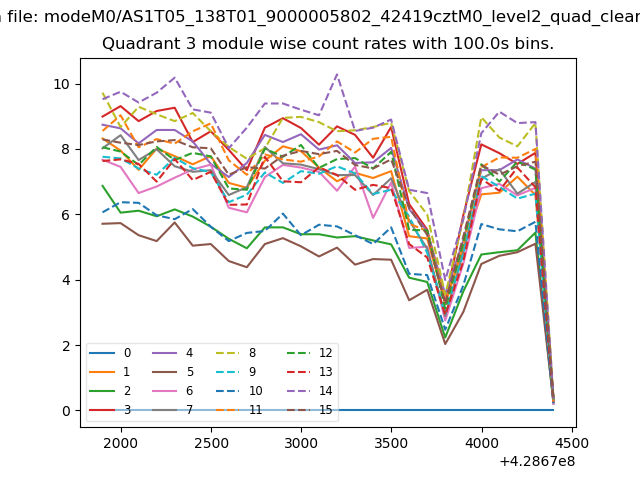
| Module-wise count rates for Quadrant A Data is divided into 100 sec bins |
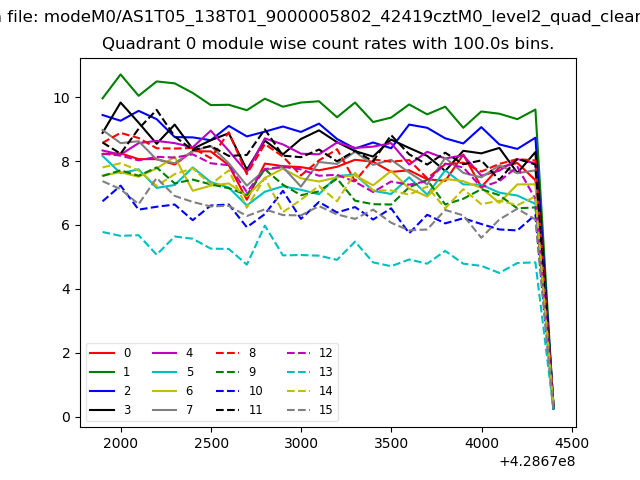 |
 |
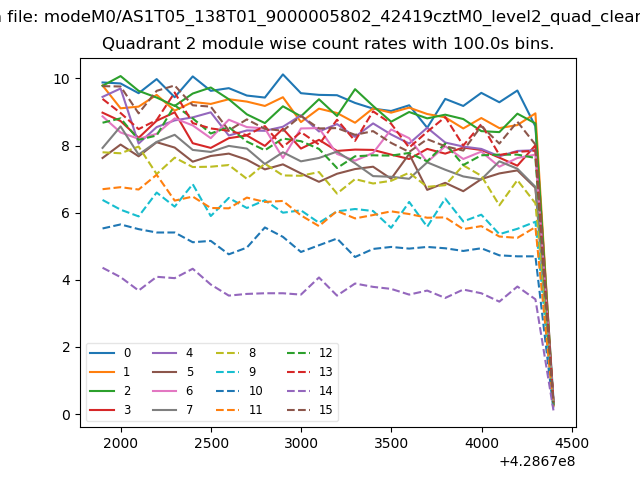
| Module-wise count rates for Quadrant B Data is divided into 100 sec bins |
 |
 |
| Module-wise count rates for Quadrant C Data is divided into 100 sec bins |
 |
 |
| Module-wise count rates for Quadrant D Data is divided into 100 sec bins |
 |
 |
| Parameter | Plot |
|---|---|
| CZT HV Monitor | 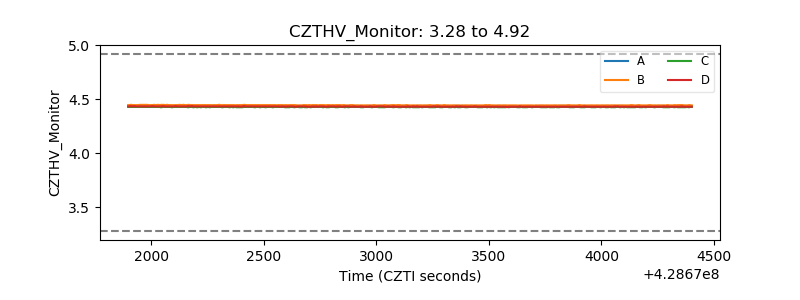 |
| D_VDD | 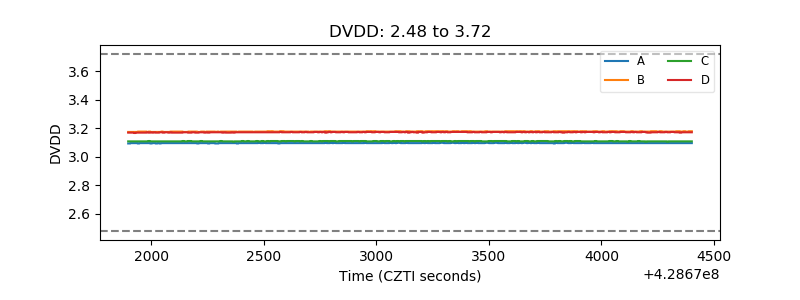 |
| Temperature 1 | 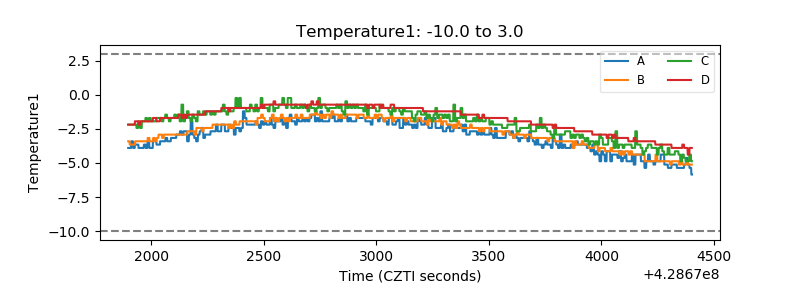 |
| Veto HV Monitor | 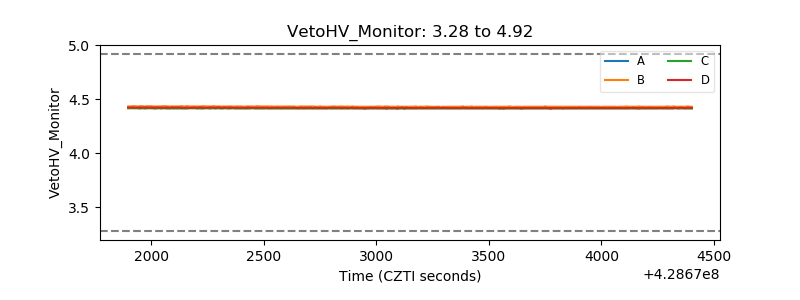 |
| Veto LLD | 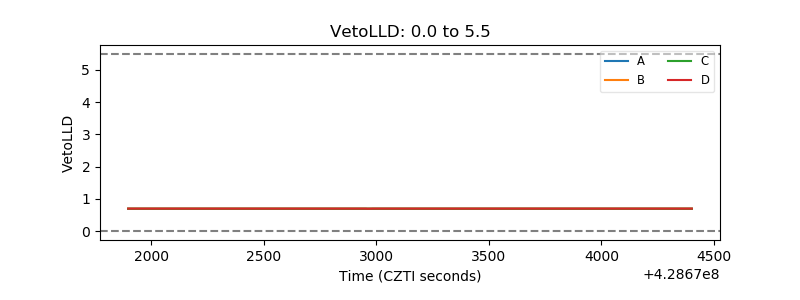 |
| Alpha Counter | 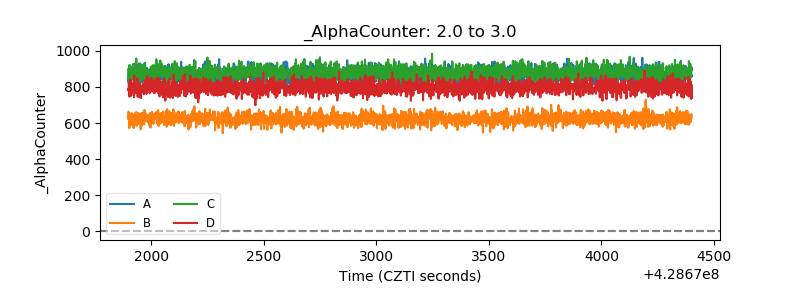 |
| _CPM_Rate | 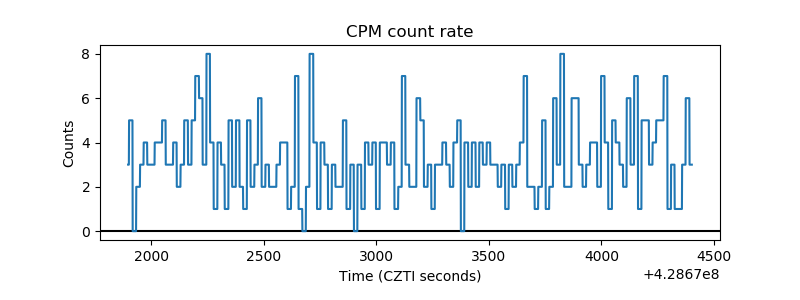 |
| CZT Counter | 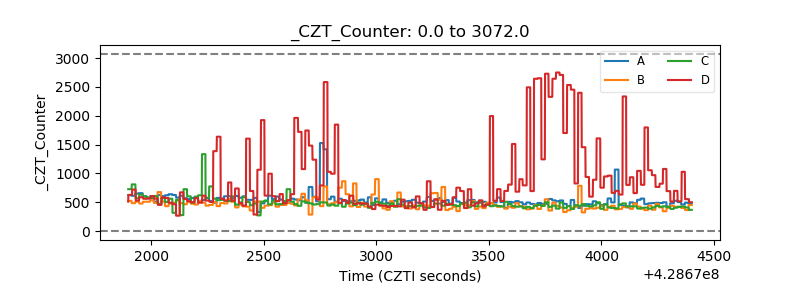 |
| +2.5 Volts monitor | 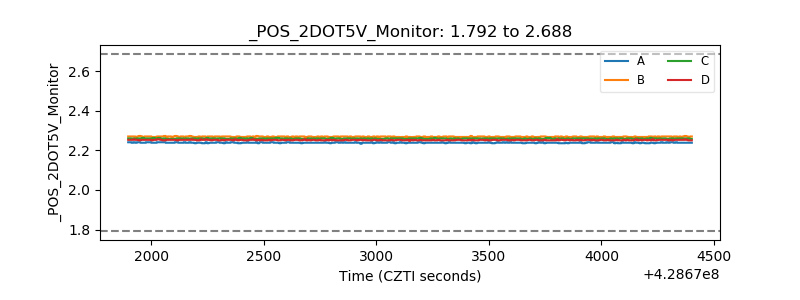 |
| +5 Volts monitor | 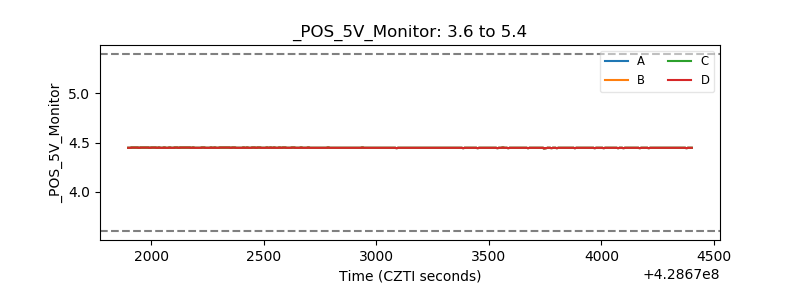 |
| _ROLL_ROT | 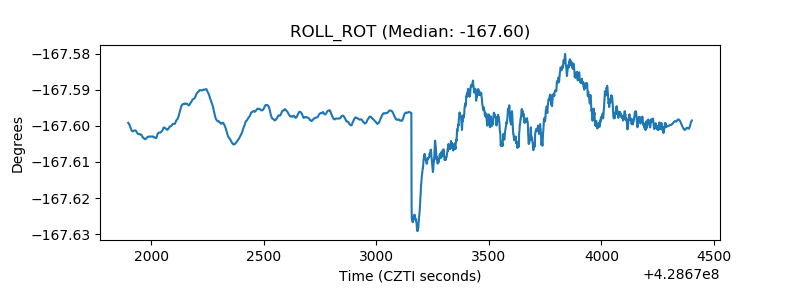 |
| _Roll_DEC | 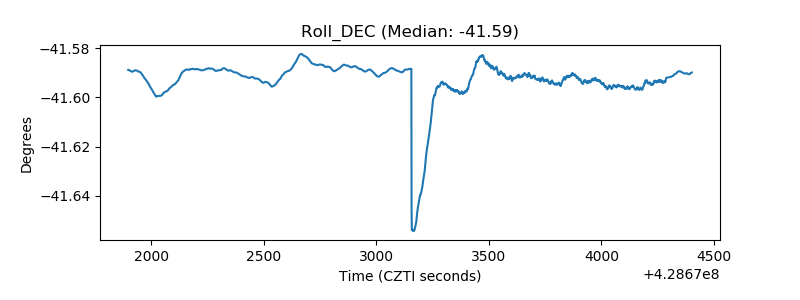 |
| _Roll_RA | 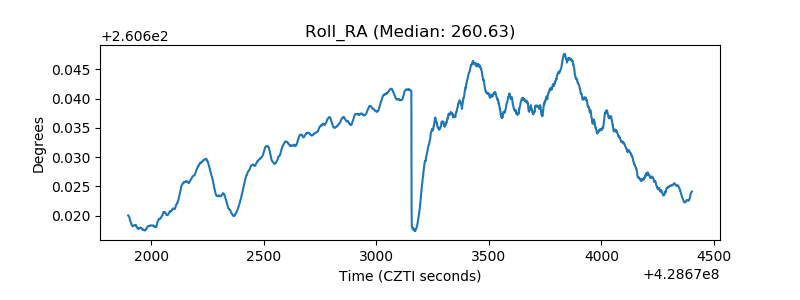 |
| Veto Counter | 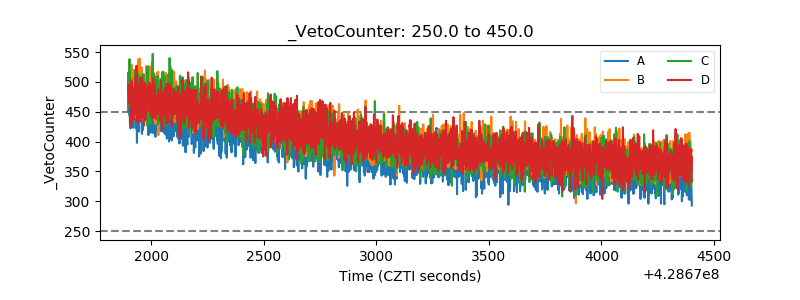 |