| Param | Original file | Final file |
|---|---|---|
| Filename | modeM0/AS1C07_001T10_9000005806_42429cztM0_level2.fits | modeM0/AS1C07_001T10_9000005806_42429cztM0_level2_quad_clean.evt |
| Size (bytes) | 307,019,520 | 87,912,000 |
| Size | 292.8 MB | 83.8 MB |
| Events in quadrant A | 2,835,248 | 597,175 |
| Events in quadrant B | 2,347,985 | 604,030 |
| Events in quadrant C | 2,420,559 | 575,418 |
| Events in quadrant D | 3,363,354 | 527,894 |
| Mode M9 | |||
|---|---|---|---|
| Quadrant | BADHDUFLAG | Total packets | Discarded packets |
| A | 0 | 27 | 0 |
| B | 0 | 28 | 0 |
| C | 0 | 28 | 0 |
| D | 0 | 28 | 0 |
| Mode SS | |||
|---|---|---|---|
| Quadrant | BADHDUFLAG | Total packets | Discarded packets |
| A | 0 | 104 | 0 |
| B | 0 | 104 | 0 |
| C | 0 | 104 | 0 |
| D | 0 | 104 | 0 |
| Mode M0 | |||
|---|---|---|---|
| Quadrant | BADHDUFLAG | Total packets | Discarded packets |
| A | 0 | 11421 | 2 |
| B | 0 | 10540 | 2 |
| C | 0 | 10373 | 2 |
| D | 0 | 13482 | 2 |
| Quadrant | Total seconds | Saturated seconds | Saturation percentage |
|---|---|---|---|
| A | 5100 | 13 | 0.254902% |
| B | 5100 | 12 | 0.235294% |
| C | 5100 | 5 | 0.098039% |
| D | 5100 | 160 | 3.137255% |
Noise dominated data is calculated using 1-second bins in cleaned event files. If a bin has >2000 counts, and if more than 50% of those come from <1% of pixels, then it is considered to be noise-dominated and hence unusable.
| Quadrant | # 1 sec bins | Bins with >0 counts | Bins with >2000 counts | High rate bins dominated by noise | Noise dominated (total time) | Noise dominated (detector-on time) | Marked lightcurve |
|---|---|---|---|---|---|---|---|
| A | 7042 | 5101 | 6 | 6 | 0.09% | 0.12% | 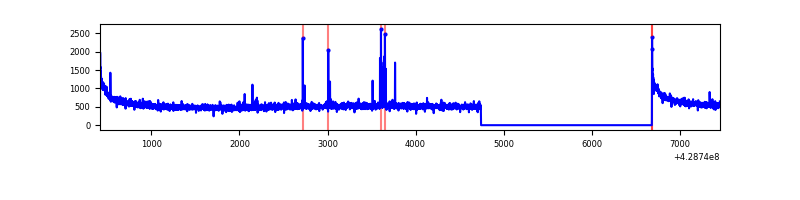 |
| B | 7042 | 5101 | 6 | 6 | 0.09% | 0.12% | 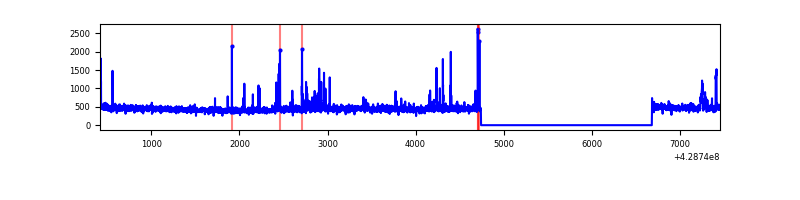 |
| C | 7042 | 5101 | 2 | 2 | 0.03% | 0.04% | 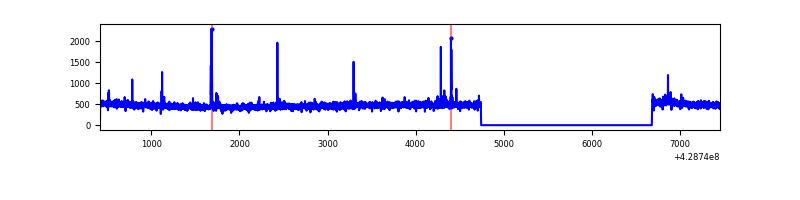 |
| D | 7042 | 5101 | 134 | 134 | 1.90% | 2.63% | 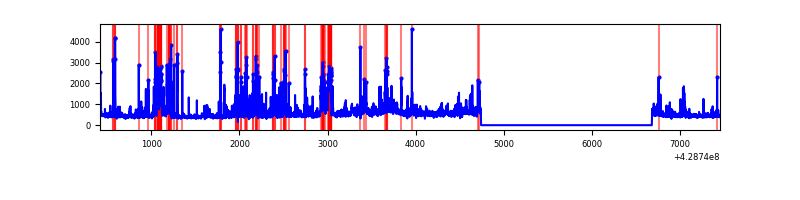 |
Top three noisy pixels from each quadrant. If the there are fewer than three noisy pixels in the level2.evt file, extra rows are filled as -1
| Pixel properties | Quadrant properties | ||||||
|---|---|---|---|---|---|---|---|
| Quadrant | DetID | PixID | Counts | Sigma | Mean | Median | Sigma |
| A | 10 | 83 | 546622 | 4679.97 | 570 | 560 | 116.7 |
| A | 7 | 3 | 41786 | 353.32 | 570 | 560 | 116.7 |
| A | 14 | 223 | 20095 | 167.42 | 570 | 560 | 116.7 |
| B | 3 | 112 | 41819 | 379.78 | 561 | 547 | 108.7 |
| B | 5 | 255 | 36865 | 334.19 | 561 | 547 | 108.7 |
| B | 5 | 172 | 29580 | 267.16 | 561 | 547 | 108.7 |
| C | 15 | 214 | 215203 | 1689.87 | 548 | 551 | 127.0 |
| C | 14 | 254 | 33407 | 258.66 | 548 | 551 | 127.0 |
| C | 0 | 207 | 12142 | 91.25 | 548 | 551 | 127.0 |
| D | 1 | 52 | 345016 | 2607.06 | 549 | 533 | 132.1 |
| D | 13 | 249 | 214929 | 1622.56 | 549 | 533 | 132.1 |
| D | 12 | 33 | 210309 | 1587.59 | 549 | 533 | 132.1 |
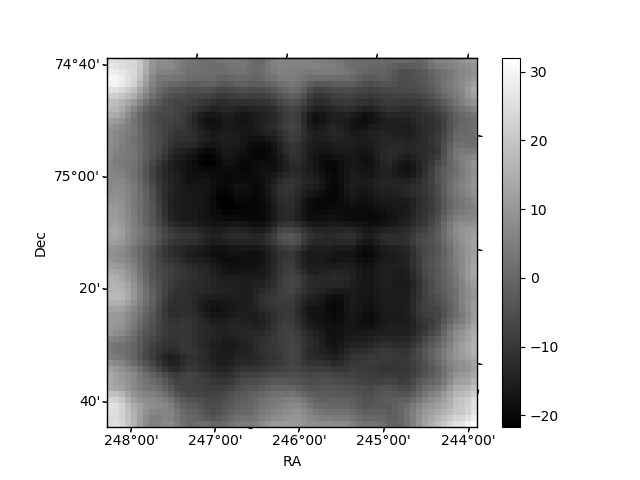
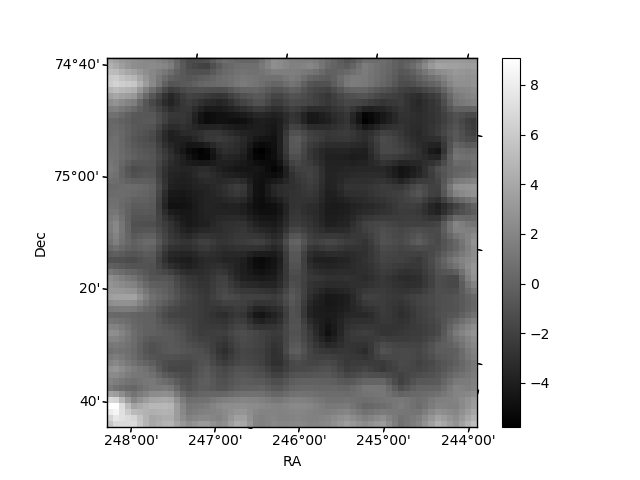
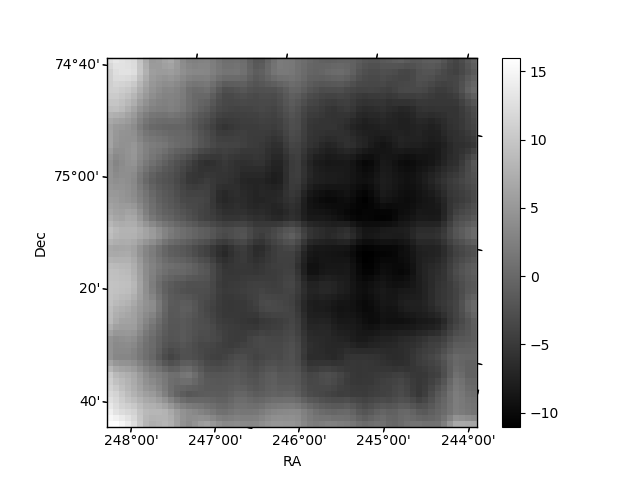
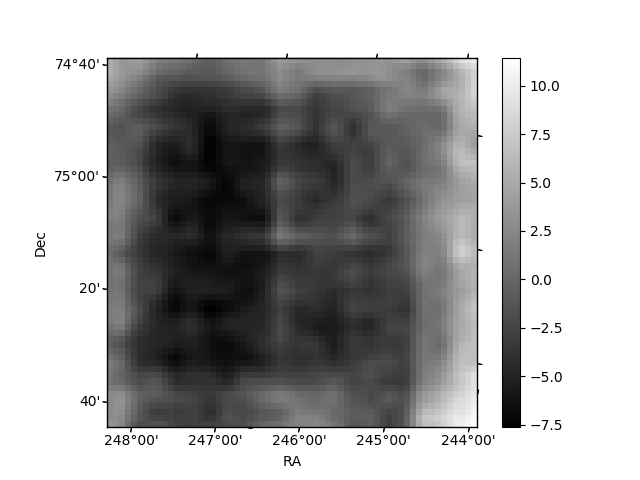
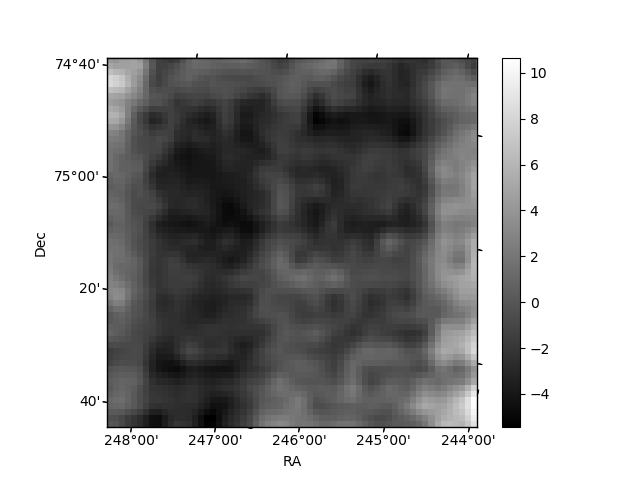
Histogram calculated using DETX and DETY for each event in the final _common_clean file
| Quadrant A | 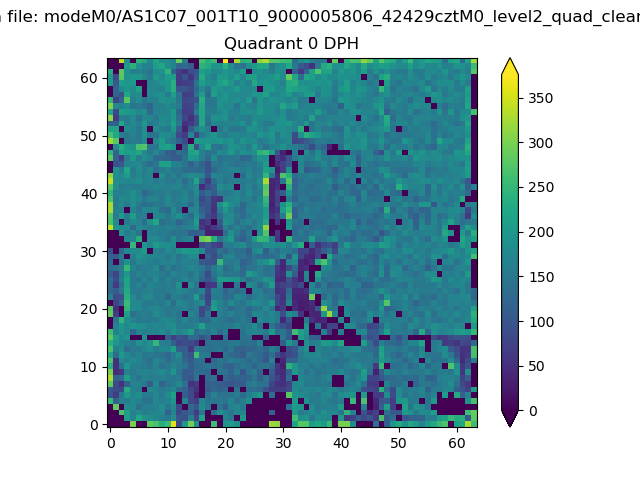 |
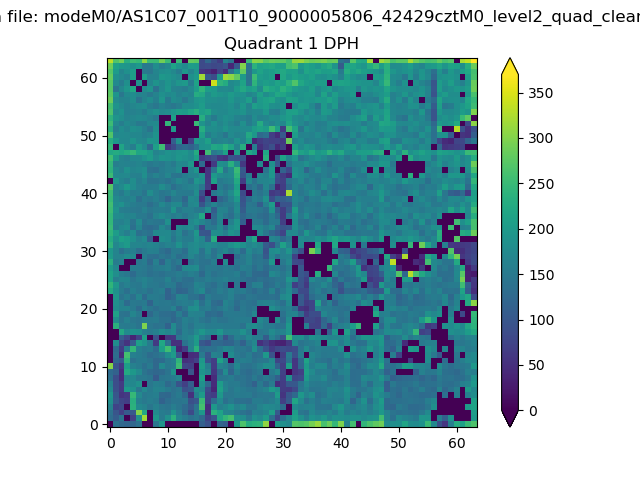 |
Quadrant B |
|---|---|---|---|
| Quadrant D | 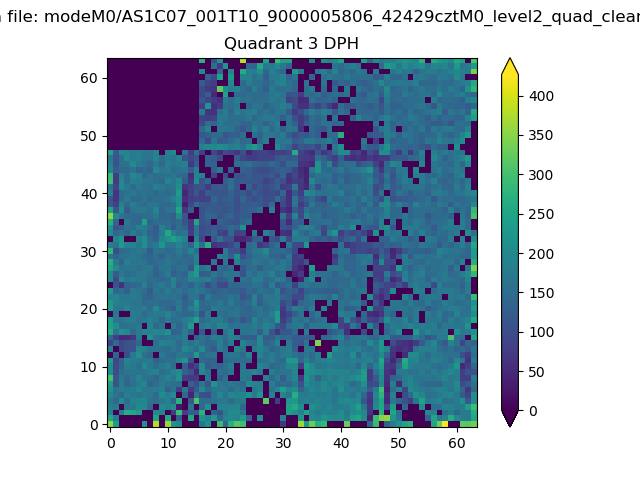 |
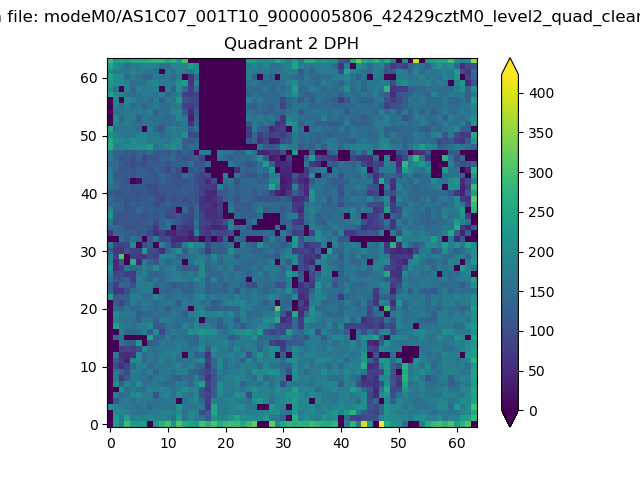 |
Quadrant C |
| Plot type | Count rate plots | Images |
|---|---|---|
| Comparison with Poisson distribution Blue bars denote a histogram of data divided into 1 sec bins. Red curve is a Poisson curve with rate = median count rate of data. |
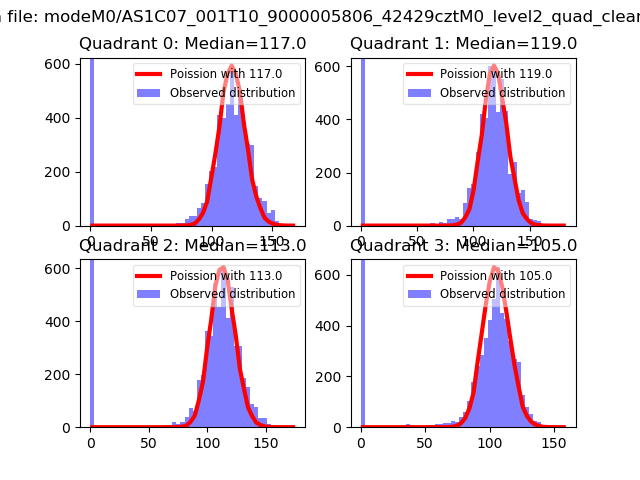 |
 |
| Quadrant-wise count rates Data is divided into 100 sec bins |
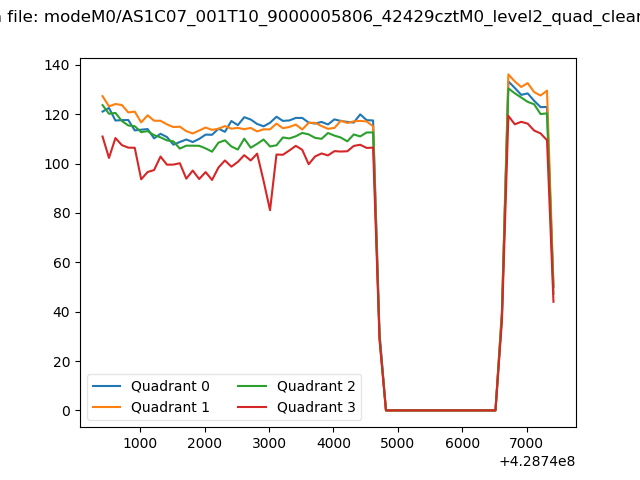 |
|
| Module-wise count rates for Quadrant A Data is divided into 100 sec bins |
 |
 |
| Module-wise count rates for Quadrant B Data is divided into 100 sec bins |
 |
 |
| Module-wise count rates for Quadrant C Data is divided into 100 sec bins |
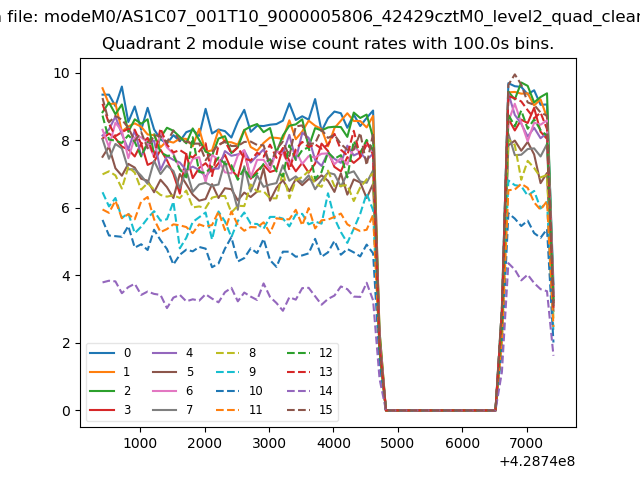 |
 |
| Module-wise count rates for Quadrant D Data is divided into 100 sec bins |
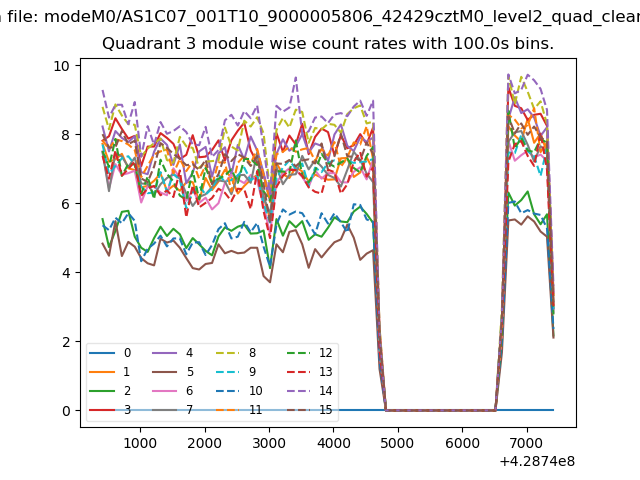 |
 |
| Parameter | Plot |
|---|---|
| CZT HV Monitor | 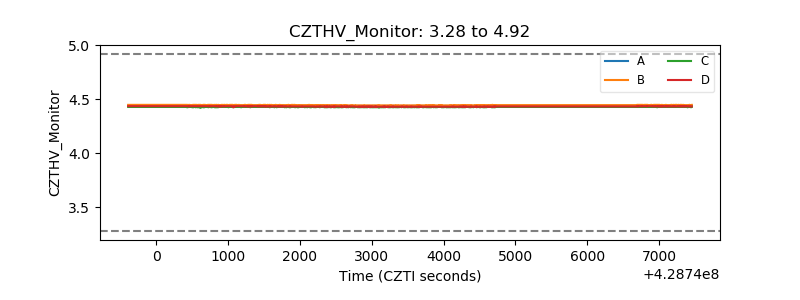 |
| D_VDD | 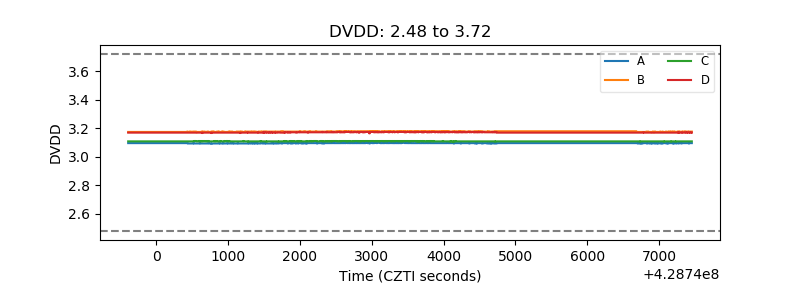 |
| Temperature 1 | 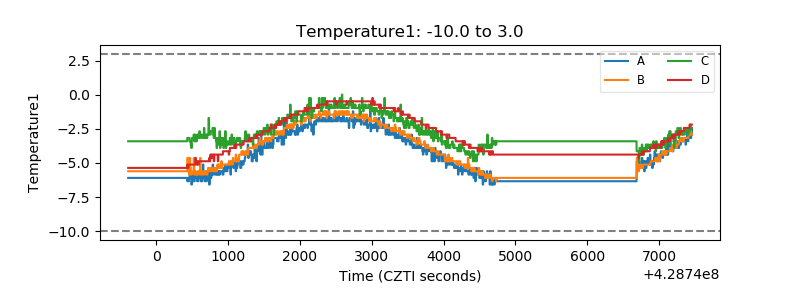 |
| Veto HV Monitor | 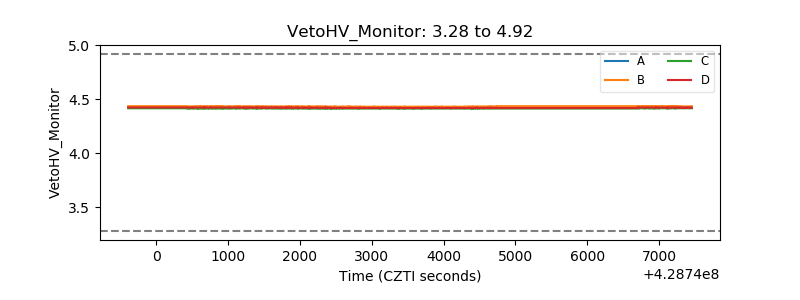 |
| Veto LLD | 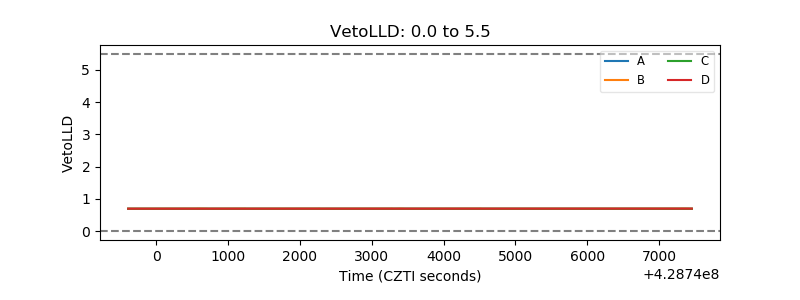 |
| Alpha Counter | 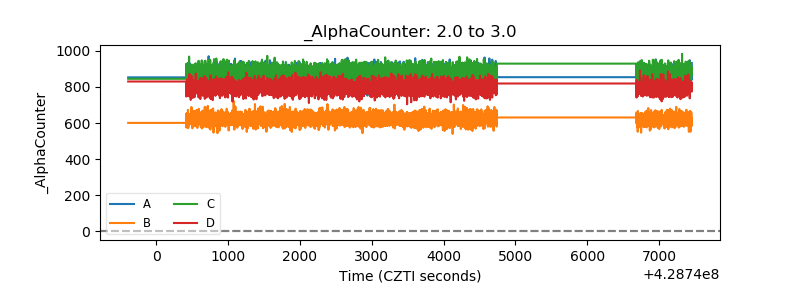 |
| _CPM_Rate | 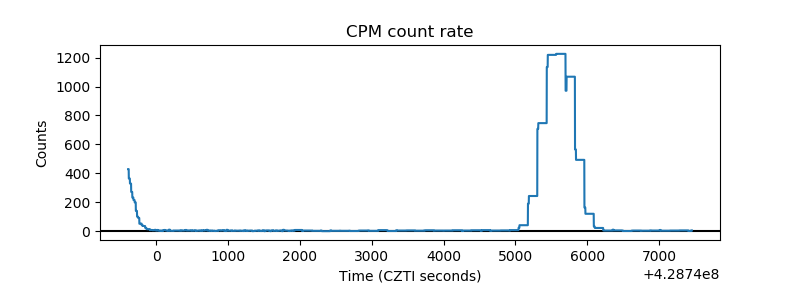 |
| CZT Counter | 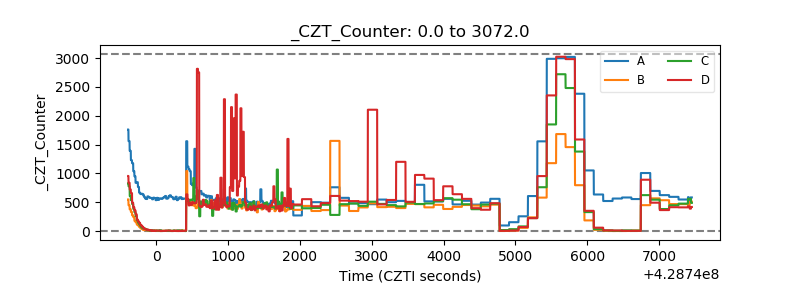 |
| +2.5 Volts monitor | 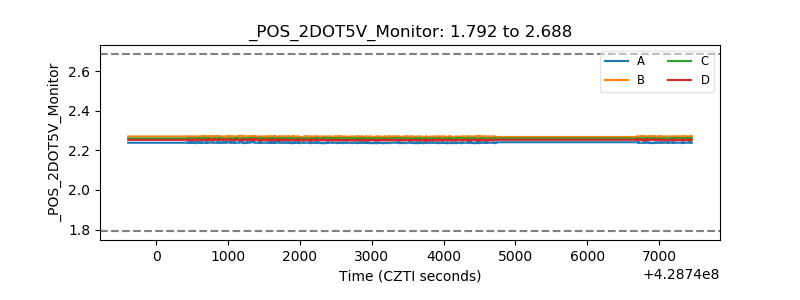 |
| +5 Volts monitor | 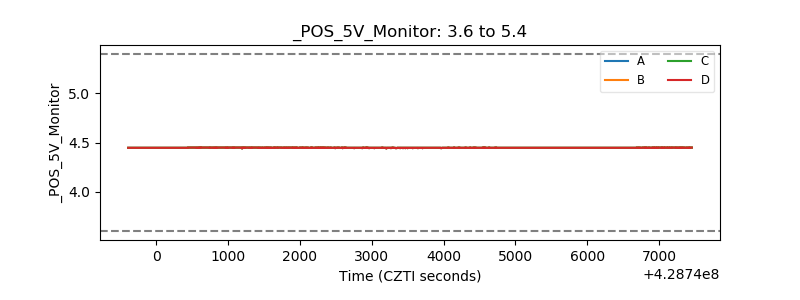 |
| _ROLL_ROT | 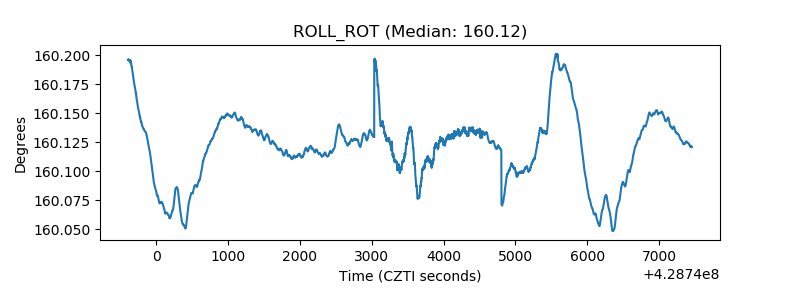 |
| _Roll_DEC | 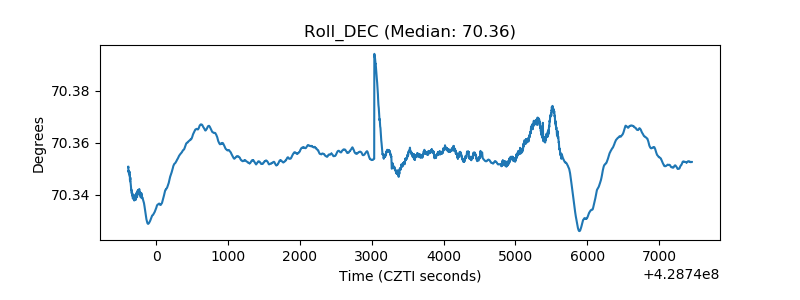 |
| _Roll_RA | 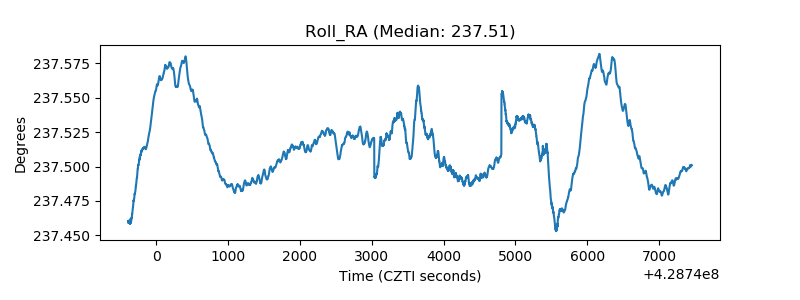 |
| Veto Counter | 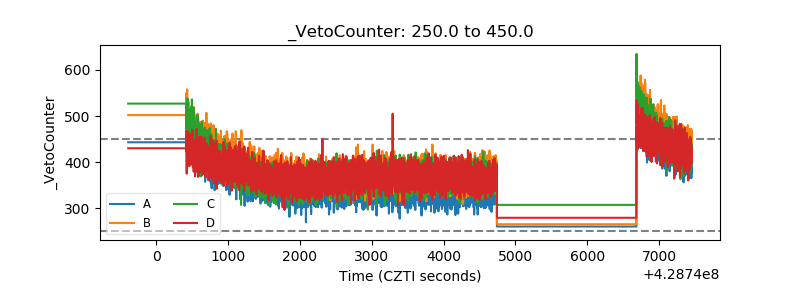 |