| Param | Original file | Final file |
|---|---|---|
| Filename | modeM0/AS1C07_001T10_9000005806_42430cztM0_level2.fits | modeM0/AS1C07_001T10_9000005806_42430cztM0_level2_quad_clean.evt |
| Size (bytes) | 344,073,600 | 88,246,080 |
| Size | 328.1 MB | 84.2 MB |
| Events in quadrant A | 2,966,041 | 618,401 |
| Events in quadrant B | 3,072,645 | 600,311 |
| Events in quadrant C | 2,451,988 | 588,190 |
| Events in quadrant D | 3,854,601 | 513,369 |
| Mode M9 | |||
|---|---|---|---|
| Quadrant | BADHDUFLAG | Total packets | Discarded packets |
| A | 0 | 28 | 0 |
| B | 0 | 29 | 0 |
| C | 0 | 29 | 0 |
| D | 0 | 29 | 0 |
| Mode SS | |||
|---|---|---|---|
| Quadrant | BADHDUFLAG | Total packets | Discarded packets |
| A | 0 | 102 | 0 |
| B | 0 | 102 | 0 |
| C | 0 | 102 | 0 |
| D | 0 | 102 | 0 |
| Mode M0 | |||
|---|---|---|---|
| Quadrant | BADHDUFLAG | Total packets | Discarded packets |
| A | 0 | 11732 | 2 |
| B | 0 | 12441 | 2 |
| C | 0 | 10303 | 2 |
| D | 0 | 14744 | 2 |
| Quadrant | Total seconds | Saturated seconds | Saturation percentage |
|---|---|---|---|
| A | 5021 | 38 | 0.756821% |
| B | 5021 | 200 | 3.983270% |
| C | 5021 | 4 | 0.079665% |
| D | 5021 | 429 | 8.544115% |
Noise dominated data is calculated using 1-second bins in cleaned event files. If a bin has >2000 counts, and if more than 50% of those come from <1% of pixels, then it is considered to be noise-dominated and hence unusable.
| Quadrant | # 1 sec bins | Bins with >0 counts | Bins with >2000 counts | High rate bins dominated by noise | Noise dominated (total time) | Noise dominated (detector-on time) | Marked lightcurve |
|---|---|---|---|---|---|---|---|
| A | 7054 | 5022 | 14 | 14 | 0.20% | 0.28% | 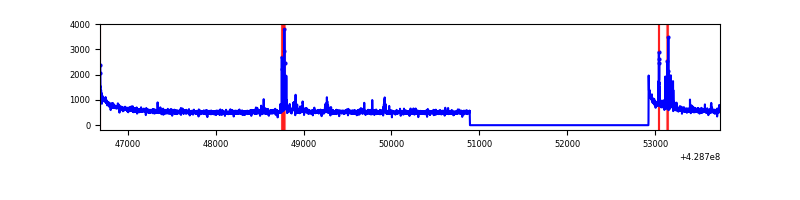 |
| B | 7054 | 5022 | 145 | 145 | 2.06% | 2.89% | 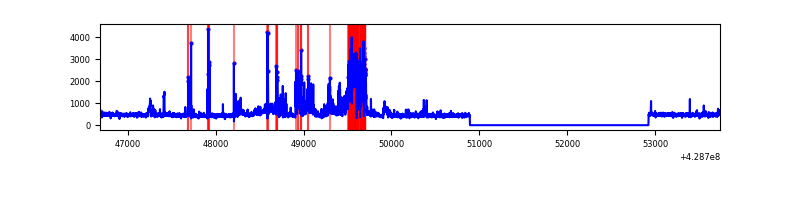 |
| C | 7054 | 5022 | 1 | 1 | 0.01% | 0.02% | 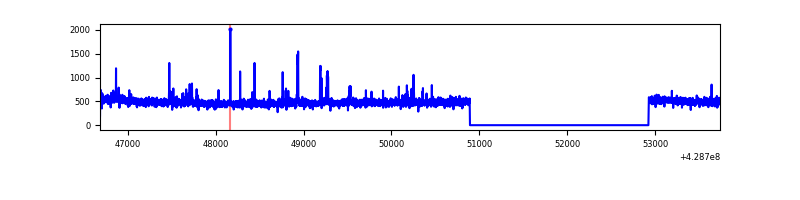 |
| D | 7054 | 5022 | 314 | 314 | 4.45% | 6.25% | 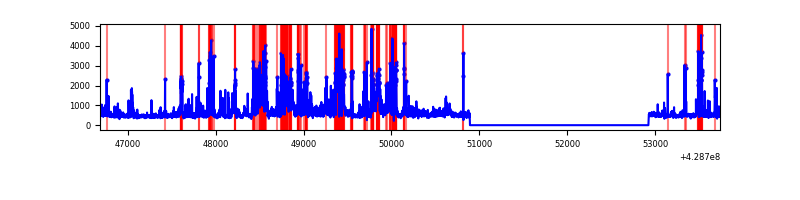 |
Top three noisy pixels from each quadrant. If the there are fewer than three noisy pixels in the level2.evt file, extra rows are filled as -1
| Pixel properties | Quadrant properties | ||||||
|---|---|---|---|---|---|---|---|
| Quadrant | DetID | PixID | Counts | Sigma | Mean | Median | Sigma |
| A | 10 | 83 | 564614 | 4838.93 | 575 | 566 | 116.6 |
| A | 14 | 223 | 82848 | 705.89 | 575 | 566 | 116.6 |
| A | 13 | 248 | 65664 | 558.47 | 575 | 566 | 116.6 |
| B | 0 | 186 | 487964 | 4596.76 | 553 | 538 | 106.0 |
| B | 4 | 141 | 174446 | 1640.07 | 553 | 538 | 106.0 |
| B | 5 | 255 | 135136 | 1269.35 | 553 | 538 | 106.0 |
| C | 15 | 214 | 212184 | 1667.8 | 551 | 554 | 126.9 |
| C | 7 | 220 | 39142 | 304.1 | 551 | 554 | 126.9 |
| C | 0 | 207 | 20341 | 155.94 | 551 | 554 | 126.9 |
| D | 1 | 52 | 765568 | 6010.24 | 533 | 517 | 127.3 |
| D | 13 | 249 | 708752 | 5563.89 | 533 | 517 | 127.3 |
| D | 10 | 199 | 58903 | 458.68 | 533 | 517 | 127.3 |
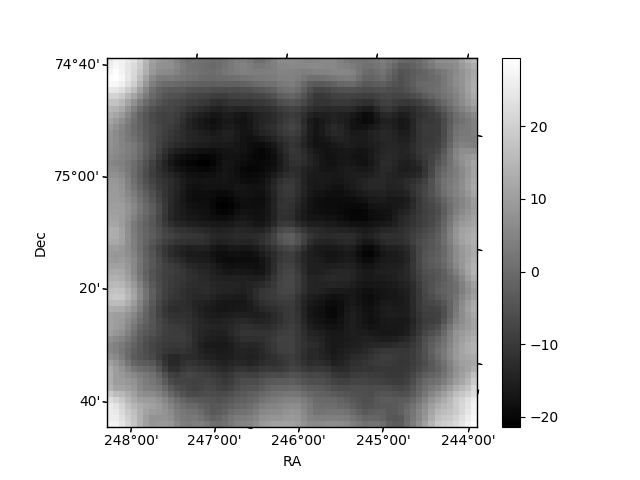
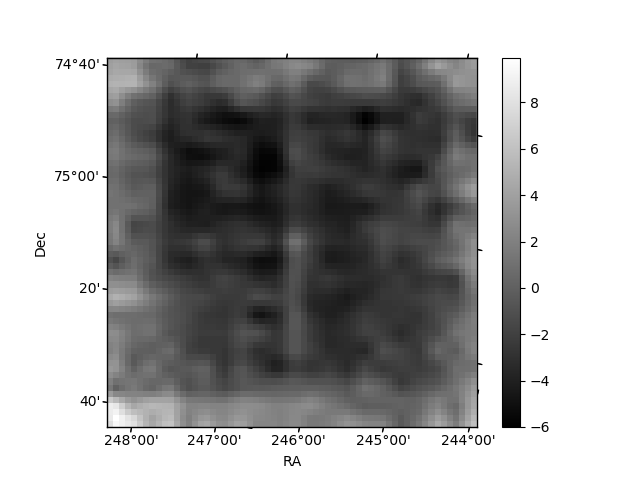
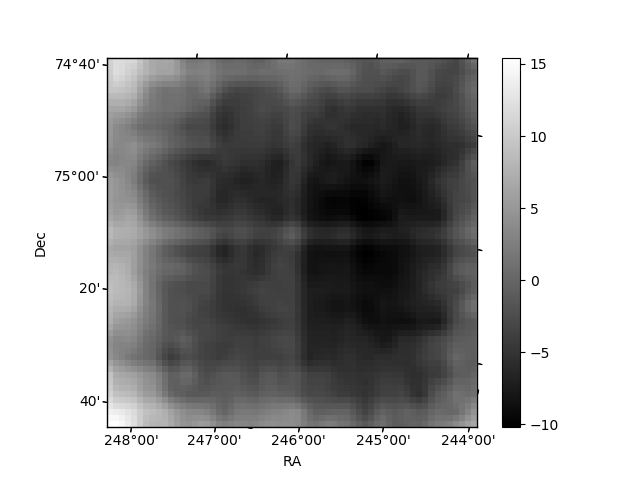
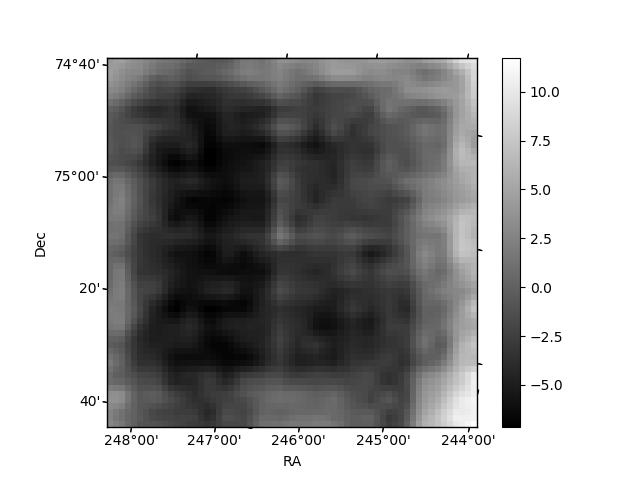
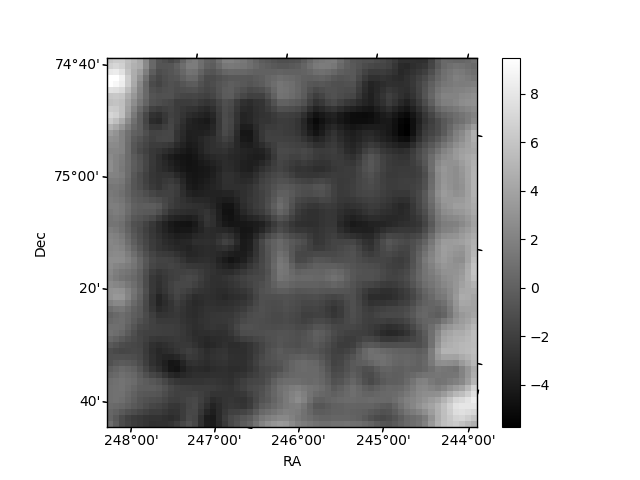
Histogram calculated using DETX and DETY for each event in the final _common_clean file
| Quadrant A | 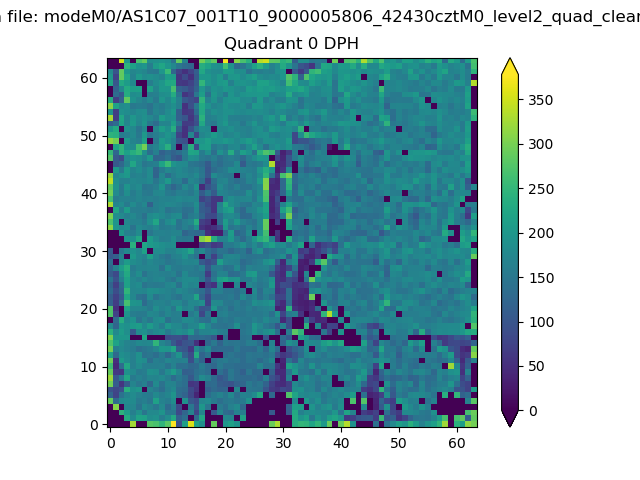 |
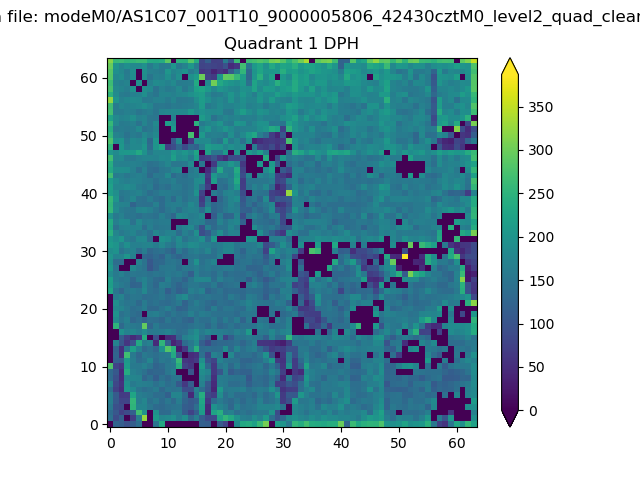 |
Quadrant B |
|---|---|---|---|
| Quadrant D | 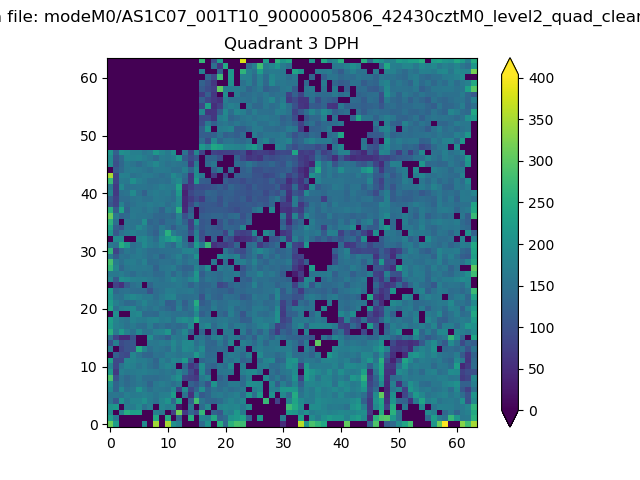 |
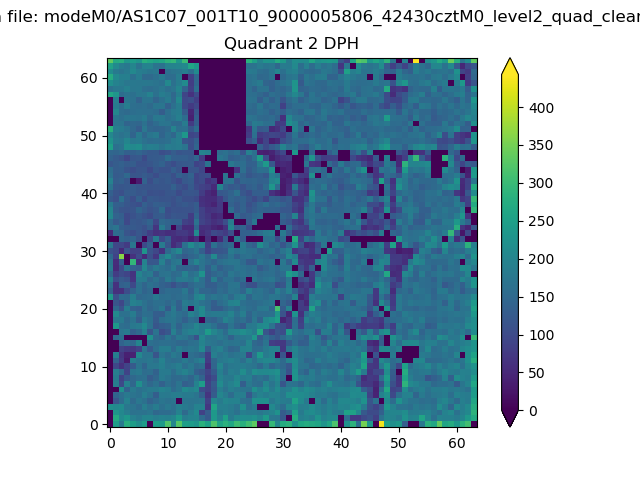 |
Quadrant C |
| Plot type | Count rate plots | Images |
|---|---|---|
| Comparison with Poisson distribution Blue bars denote a histogram of data divided into 1 sec bins. Red curve is a Poisson curve with rate = median count rate of data. |
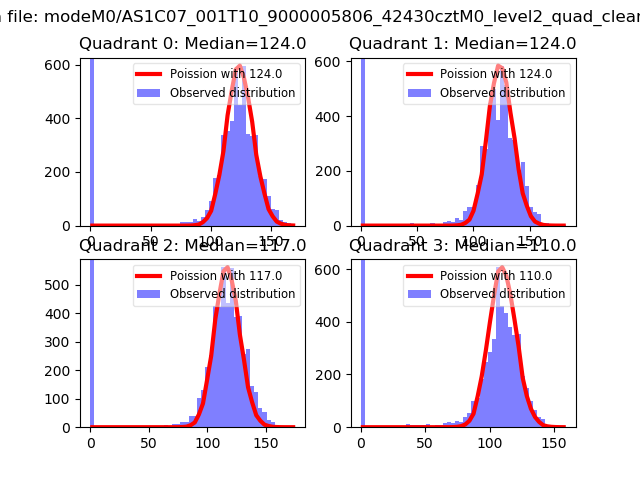 |
 |
| Quadrant-wise count rates Data is divided into 100 sec bins |
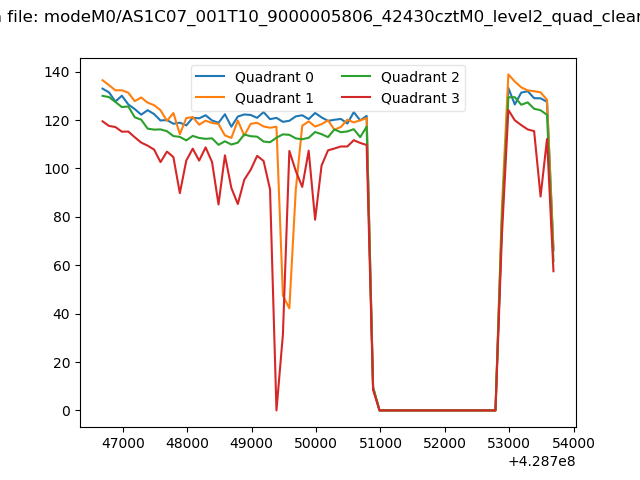 |
|
| Module-wise count rates for Quadrant A Data is divided into 100 sec bins |
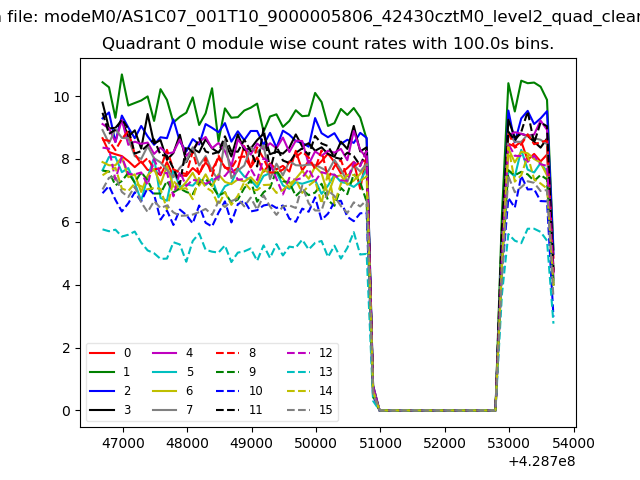 |
 |
| Module-wise count rates for Quadrant B Data is divided into 100 sec bins |
 |
 |
| Module-wise count rates for Quadrant C Data is divided into 100 sec bins |
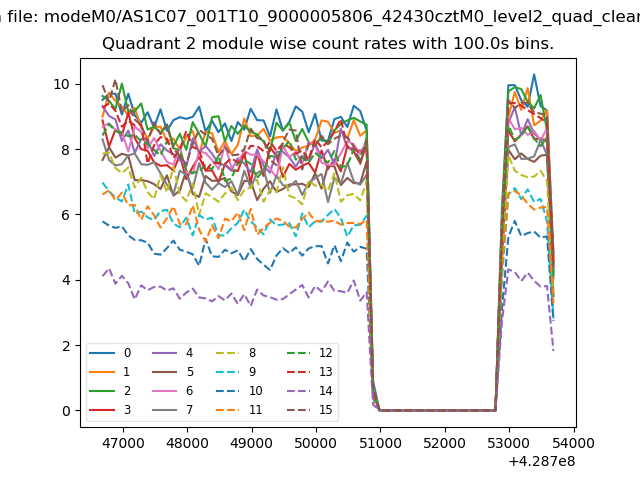 |
 |
| Module-wise count rates for Quadrant D Data is divided into 100 sec bins |
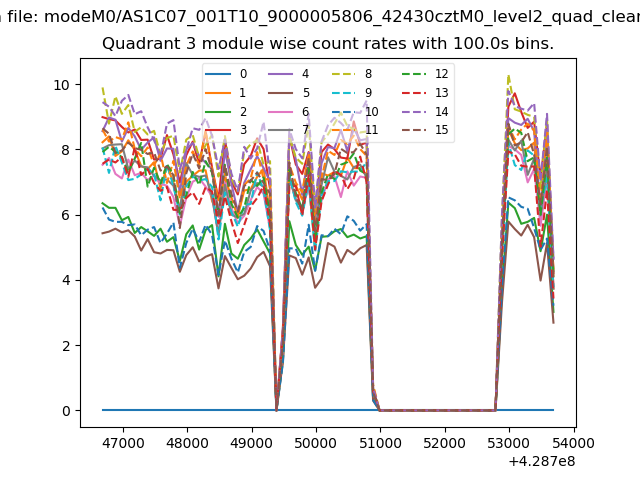 |
 |
| Parameter | Plot |
|---|---|
| CZT HV Monitor | 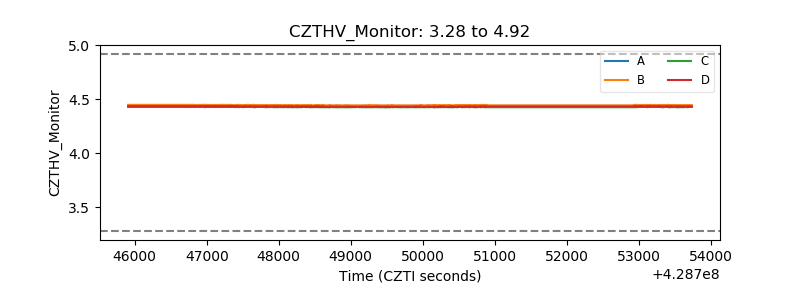 |
| D_VDD | 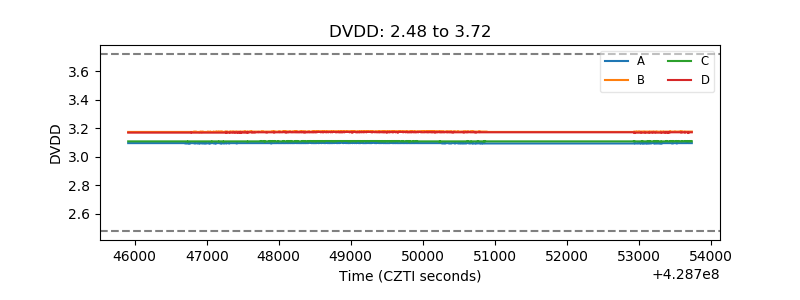 |
| Temperature 1 | 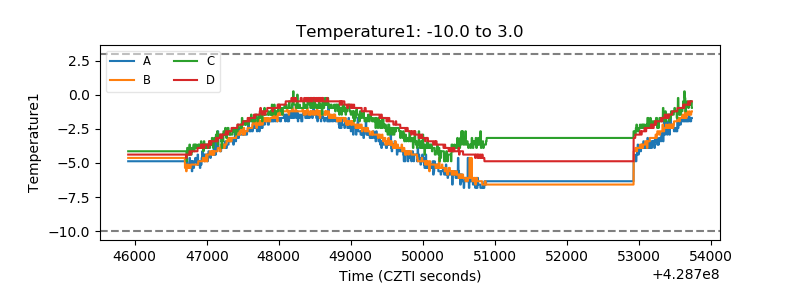 |
| Veto HV Monitor | 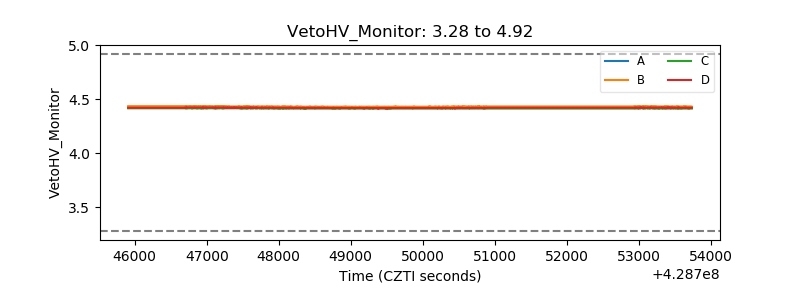 |
| Veto LLD | 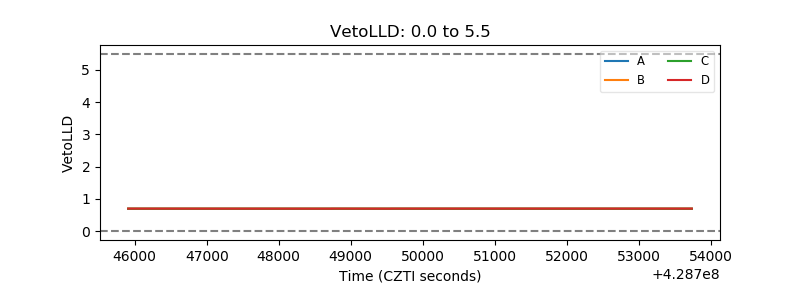 |
| Alpha Counter |  |
| _CPM_Rate | 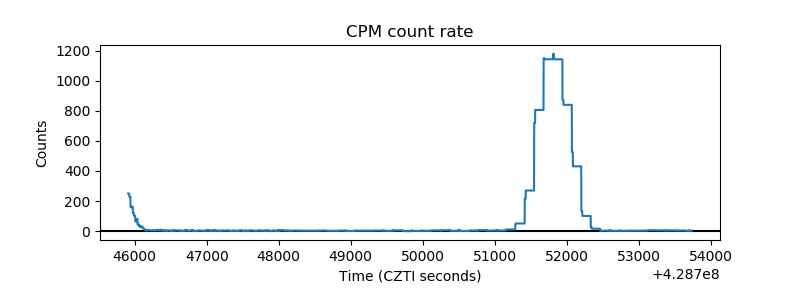 |
| CZT Counter | 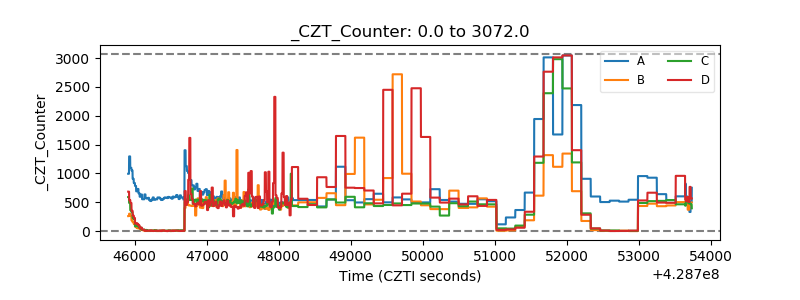 |
| +2.5 Volts monitor | 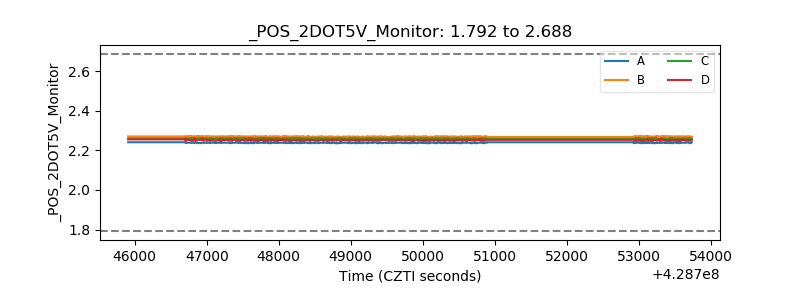 |
| +5 Volts monitor | 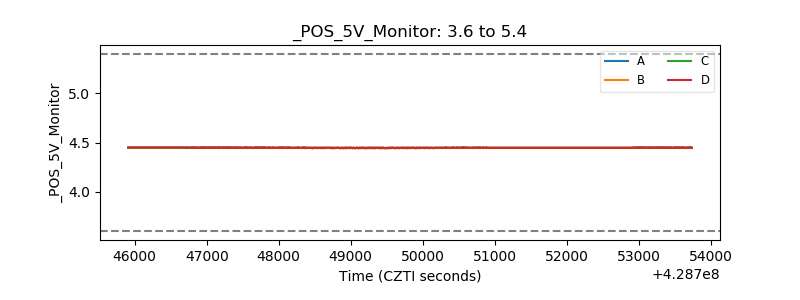 |
| _ROLL_ROT | 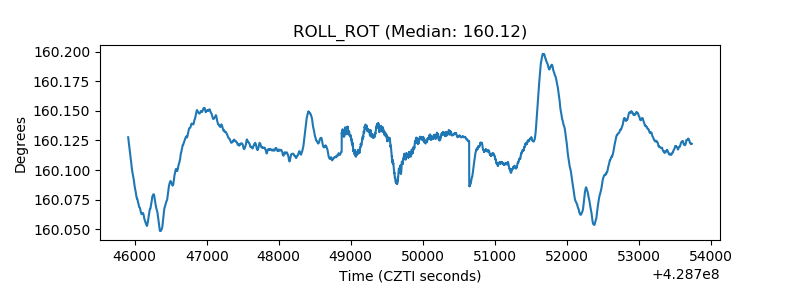 |
| _Roll_DEC | 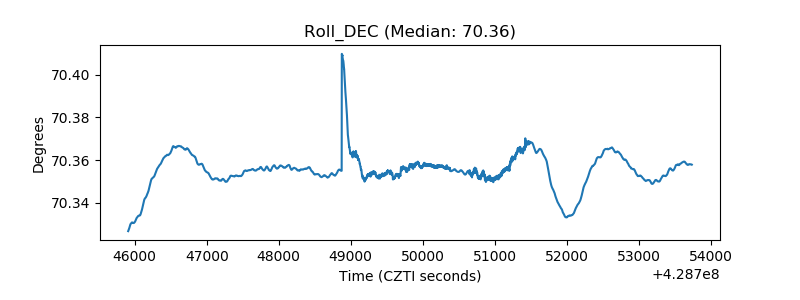 |
| _Roll_RA | 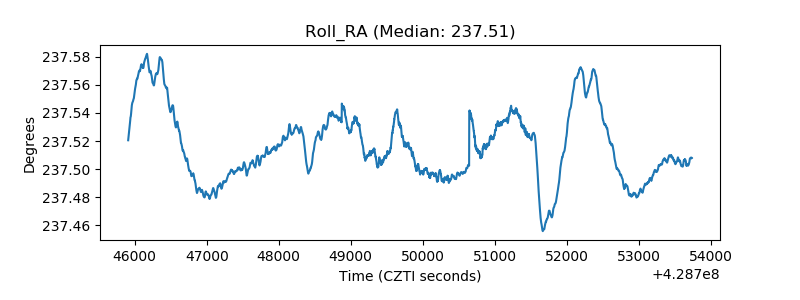 |
| Veto Counter | 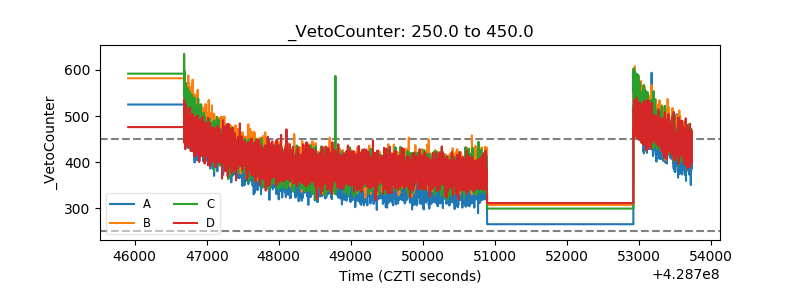 |