| Param | Original file | Final file |
|---|---|---|
| Filename | modeM0/AS1C07_001T10_9000005806_42432cztM0_level2.fits | modeM0/AS1C07_001T10_9000005806_42432cztM0_level2_quad_clean.evt |
| Size (bytes) | 420,134,400 | 86,270,400 |
| Size | 400.7 MB | 82.3 MB |
| Events in quadrant A | 4,221,118 | 579,973 |
| Events in quadrant B | 4,720,377 | 524,704 |
| Events in quadrant C | 2,458,236 | 593,641 |
| Events in quadrant D | 3,747,804 | 549,253 |
| Mode M9 | |||
|---|---|---|---|
| Quadrant | BADHDUFLAG | Total packets | Discarded packets |
| A | 0 | 22 | 0 |
| B | 0 | 23 | 0 |
| C | 0 | 23 | 0 |
| D | 0 | 23 | 0 |
| Mode SS | |||
|---|---|---|---|
| Quadrant | BADHDUFLAG | Total packets | Discarded packets |
| A | 0 | 108 | 0 |
| B | 0 | 108 | 0 |
| C | 0 | 108 | 0 |
| D | 0 | 108 | 0 |
| Mode M0 | |||
|---|---|---|---|
| Quadrant | BADHDUFLAG | Total packets | Discarded packets |
| A | 0 | 15898 | 2 |
| B | 0 | 17658 | 2 |
| C | 0 | 10538 | 2 |
| D | 0 | 14638 | 2 |
| Quadrant | Total seconds | Saturated seconds | Saturation percentage |
|---|---|---|---|
| A | 5200 | 453 | 8.711538% |
| B | 5200 | 892 | 17.153846% |
| C | 5200 | 4 | 0.076923% |
| D | 5199 | 174 | 3.346797% |
Noise dominated data is calculated using 1-second bins in cleaned event files. If a bin has >2000 counts, and if more than 50% of those come from <1% of pixels, then it is considered to be noise-dominated and hence unusable.
| Quadrant | # 1 sec bins | Bins with >0 counts | Bins with >2000 counts | High rate bins dominated by noise | Noise dominated (total time) | Noise dominated (detector-on time) | Marked lightcurve |
|---|---|---|---|---|---|---|---|
| A | 7322 | 5201 | 377 | 377 | 5.15% | 7.25% | 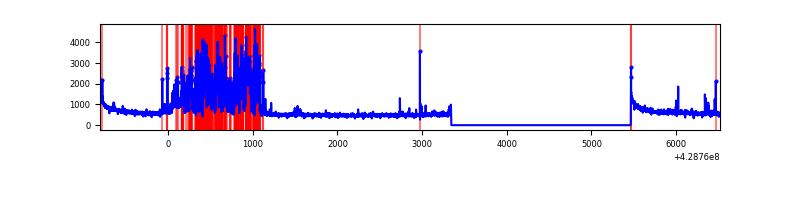 |
| B | 7322 | 5201 | 731 | 731 | 9.98% | 14.05% | 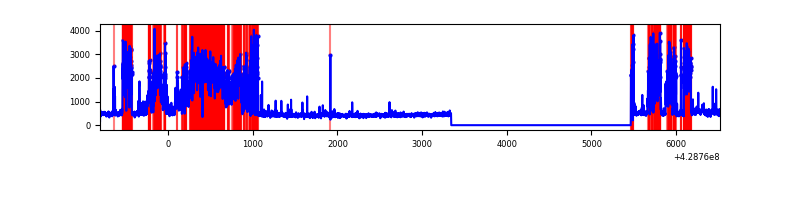 |
| C | 7322 | 5201 | 0 | 0 | 0.00% | 0.00% | 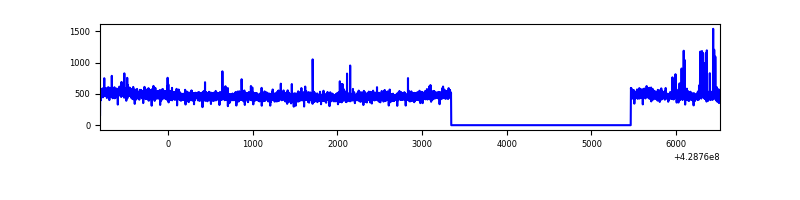 |
| D | 7321 | 5200 | 149 | 149 | 2.04% | 2.87% | 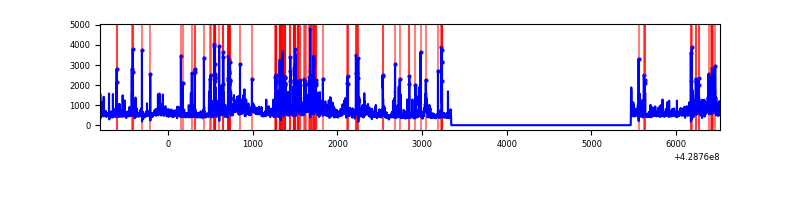 |
Top three noisy pixels from each quadrant. If the there are fewer than three noisy pixels in the level2.evt file, extra rows are filled as -1
| Pixel properties | Quadrant properties | ||||||
|---|---|---|---|---|---|---|---|
| Quadrant | DetID | PixID | Counts | Sigma | Mean | Median | Sigma |
| A | 14 | 223 | 1395786 | 12179.68 | 560 | 551 | 114.6 |
| A | 10 | 83 | 603110 | 5260.03 | 560 | 551 | 114.6 |
| A | 13 | 248 | 27133 | 232.05 | 560 | 551 | 114.6 |
| B | 0 | 186 | 2488384 | 24850.44 | 533 | 519 | 100.1 |
| B | 5 | 255 | 33071 | 325.15 | 533 | 519 | 100.1 |
| B | 5 | 172 | 31463 | 309.09 | 533 | 519 | 100.1 |
| C | 15 | 214 | 220987 | 1706.08 | 561 | 564 | 129.2 |
| C | 10 | 34 | 27015 | 204.73 | 561 | 564 | 129.2 |
| C | 7 | 220 | 7791 | 55.94 | 561 | 564 | 129.2 |
| D | 12 | 33 | 452014 | 3254.67 | 561 | 543 | 138.7 |
| D | 1 | 52 | 448990 | 3232.87 | 561 | 543 | 138.7 |
| D | 10 | 118 | 284362 | 2046.06 | 561 | 543 | 138.7 |
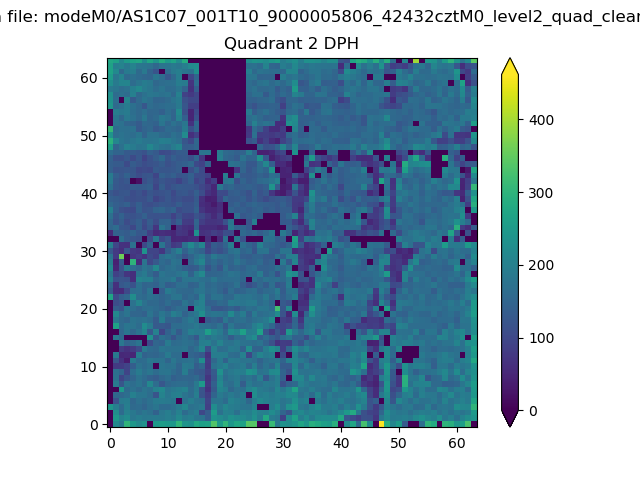
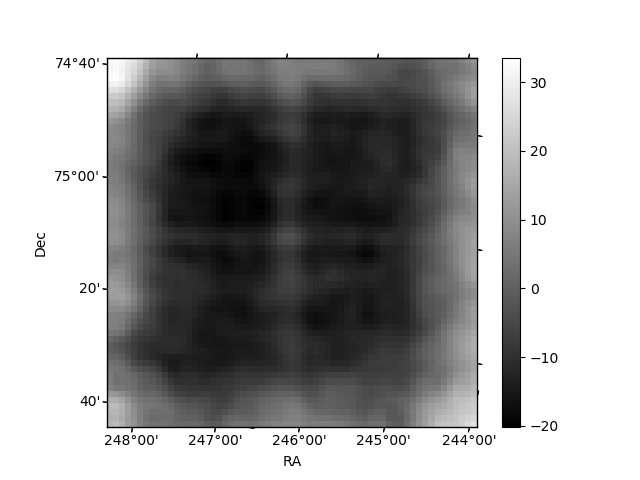
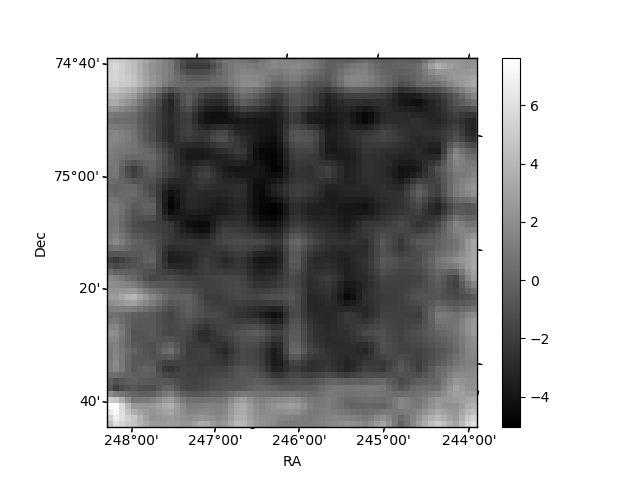
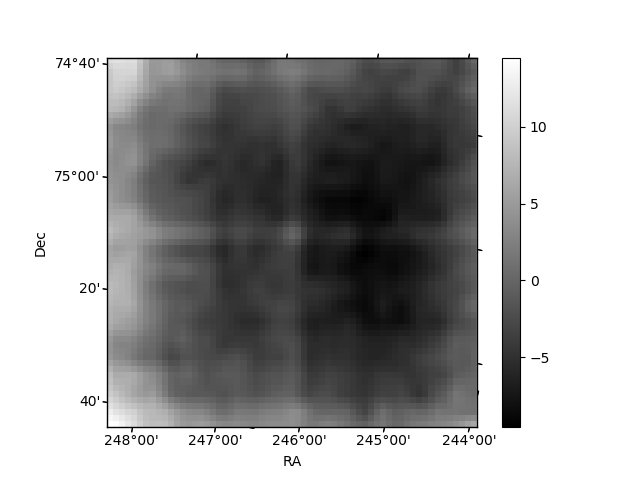
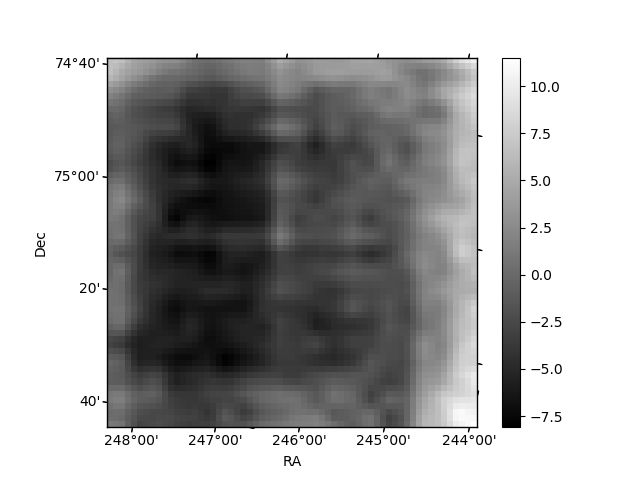
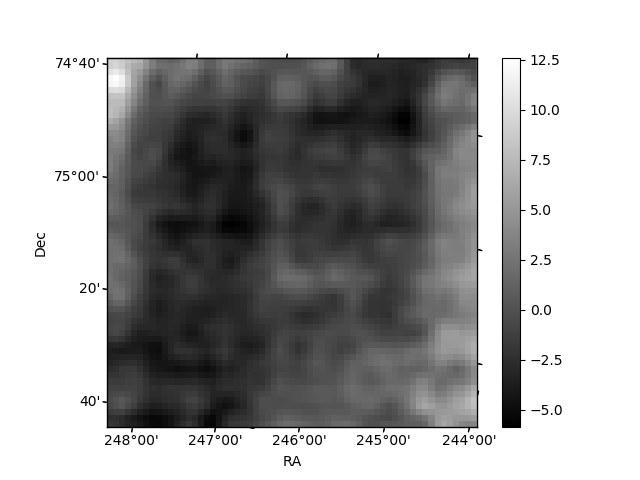
Histogram calculated using DETX and DETY for each event in the final _common_clean file
| Quadrant A | 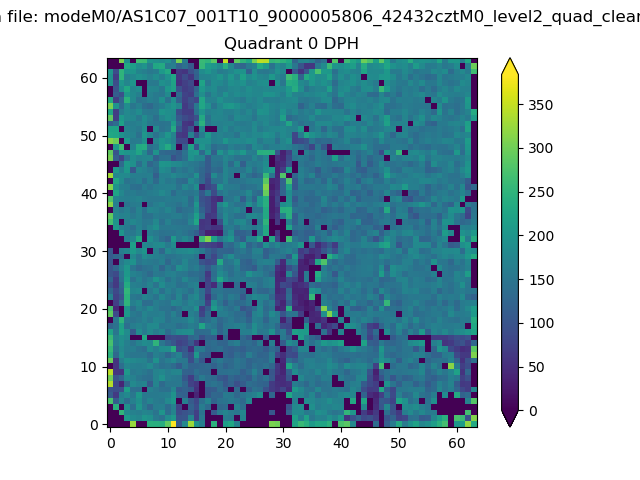 |
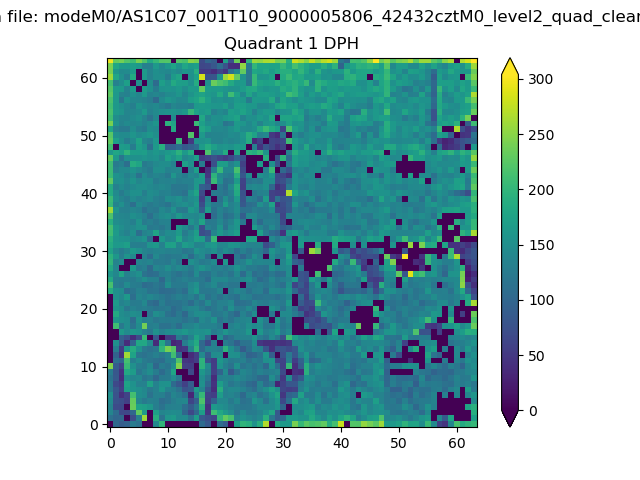 |
Quadrant B |
|---|---|---|---|
| Quadrant D | 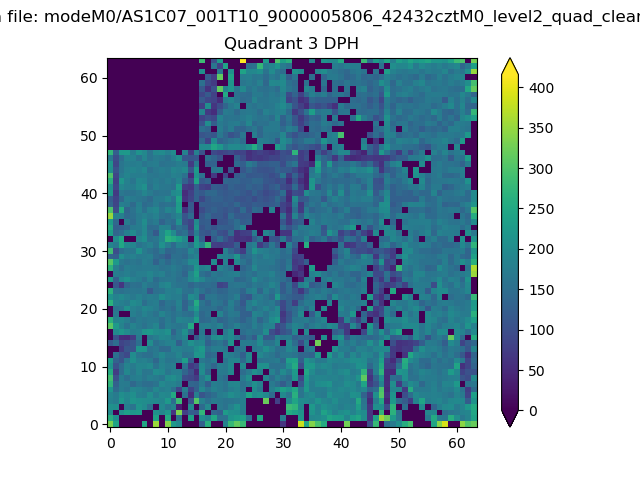 |
 |
Quadrant C |
| Plot type | Count rate plots | Images |
|---|---|---|
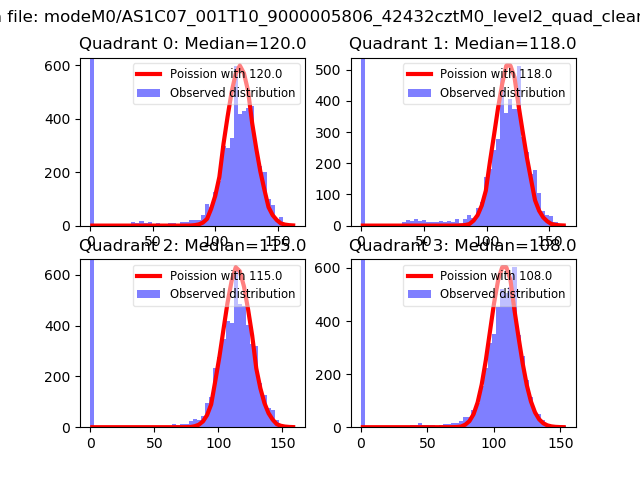
| Comparison with Poisson distribution Blue bars denote a histogram of data divided into 1 sec bins. Red curve is a Poisson curve with rate = median count rate of data. |
 |
 |
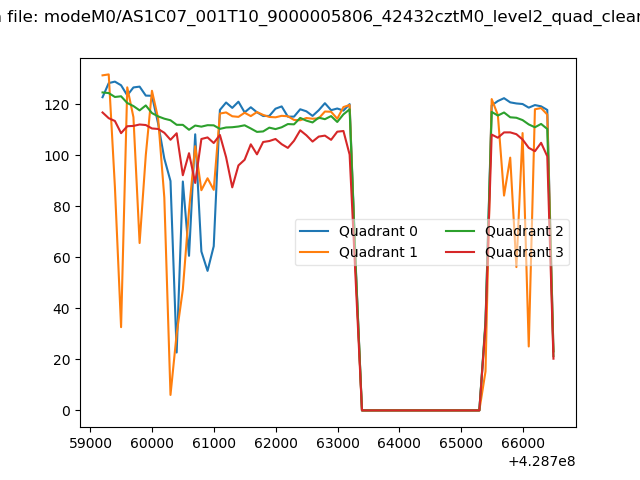
| Quadrant-wise count rates Data is divided into 100 sec bins |
 |
|
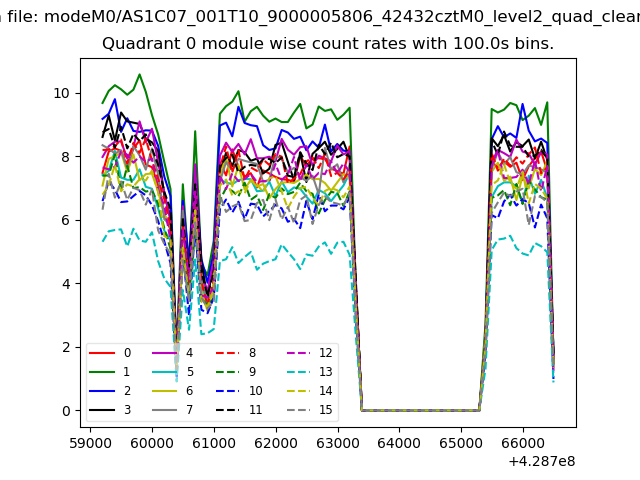
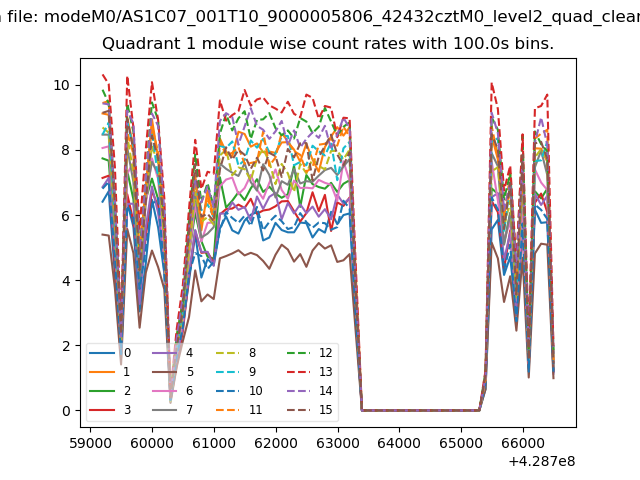
| Module-wise count rates for Quadrant A Data is divided into 100 sec bins |
 |
 |
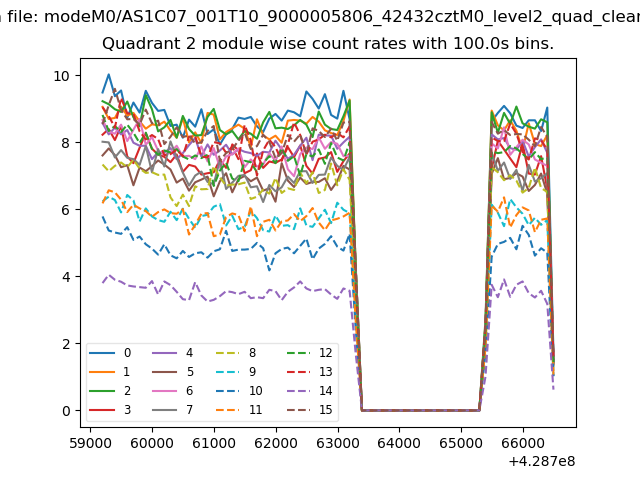
| Module-wise count rates for Quadrant B Data is divided into 100 sec bins |
 |
 |
| Module-wise count rates for Quadrant C Data is divided into 100 sec bins |
 |
 |
| Module-wise count rates for Quadrant D Data is divided into 100 sec bins |
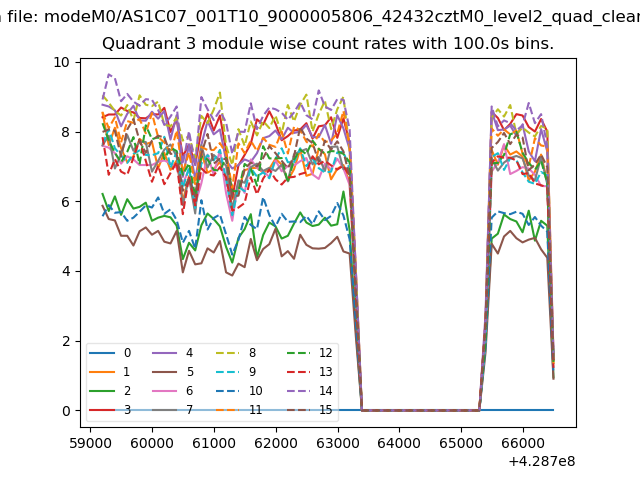 |
 |
| Parameter | Plot |
|---|---|
| CZT HV Monitor | 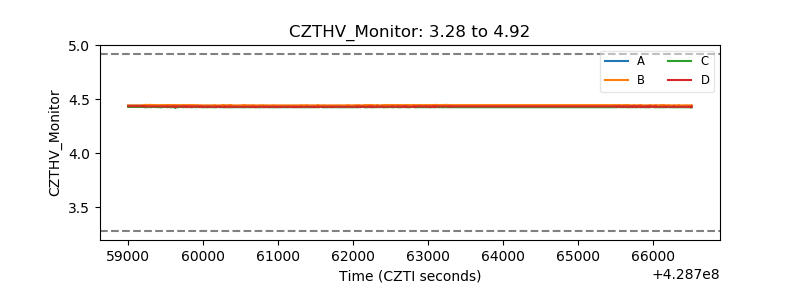 |
| D_VDD | 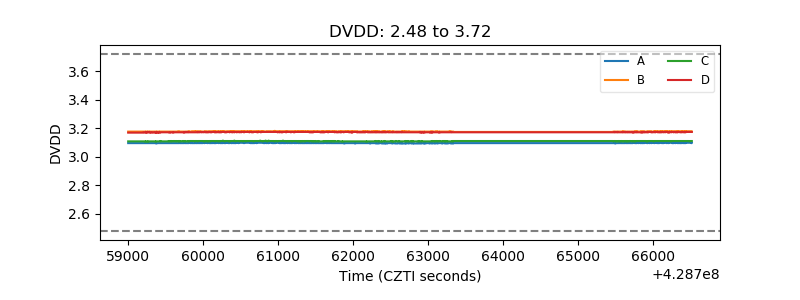 |
| Temperature 1 | 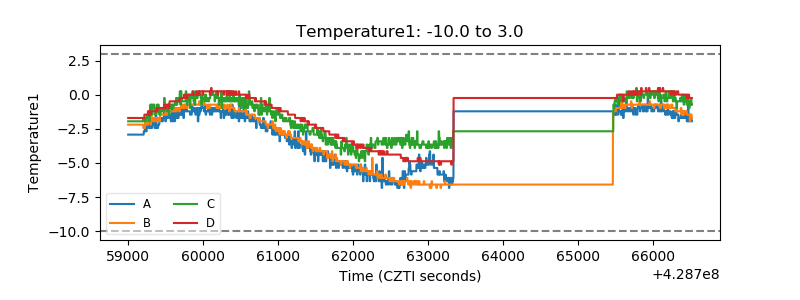 |
| Veto HV Monitor |  |
| Veto LLD | 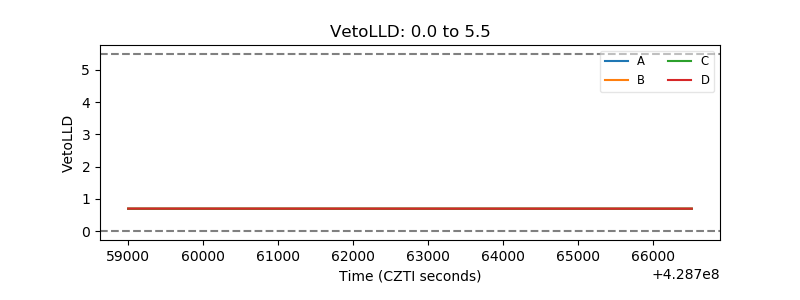 |
| Alpha Counter | 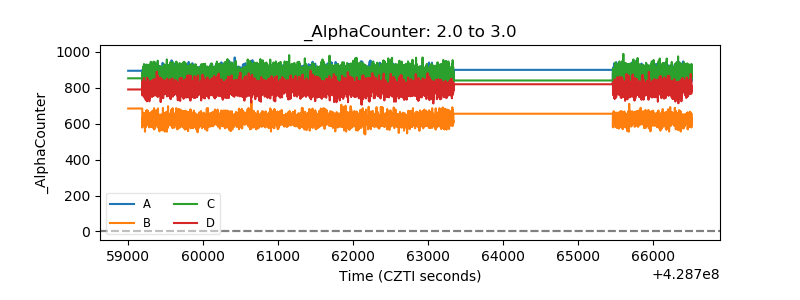 |
| _CPM_Rate | 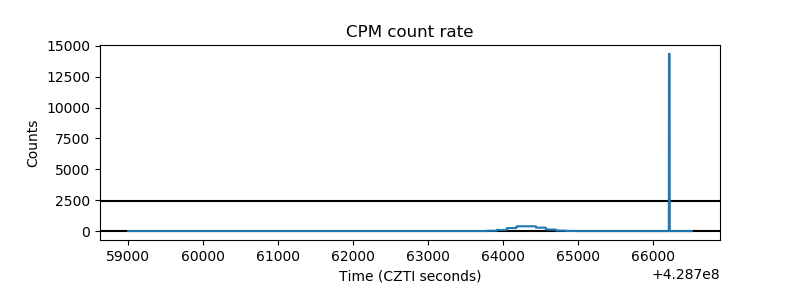 |
| CZT Counter | 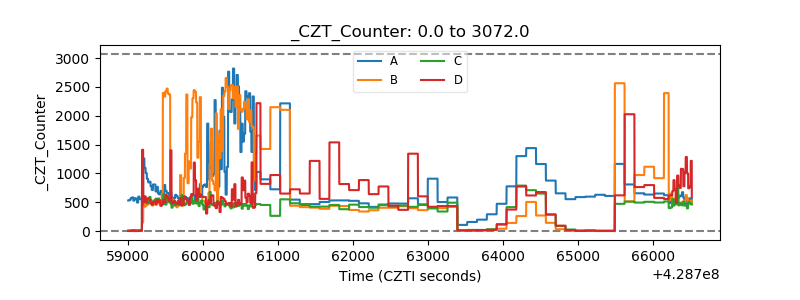 |
| +2.5 Volts monitor | 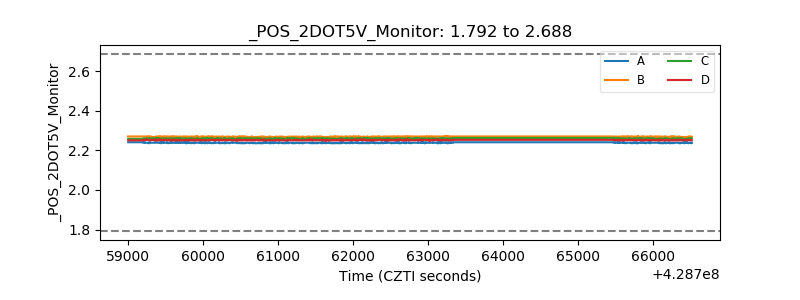 |
| +5 Volts monitor | 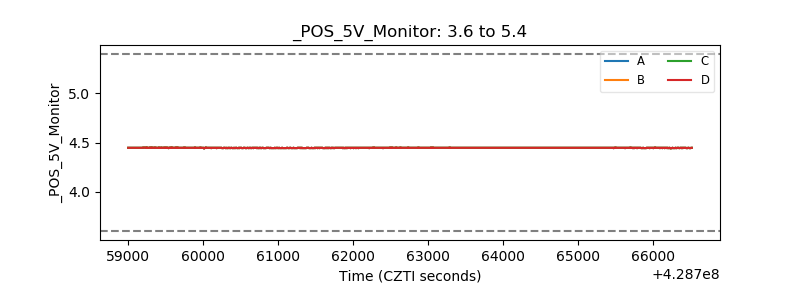 |
| _ROLL_ROT | 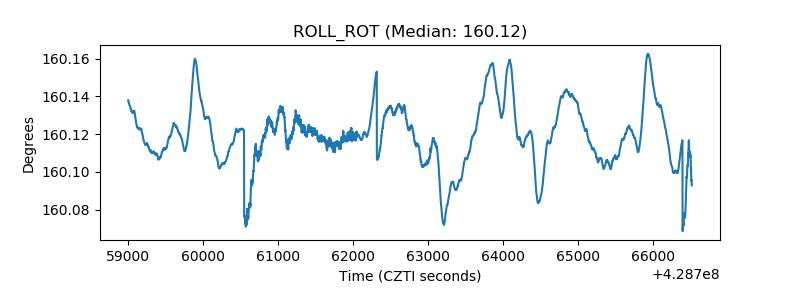 |
| _Roll_DEC | 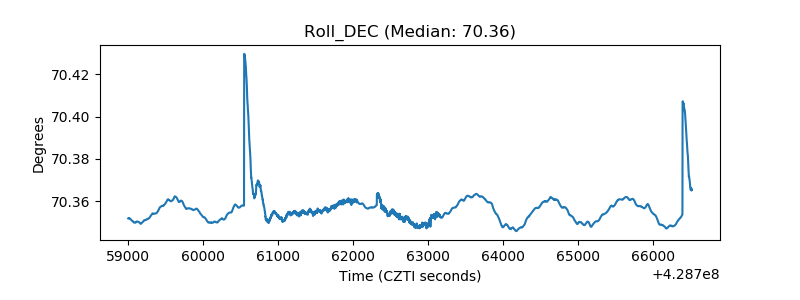 |
| _Roll_RA | 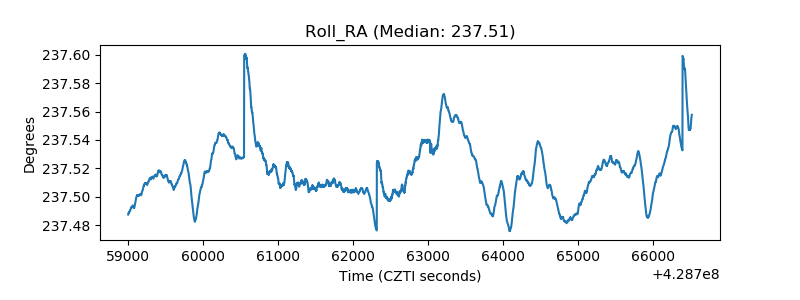 |
| Veto Counter | 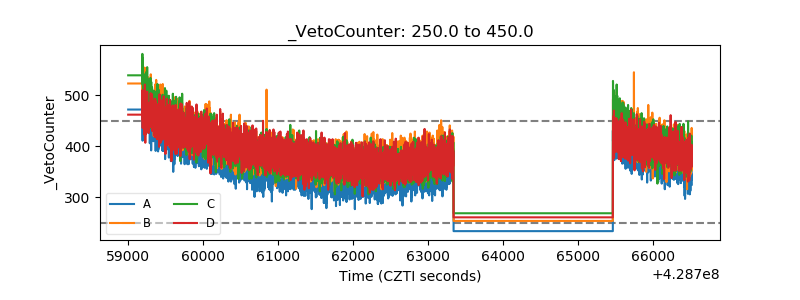 |