| Param | Original file | Final file |
|---|---|---|
| Filename | modeM0/AS1C07_001T10_9000005806_42433cztM0_level2.fits | modeM0/AS1C07_001T10_9000005806_42433cztM0_level2_quad_clean.evt |
| Size (bytes) | 366,168,960 | 84,574,080 |
| Size | 349.2 MB | 80.7 MB |
| Events in quadrant A | 2,952,923 | 589,430 |
| Events in quadrant B | 4,155,584 | 520,554 |
| Events in quadrant C | 2,501,678 | 565,175 |
| Events in quadrant D | 3,542,795 | 524,878 |
| Mode M9 | |||
|---|---|---|---|
| Quadrant | BADHDUFLAG | Total packets | Discarded packets |
| A | 0 | 23 | 0 |
| B | 0 | 24 | 0 |
| C | 0 | 24 | 0 |
| D | 0 | 24 | 0 |
| Mode SS | |||
|---|---|---|---|
| Quadrant | BADHDUFLAG | Total packets | Discarded packets |
| A | 0 | 104 | 0 |
| B | 0 | 104 | 0 |
| C | 0 | 104 | 0 |
| D | 0 | 104 | 0 |
| Mode M0 | |||
|---|---|---|---|
| Quadrant | BADHDUFLAG | Total packets | Discarded packets |
| A | 0 | 12054 | 2 |
| B | 0 | 15997 | 2 |
| C | 0 | 10705 | 2 |
| D | 0 | 14123 | 2 |
| Quadrant | Total seconds | Saturated seconds | Saturation percentage |
|---|---|---|---|
| A | 5153 | 24 | 0.465748% |
| B | 5153 | 665 | 12.905104% |
| C | 5153 | 15 | 0.291093% |
| D | 5153 | 175 | 3.396080% |
Noise dominated data is calculated using 1-second bins in cleaned event files. If a bin has >2000 counts, and if more than 50% of those come from <1% of pixels, then it is considered to be noise-dominated and hence unusable.
| Quadrant | # 1 sec bins | Bins with >0 counts | Bins with >2000 counts | High rate bins dominated by noise | Noise dominated (total time) | Noise dominated (detector-on time) | Marked lightcurve |
|---|---|---|---|---|---|---|---|
| A | 7186 | 5154 | 13 | 13 | 0.18% | 0.25% | 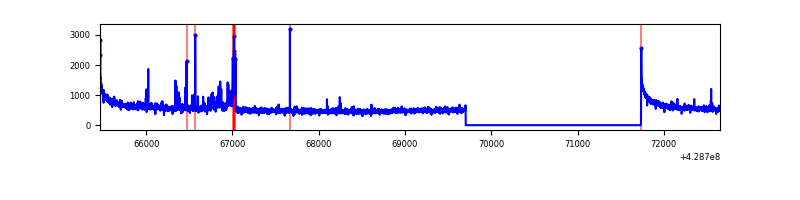 |
| B | 7185 | 5153 | 494 | 494 | 6.88% | 9.59% | 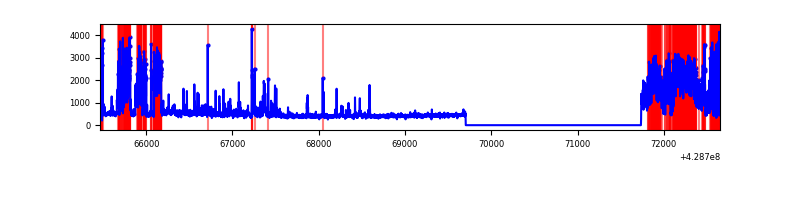 |
| C | 7186 | 5154 | 7 | 7 | 0.10% | 0.14% | 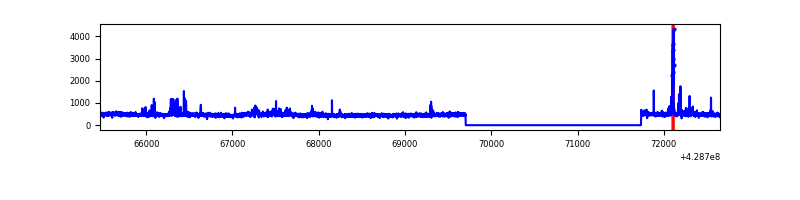 |
| D | 7186 | 5154 | 154 | 154 | 2.14% | 2.99% | 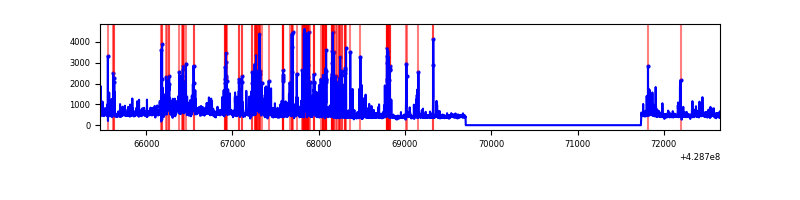 |
Top three noisy pixels from each quadrant. If the there are fewer than three noisy pixels in the level2.evt file, extra rows are filled as -1
| Pixel properties | Quadrant properties | ||||||
|---|---|---|---|---|---|---|---|
| Quadrant | DetID | PixID | Counts | Sigma | Mean | Median | Sigma |
| A | 10 | 83 | 622145 | 5479.76 | 552 | 542 | 113.4 |
| A | 14 | 223 | 169662 | 1490.88 | 552 | 542 | 113.4 |
| A | 13 | 254 | 10317 | 86.17 | 552 | 542 | 113.4 |
| B | 0 | 186 | 1840493 | 18677.66 | 522 | 508 | 98.5 |
| B | 5 | 255 | 136173 | 1377.13 | 522 | 508 | 98.5 |
| B | 5 | 172 | 42863 | 429.94 | 522 | 508 | 98.5 |
| C | 15 | 214 | 219197 | 1734.42 | 542 | 544 | 126.1 |
| C | 7 | 220 | 62981 | 495.27 | 542 | 544 | 126.1 |
| C | 12 | 249 | 49076 | 384.97 | 542 | 544 | 126.1 |
| D | 1 | 52 | 848997 | 6350.87 | 541 | 525 | 133.6 |
| D | 12 | 33 | 258699 | 1932.45 | 541 | 525 | 133.6 |
| D | 10 | 199 | 68806 | 511.09 | 541 | 525 | 133.6 |
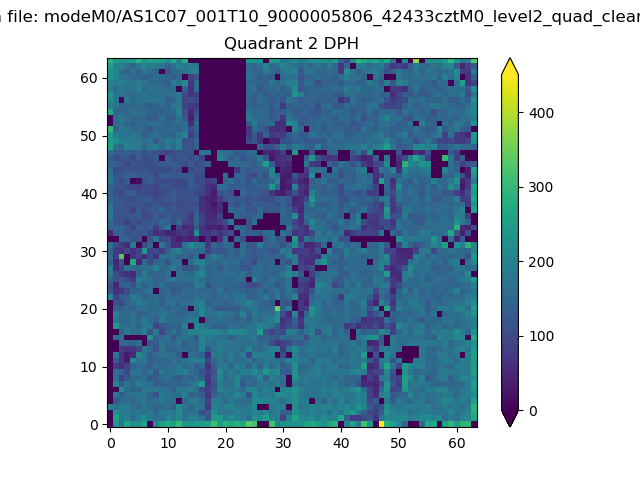
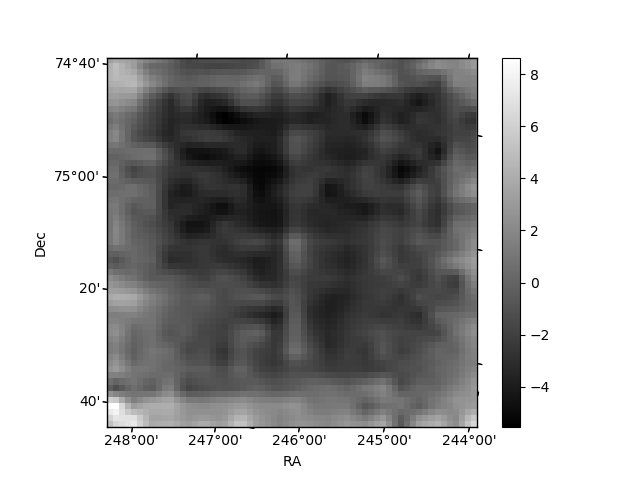
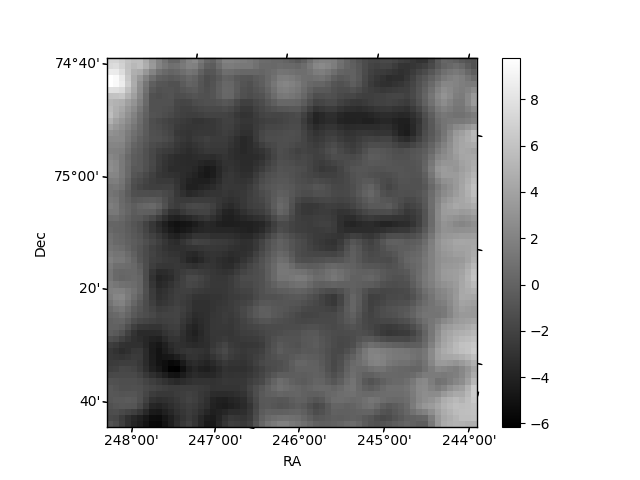
Histogram calculated using DETX and DETY for each event in the final _common_clean file
| Quadrant A |  |
 |
Quadrant B |
|---|---|---|---|
| Quadrant D | 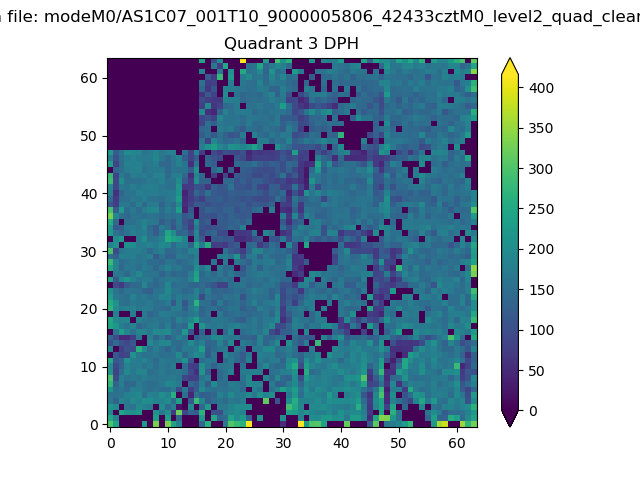 |
 |
Quadrant C |
| Plot type | Count rate plots | Images |
|---|---|---|
| Comparison with Poisson distribution Blue bars denote a histogram of data divided into 1 sec bins. Red curve is a Poisson curve with rate = median count rate of data. |
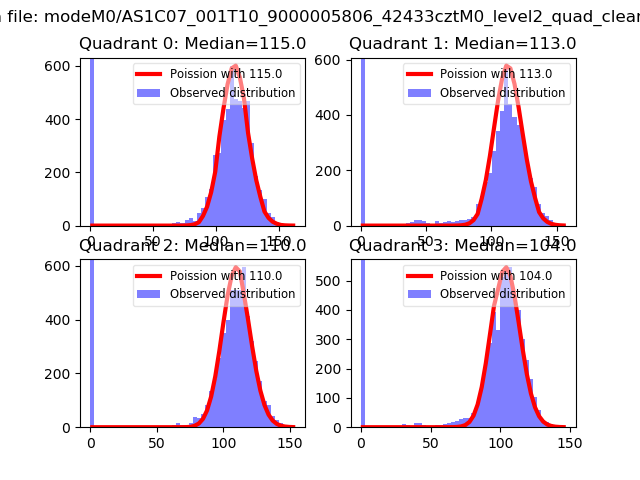 |
 |
| Quadrant-wise count rates Data is divided into 100 sec bins |
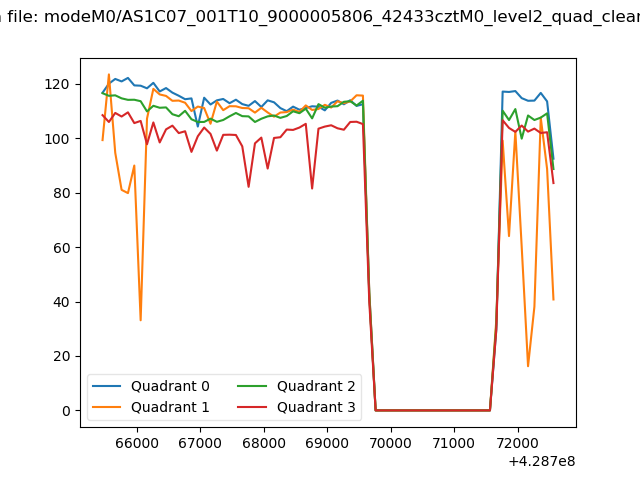 |
|
| Module-wise count rates for Quadrant A Data is divided into 100 sec bins |
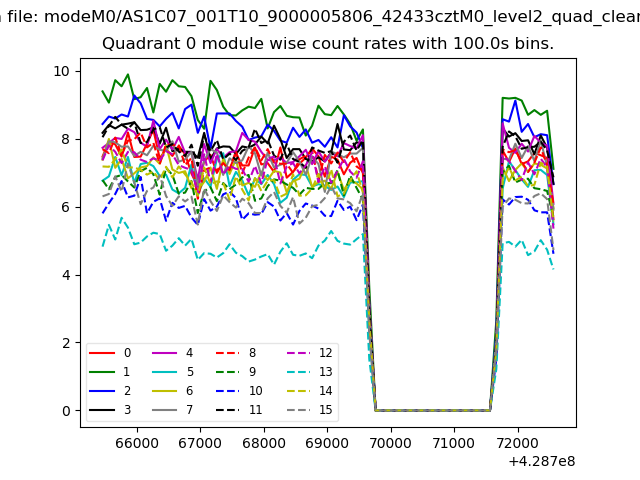 |
 |
| Module-wise count rates for Quadrant B Data is divided into 100 sec bins |
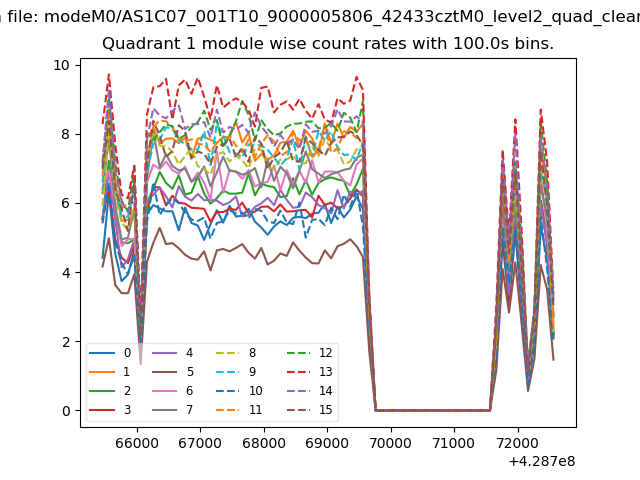 |
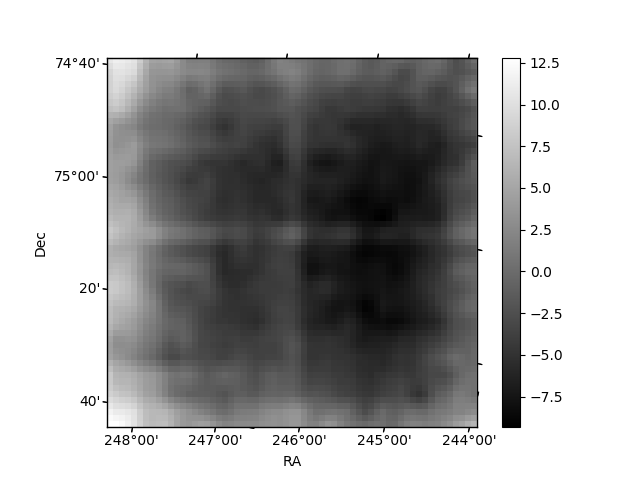 |
| Module-wise count rates for Quadrant C Data is divided into 100 sec bins |
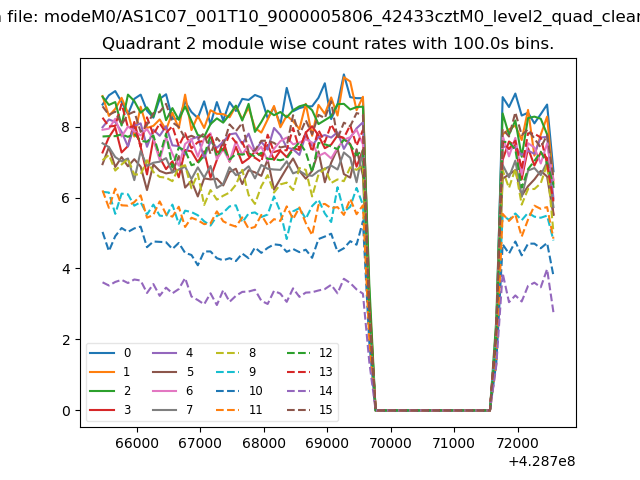 |
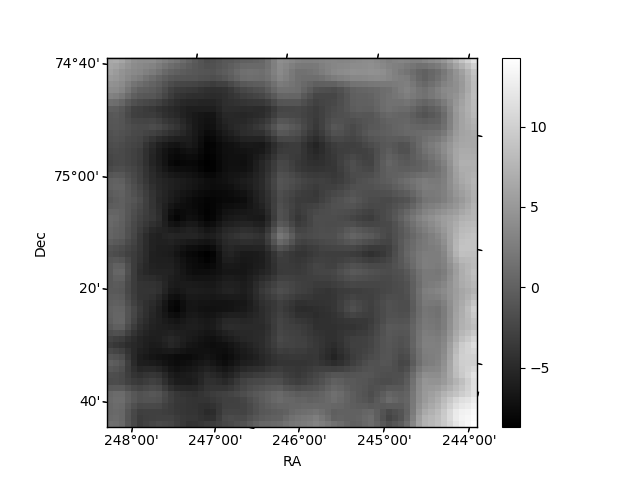 |
| Module-wise count rates for Quadrant D Data is divided into 100 sec bins |
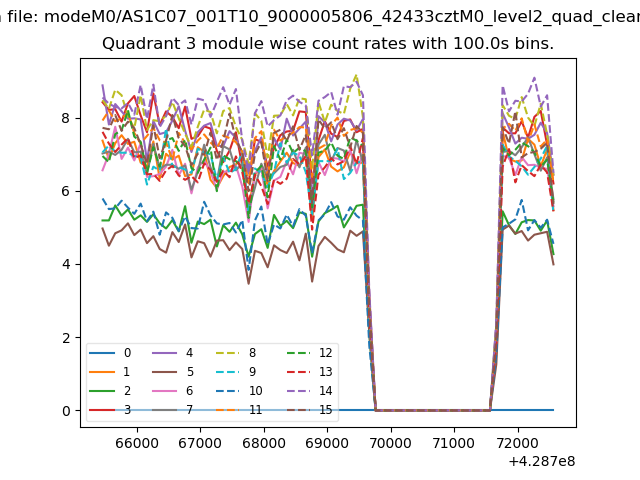 |
 |
| Parameter | Plot |
|---|---|
| CZT HV Monitor | 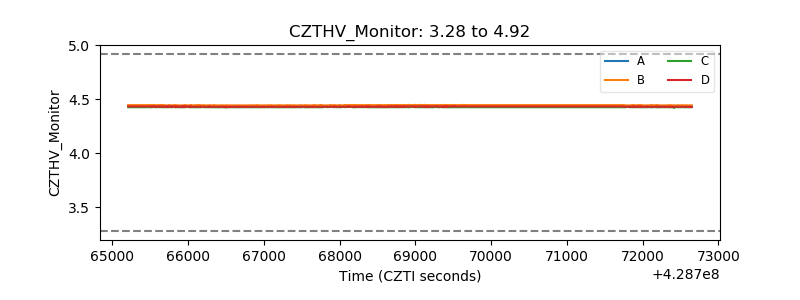 |
| D_VDD | 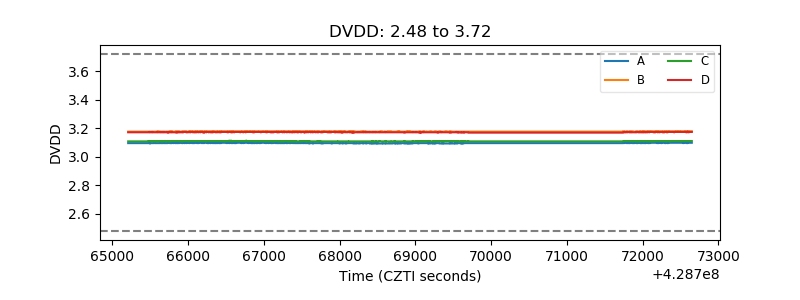 |
| Temperature 1 | 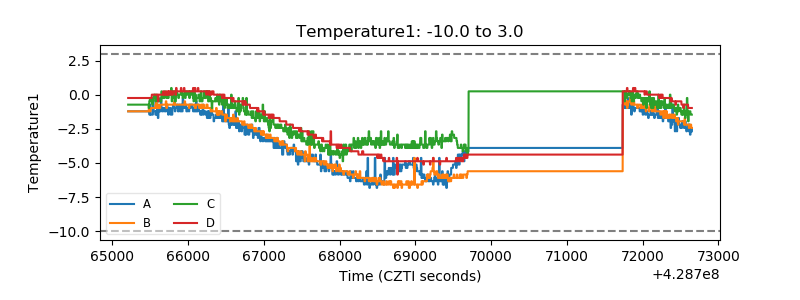 |
| Veto HV Monitor | 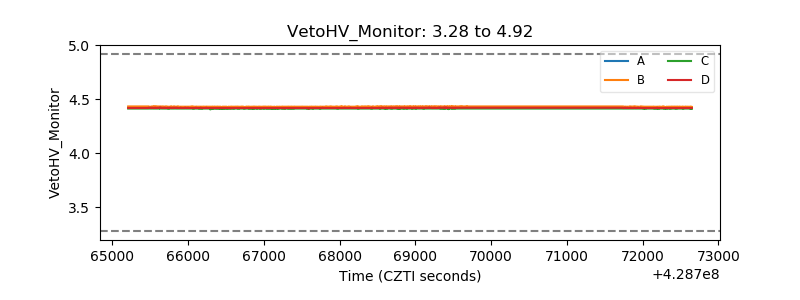 |
| Veto LLD | 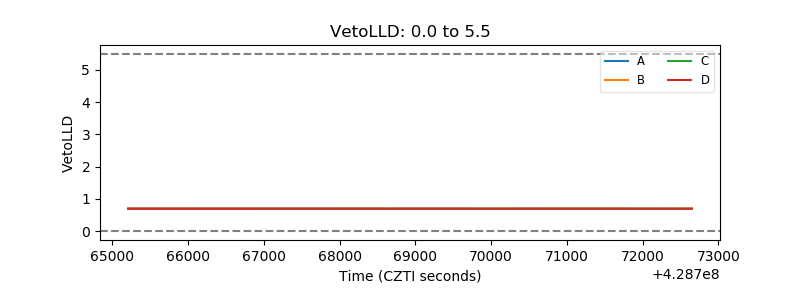 |
| Alpha Counter | 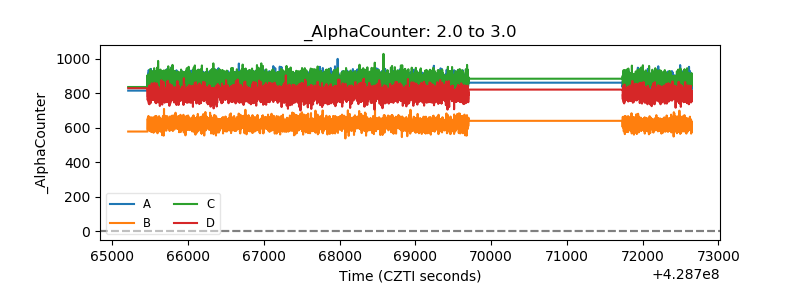 |
| _CPM_Rate | 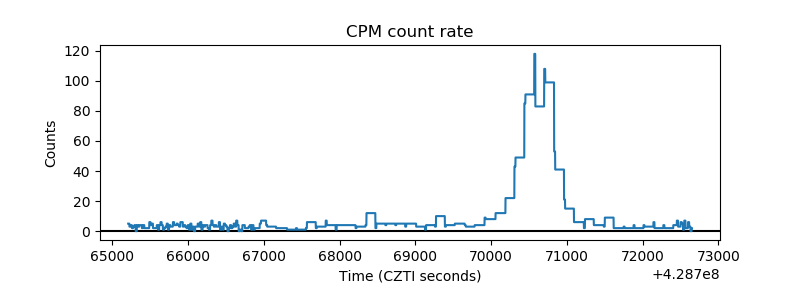 |
| CZT Counter | 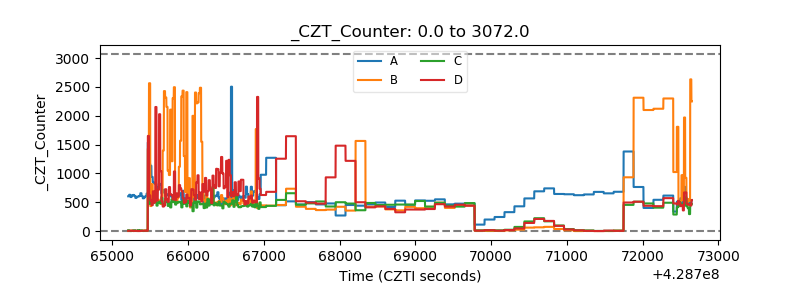 |
| +2.5 Volts monitor | 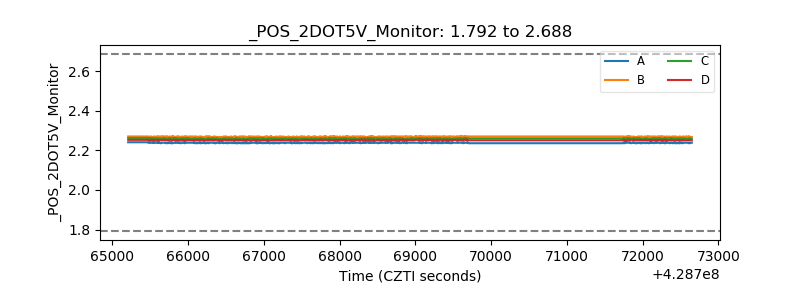 |
| +5 Volts monitor | 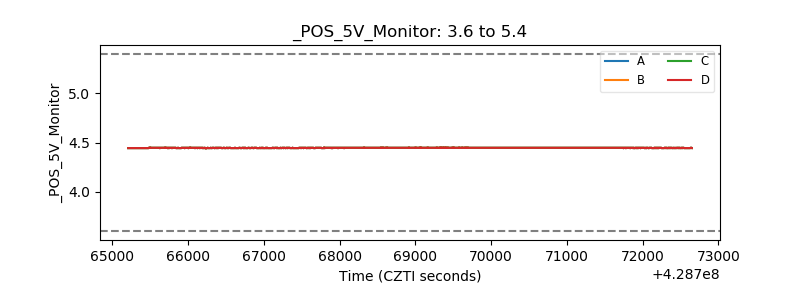 |
| _ROLL_ROT | 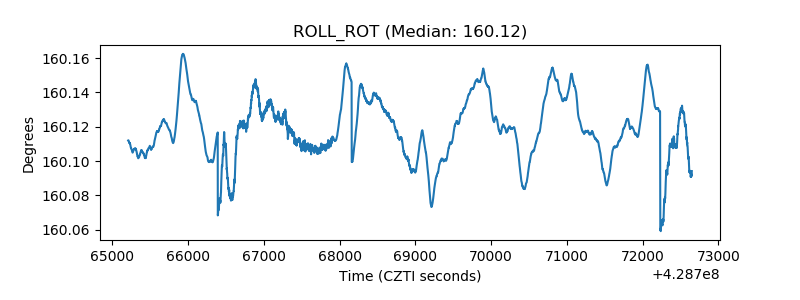 |
| _Roll_DEC | 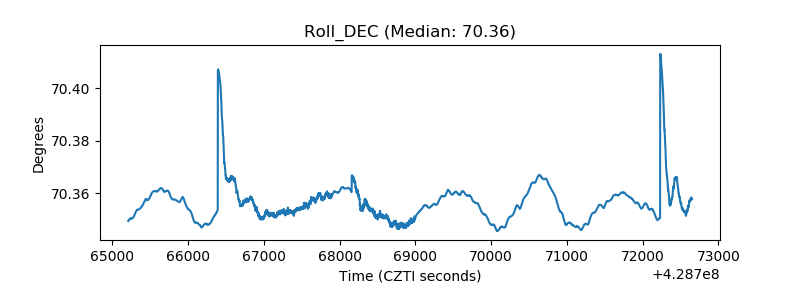 |
| _Roll_RA | 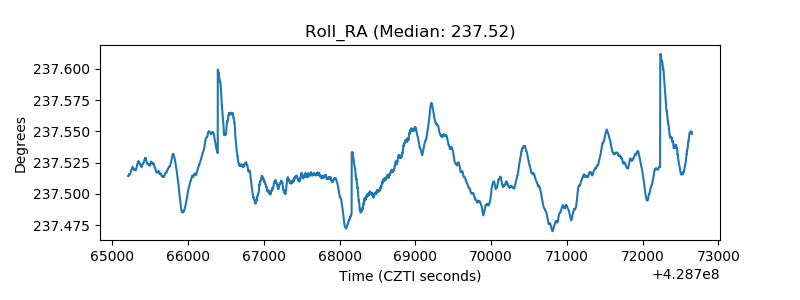 |
| Veto Counter | 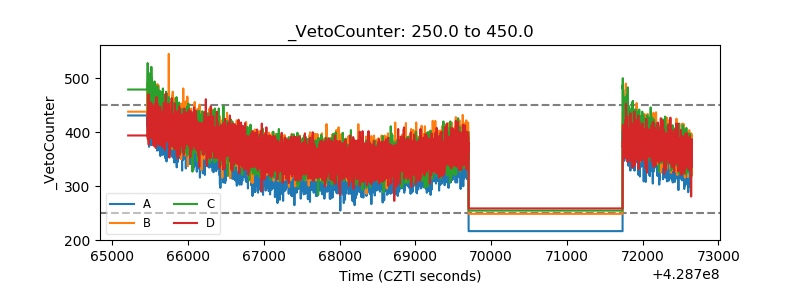 |