| Param | Original file | Final file |
|---|---|---|
| Filename | modeM0/AS1C07_001T10_9000005806_42434cztM0_level2.fits | modeM0/AS1C07_001T10_9000005806_42434cztM0_level2_quad_clean.evt |
| Size (bytes) | 387,630,720 | 79,200,000 |
| Size | 369.7 MB | 75.5 MB |
| Events in quadrant A | 2,723,098 | 567,707 |
| Events in quadrant B | 5,732,982 | 403,911 |
| Events in quadrant C | 2,406,482 | 551,066 |
| Events in quadrant D | 3,083,810 | 513,599 |
| Mode M9 | |||
|---|---|---|---|
| Quadrant | BADHDUFLAG | Total packets | Discarded packets |
| A | 0 | 18 | 1 |
| B | 0 | 18 | 0 |
| C | 0 | 18 | 0 |
| D | 0 | 18 | 0 |
| Mode SS | |||
|---|---|---|---|
| Quadrant | BADHDUFLAG | Total packets | Discarded packets |
| A | 0 | 106 | 0 |
| B | 0 | 106 | 0 |
| C | 0 | 106 | 0 |
| D | 0 | 106 | 0 |
| Mode M0 | |||
|---|---|---|---|
| Quadrant | BADHDUFLAG | Total packets | Discarded packets |
| A | 0 | 11474 | 150 |
| B | 0 | 21155 | 303 |
| C | 0 | 10749 | 99 |
| D | 0 | 12817 | 124 |
| Quadrant | Total seconds | Saturated seconds | Saturation percentage |
|---|---|---|---|
| A | 5164 | 12 | 0.232378% |
| B | 5158 | 1569 | 30.418767% |
| C | 5164 | 18 | 0.348567% |
| D | 5160 | 109 | 2.112403% |
Noise dominated data is calculated using 1-second bins in cleaned event files. If a bin has >2000 counts, and if more than 50% of those come from <1% of pixels, then it is considered to be noise-dominated and hence unusable.
| Quadrant | # 1 sec bins | Bins with >0 counts | Bins with >2000 counts | High rate bins dominated by noise | Noise dominated (total time) | Noise dominated (detector-on time) | Marked lightcurve |
|---|---|---|---|---|---|---|---|
| A | 7049 | 5180 | 4 | 4 | 0.06% | 0.08% | 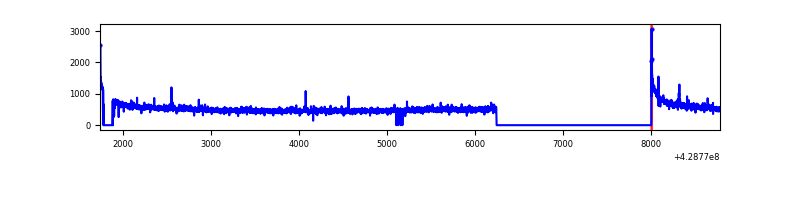 |
| B | 7049 | 5174 | 1275 | 1275 | 18.09% | 24.64% | 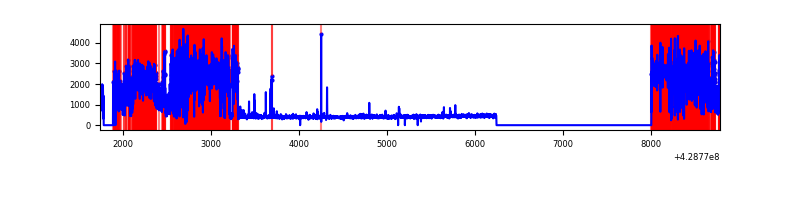 |
| C | 7049 | 5176 | 7 | 7 | 0.10% | 0.14% | 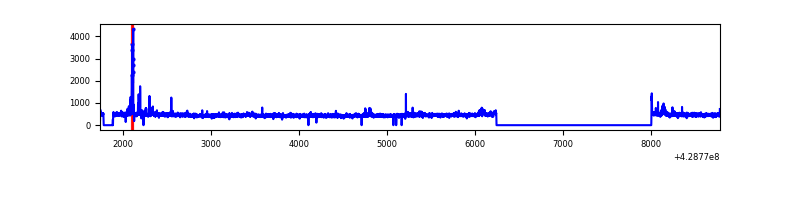 |
| D | 7049 | 5179 | 93 | 93 | 1.32% | 1.80% | 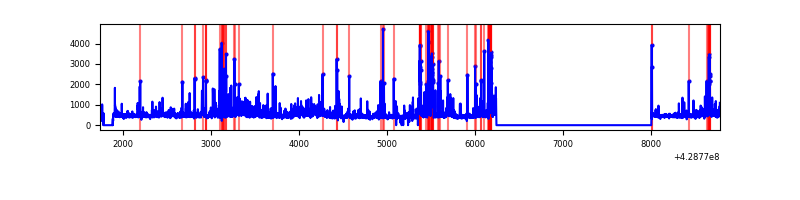 |
Top three noisy pixels from each quadrant. If the there are fewer than three noisy pixels in the level2.evt file, extra rows are filled as -1
| Pixel properties | Quadrant properties | ||||||
|---|---|---|---|---|---|---|---|
| Quadrant | DetID | PixID | Counts | Sigma | Mean | Median | Sigma |
| A | 10 | 83 | 570765 | 5140.1 | 540 | 529 | 110.9 |
| A | 14 | 223 | 23997 | 211.54 | 540 | 529 | 110.9 |
| A | 13 | 6 | 16599 | 144.85 | 540 | 529 | 110.9 |
| B | 0 | 186 | 3668551 | 42166.42 | 450 | 438 | 87.0 |
| B | 5 | 255 | 207957 | 2385.51 | 450 | 438 | 87.0 |
| B | 3 | 112 | 32189 | 364.99 | 450 | 438 | 87.0 |
| C | 15 | 214 | 214912 | 1733.87 | 530 | 533 | 123.6 |
| C | 12 | 249 | 54252 | 434.47 | 530 | 533 | 123.6 |
| C | 7 | 220 | 26865 | 212.97 | 530 | 533 | 123.6 |
| D | 12 | 33 | 506006 | 3866.44 | 530 | 514 | 130.7 |
| D | 1 | 52 | 120867 | 920.56 | 530 | 514 | 130.7 |
| D | 12 | 6 | 104176 | 792.9 | 530 | 514 | 130.7 |
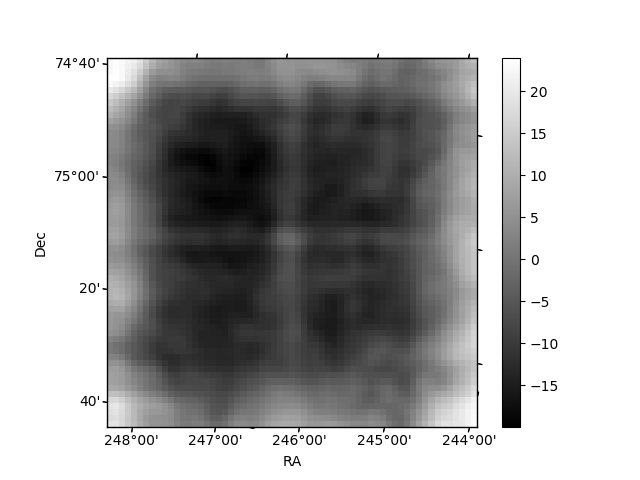
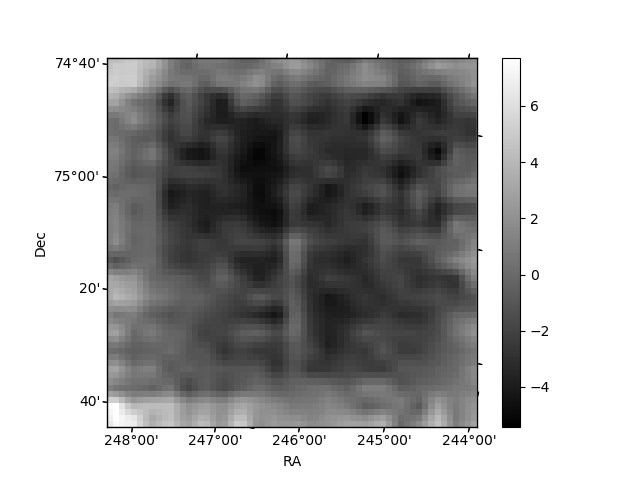
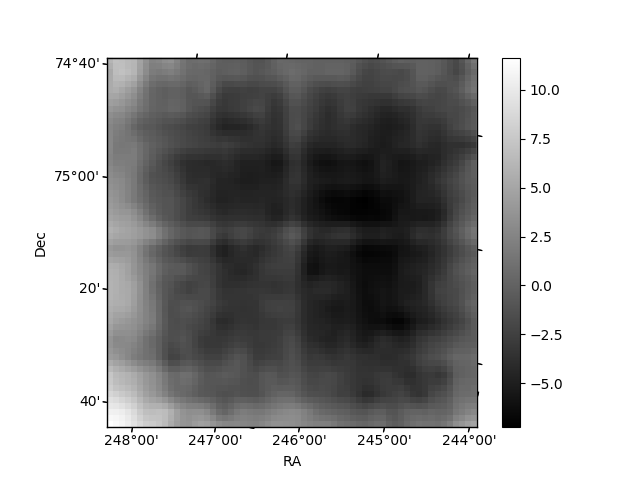
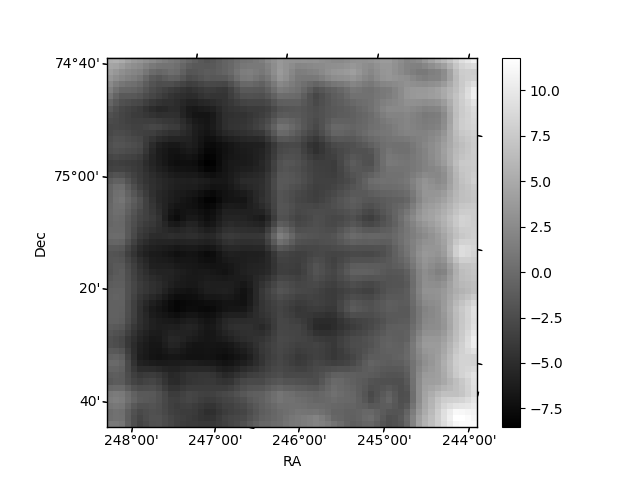
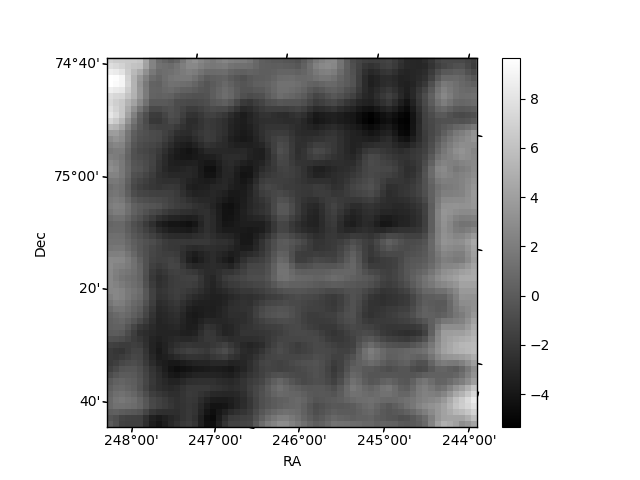
Histogram calculated using DETX and DETY for each event in the final _common_clean file
| Quadrant A | 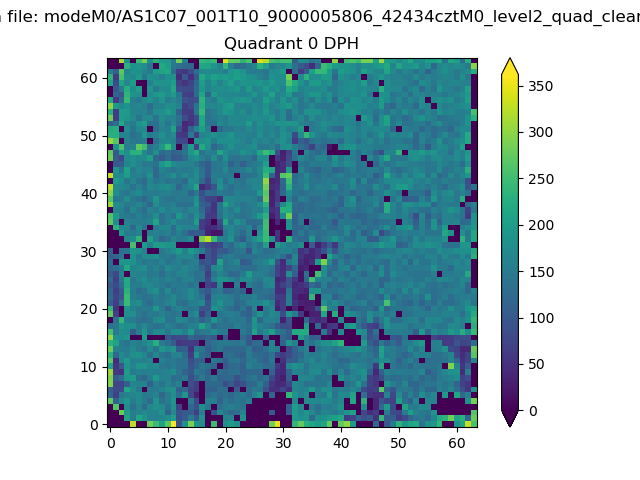 |
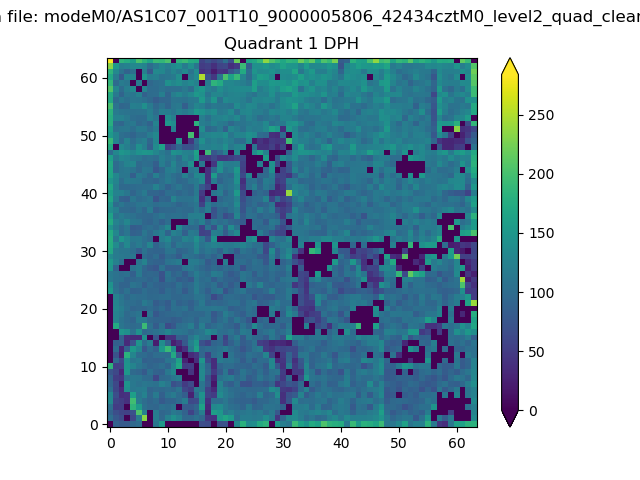 |
Quadrant B |
|---|---|---|---|
| Quadrant D | 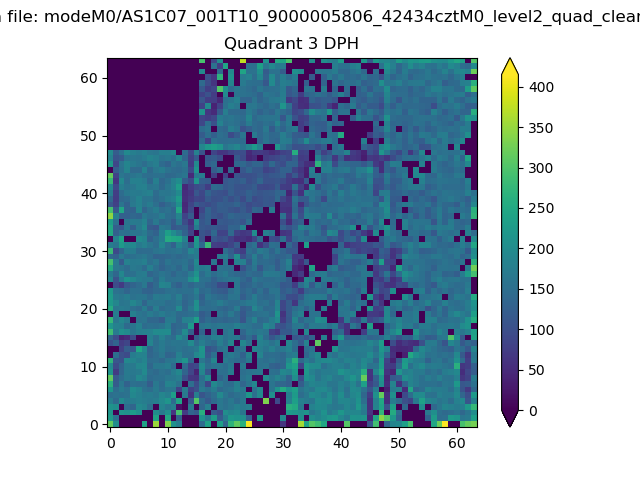 |
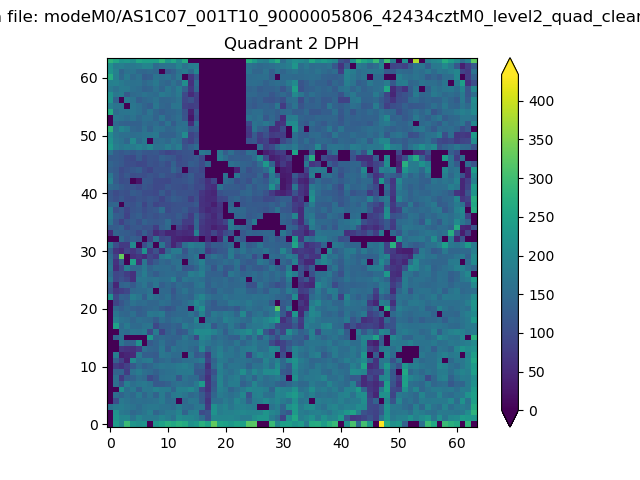 |
Quadrant C |
| Plot type | Count rate plots | Images |
|---|---|---|
| Comparison with Poisson distribution Blue bars denote a histogram of data divided into 1 sec bins. Red curve is a Poisson curve with rate = median count rate of data. |
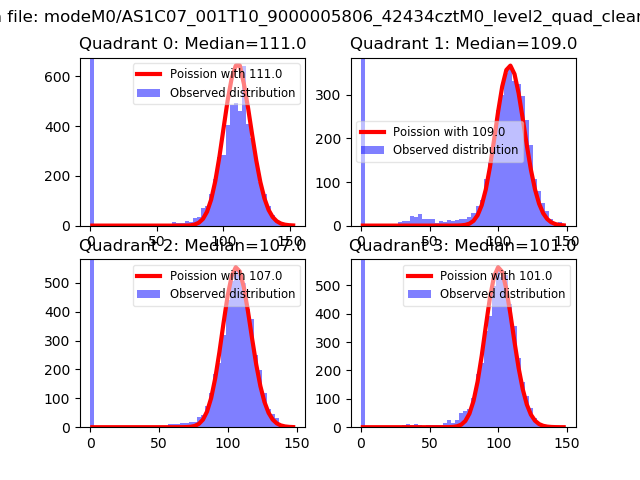 |
 |
| Quadrant-wise count rates Data is divided into 100 sec bins |
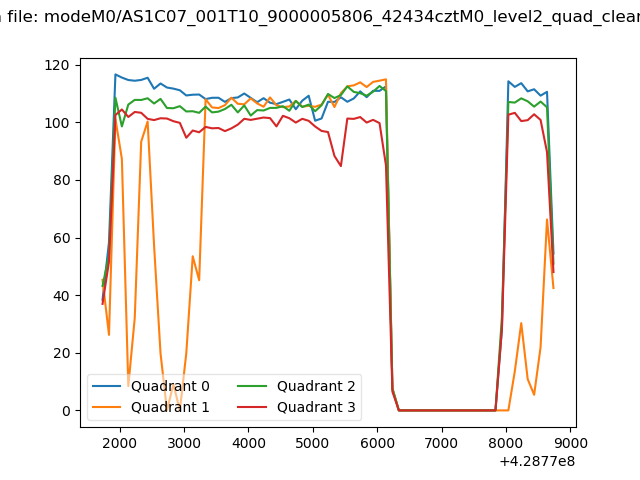 |
|
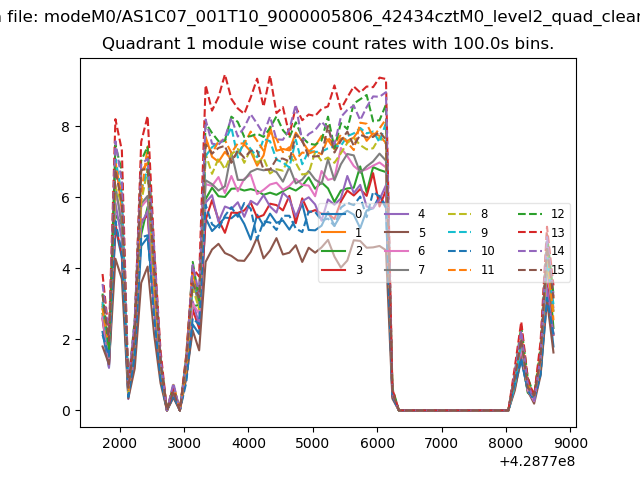
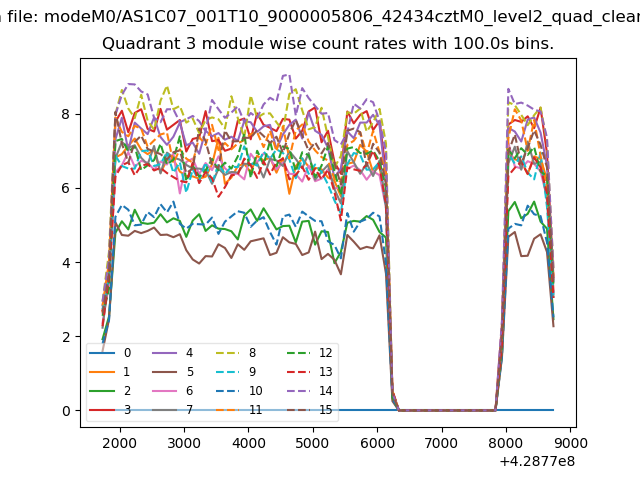
| Module-wise count rates for Quadrant A Data is divided into 100 sec bins |
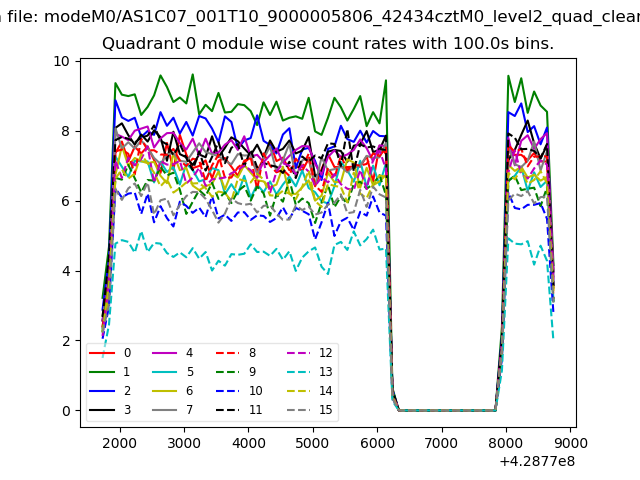 |
 |
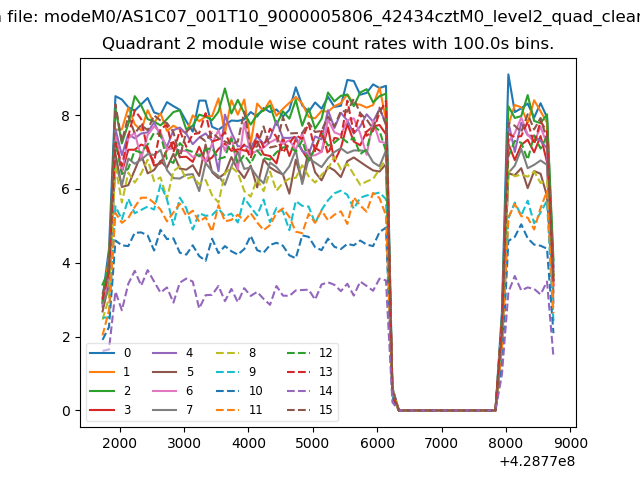
| Module-wise count rates for Quadrant B Data is divided into 100 sec bins |
 |
 |
| Module-wise count rates for Quadrant C Data is divided into 100 sec bins |
 |
 |
| Module-wise count rates for Quadrant D Data is divided into 100 sec bins |
 |
 |
| Parameter | Plot |
|---|---|
| CZT HV Monitor | 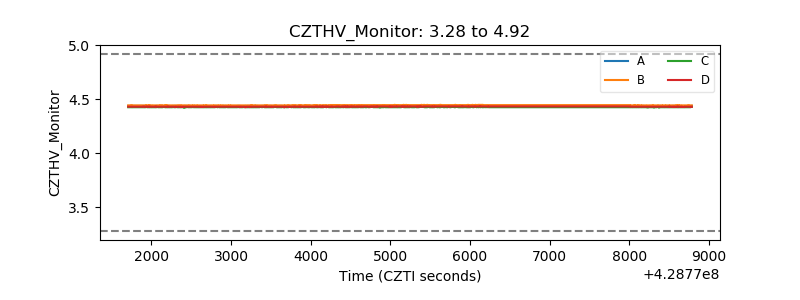 |
| D_VDD | 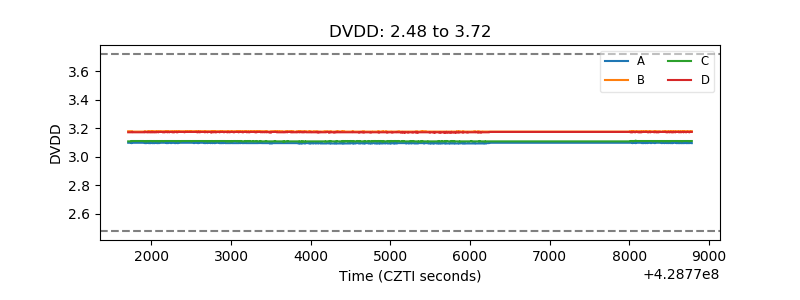 |
| Temperature 1 | 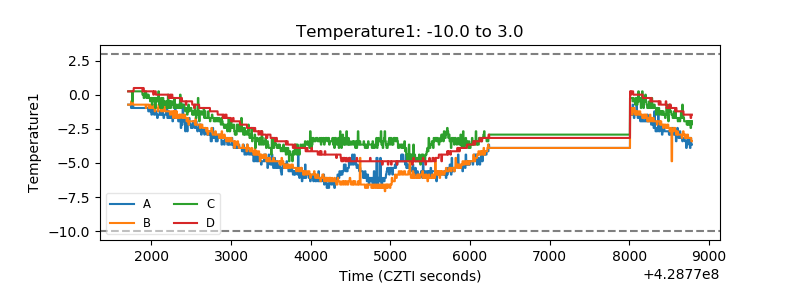 |
| Veto HV Monitor | 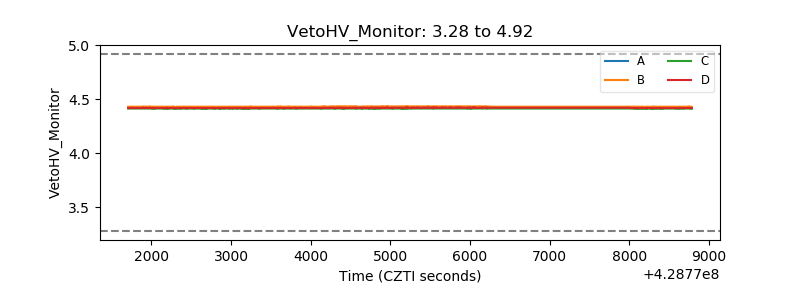 |
| Veto LLD | 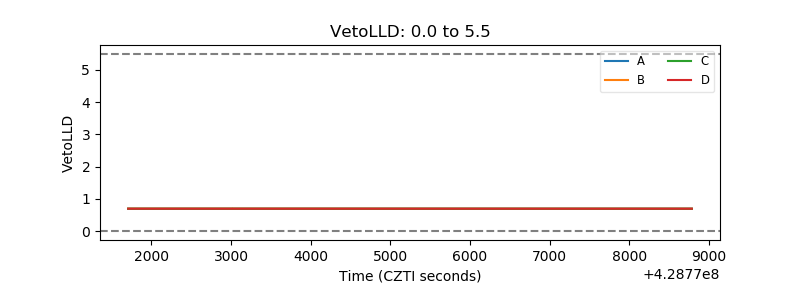 |
| Alpha Counter | 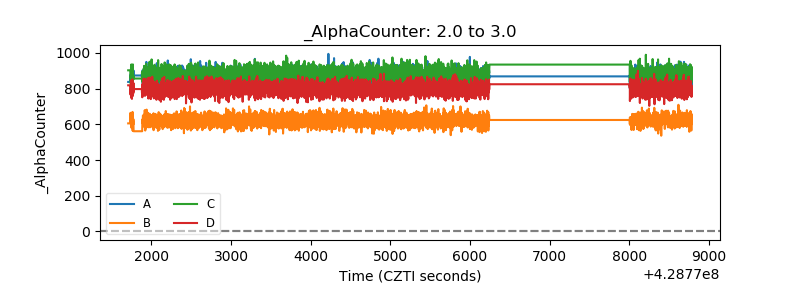 |
| _CPM_Rate | 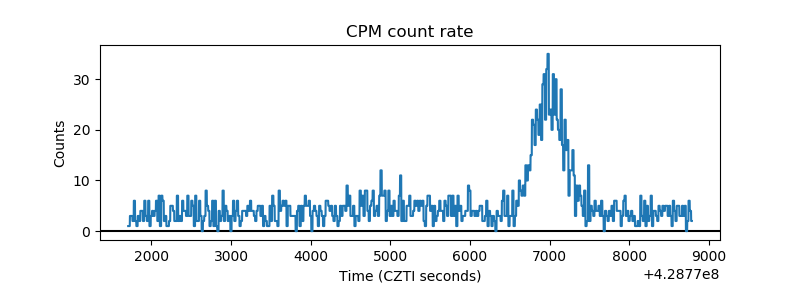 |
| CZT Counter | 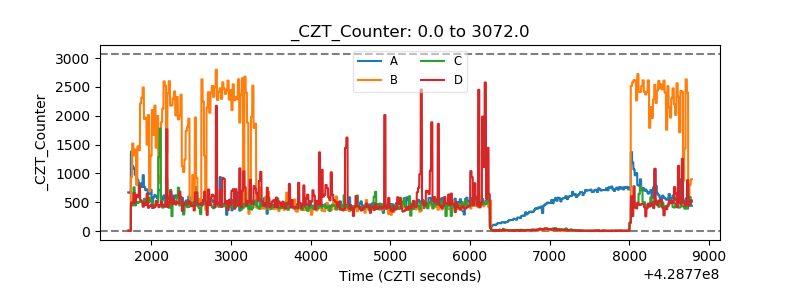 |
| +2.5 Volts monitor |  |
| +5 Volts monitor | 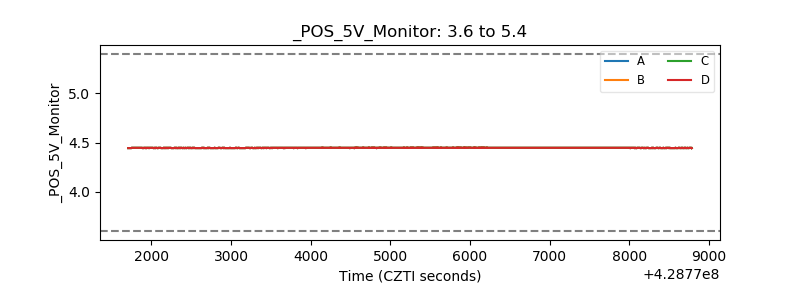 |
| _ROLL_ROT | 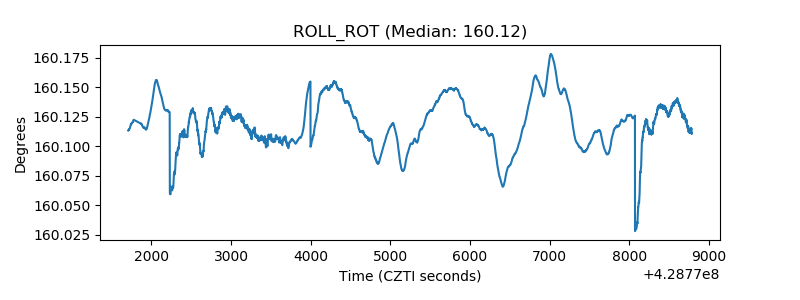 |
| _Roll_DEC | 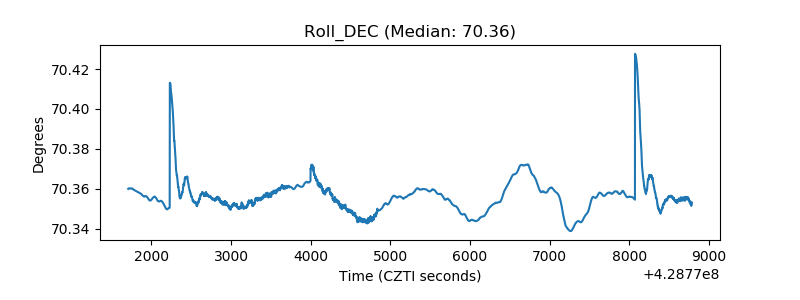 |
| _Roll_RA | 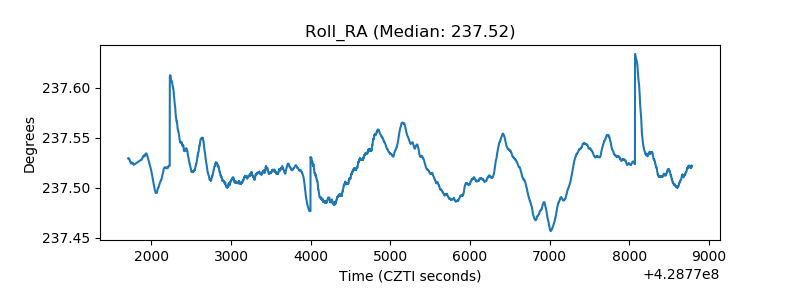 |
| Veto Counter | 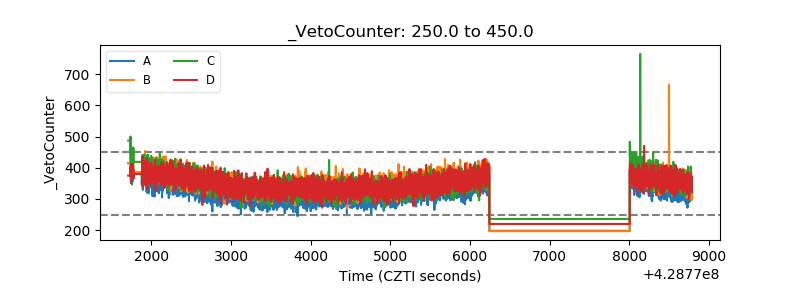 |