| Param | Original file | Final file |
|---|---|---|
| Filename | modeM0/AS1C07_001T10_9000005806_42435cztM0_level2.fits | modeM0/AS1C07_001T10_9000005806_42435cztM0_level2_quad_clean.evt |
| Size (bytes) | 529,217,280 | 83,174,400 |
| Size | 504.7 MB | 79.3 MB |
| Events in quadrant A | 3,019,290 | 612,746 |
| Events in quadrant B | 5,570,405 | 465,842 |
| Events in quadrant C | 2,837,822 | 599,339 |
| Events in quadrant D | 7,721,486 | 443,006 |
| Mode M9 | |||
|---|---|---|---|
| Quadrant | BADHDUFLAG | Total packets | Discarded packets |
| A | 0 | 14 | 0 |
| B | 0 | 14 | 0 |
| C | 0 | 14 | 0 |
| D | 0 | 14 | 0 |
| Mode SS | |||
|---|---|---|---|
| Quadrant | BADHDUFLAG | Total packets | Discarded packets |
| A | 0 | 118 | 0 |
| B | 0 | 118 | 0 |
| C | 0 | 118 | 0 |
| D | 0 | 118 | 0 |
| Mode M0 | |||
|---|---|---|---|
| Quadrant | BADHDUFLAG | Total packets | Discarded packets |
| A | 0 | 12538 | 2 |
| B | 0 | 20743 | 2 |
| C | 0 | 12277 | 2 |
| D | 0 | 26823 | 2 |
| Quadrant | Total seconds | Saturated seconds | Saturation percentage |
|---|---|---|---|
| A | 5670 | 15 | 0.264550% |
| B | 5671 | 1430 | 25.216011% |
| C | 5671 | 22 | 0.387939% |
| D | 5671 | 1470 | 25.921354% |
Noise dominated data is calculated using 1-second bins in cleaned event files. If a bin has >2000 counts, and if more than 50% of those come from <1% of pixels, then it is considered to be noise-dominated and hence unusable.
| Quadrant | # 1 sec bins | Bins with >0 counts | Bins with >2000 counts | High rate bins dominated by noise | Noise dominated (total time) | Noise dominated (detector-on time) | Marked lightcurve |
|---|---|---|---|---|---|---|---|
| A | 7102 | 5671 | 5 | 5 | 0.07% | 0.09% | 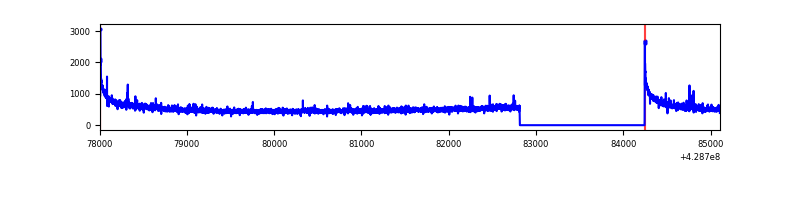 |
| B | 7103 | 5672 | 1168 | 1168 | 16.44% | 20.59% | 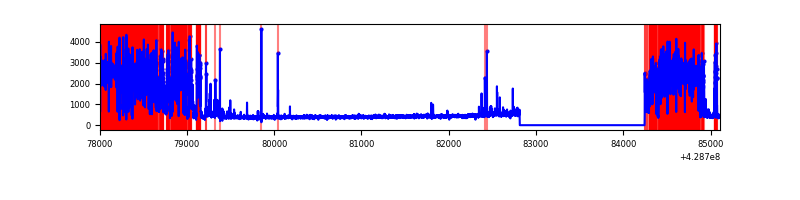 |
| C | 7103 | 5672 | 17 | 17 | 0.24% | 0.30% | 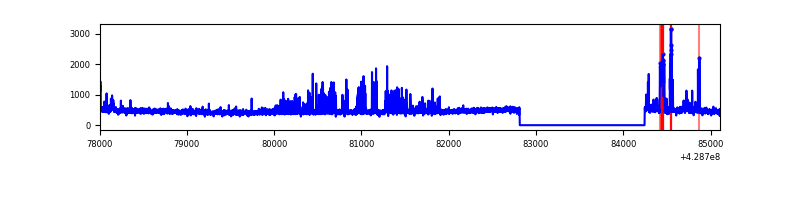 |
| D | 7103 | 5672 | 1483 | 1483 | 20.88% | 26.15% | 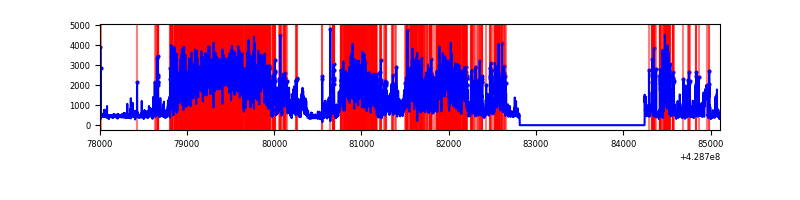 |
Top three noisy pixels from each quadrant. If the there are fewer than three noisy pixels in the level2.evt file, extra rows are filled as -1
| Pixel properties | Quadrant properties | ||||||
|---|---|---|---|---|---|---|---|
| Quadrant | DetID | PixID | Counts | Sigma | Mean | Median | Sigma |
| A | 10 | 83 | 638646 | 5241.29 | 593 | 581 | 121.7 |
| A | 14 | 223 | 30456 | 245.4 | 593 | 581 | 121.7 |
| A | 13 | 6 | 18333 | 145.82 | 593 | 581 | 121.7 |
| B | 0 | 186 | 3192674 | 32093.65 | 504 | 491 | 99.5 |
| B | 5 | 255 | 322083 | 3233.23 | 504 | 491 | 99.5 |
| B | 3 | 112 | 29509 | 291.74 | 504 | 491 | 99.5 |
| C | 15 | 214 | 235360 | 1722.7 | 582 | 584 | 136.3 |
| C | 10 | 34 | 151160 | 1104.87 | 582 | 584 | 136.3 |
| C | 12 | 175 | 104876 | 765.26 | 582 | 584 | 136.3 |
| D | 12 | 33 | 4427379 | 33493.13 | 531 | 513 | 132.2 |
| D | 12 | 233 | 203741 | 1537.6 | 531 | 513 | 132.2 |
| D | 12 | 6 | 152909 | 1153.01 | 531 | 513 | 132.2 |
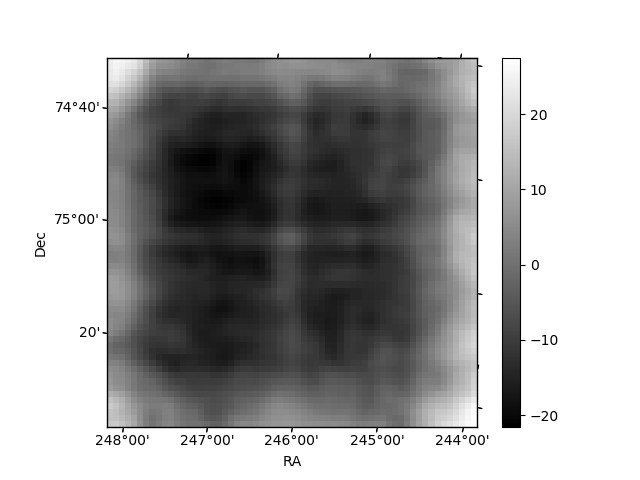
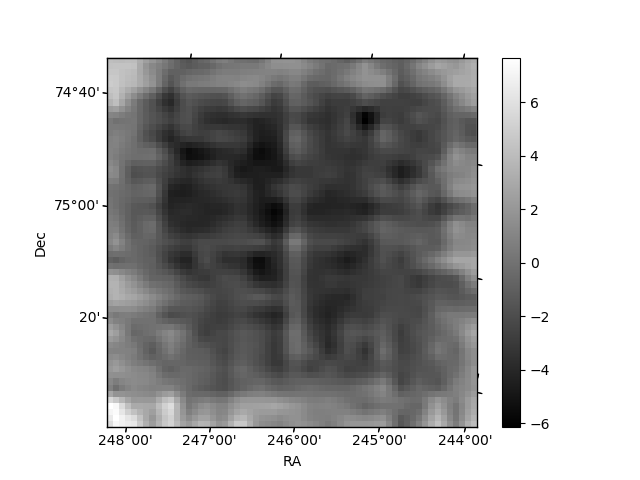
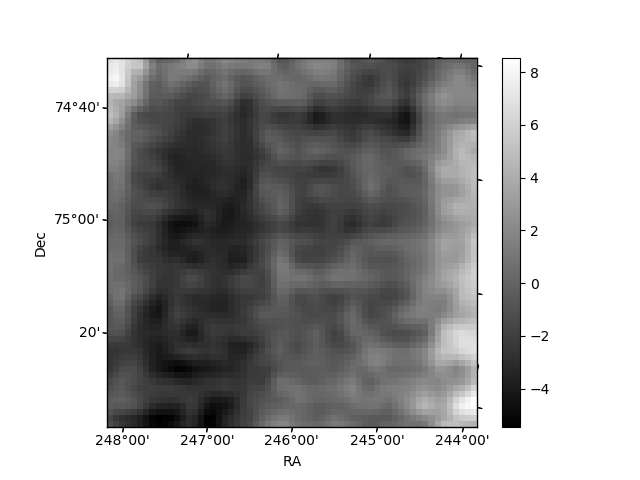
Histogram calculated using DETX and DETY for each event in the final _common_clean file
| Quadrant A | 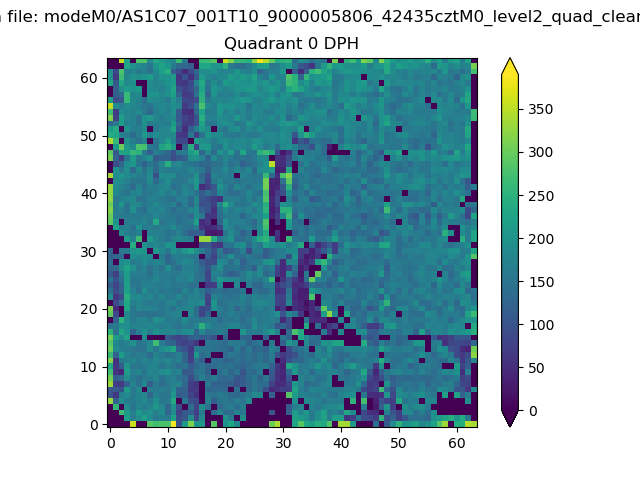 |
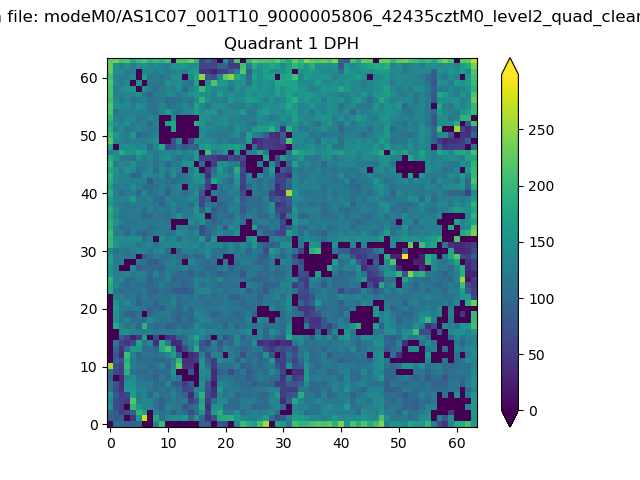 |
Quadrant B |
|---|---|---|---|
| Quadrant D |  |
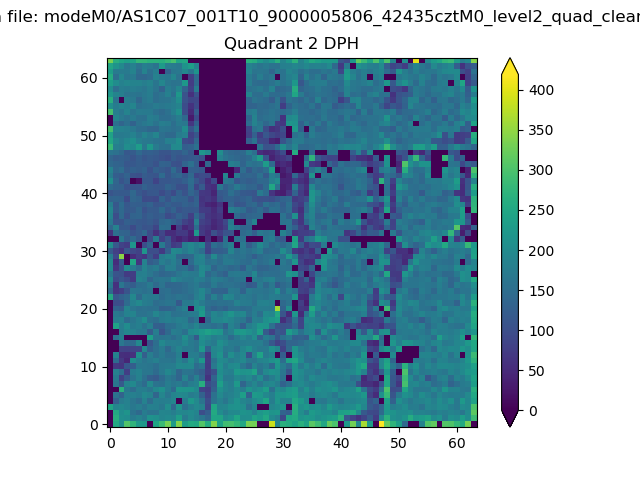 |
Quadrant C |
| Plot type | Count rate plots | Images |
|---|---|---|
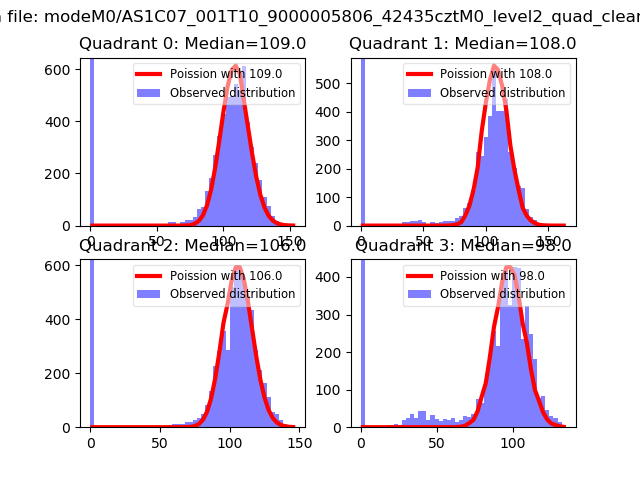
| Comparison with Poisson distribution Blue bars denote a histogram of data divided into 1 sec bins. Red curve is a Poisson curve with rate = median count rate of data. |
 |
 |
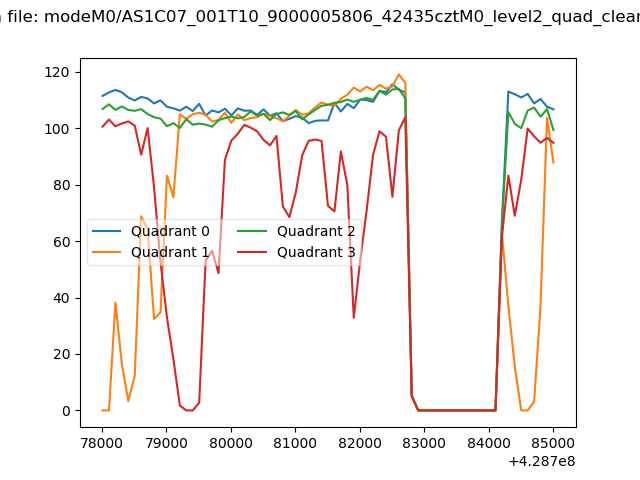
| Quadrant-wise count rates Data is divided into 100 sec bins |
 |
|
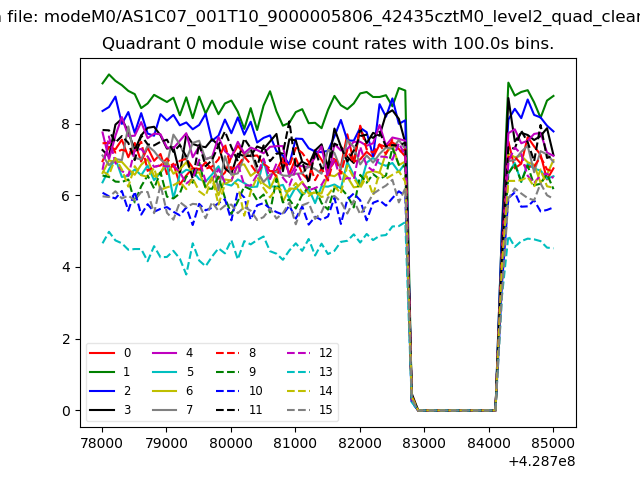
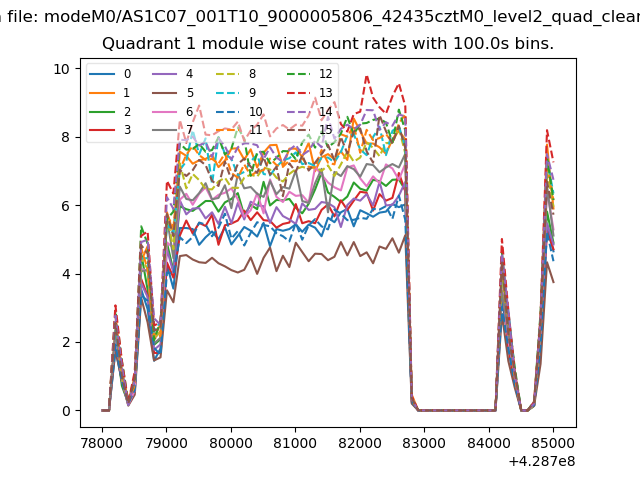
| Module-wise count rates for Quadrant A Data is divided into 100 sec bins |
 |
 |
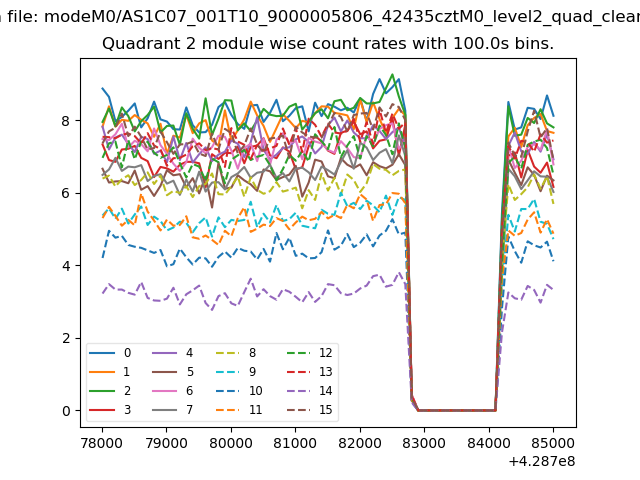
| Module-wise count rates for Quadrant B Data is divided into 100 sec bins |
 |
 |
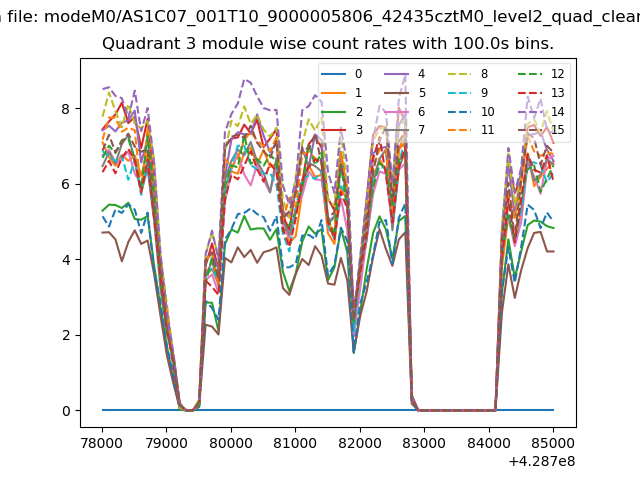
| Module-wise count rates for Quadrant C Data is divided into 100 sec bins |
 |
 |
| Module-wise count rates for Quadrant D Data is divided into 100 sec bins |
 |
 |
| Parameter | Plot |
|---|---|
| CZT HV Monitor | 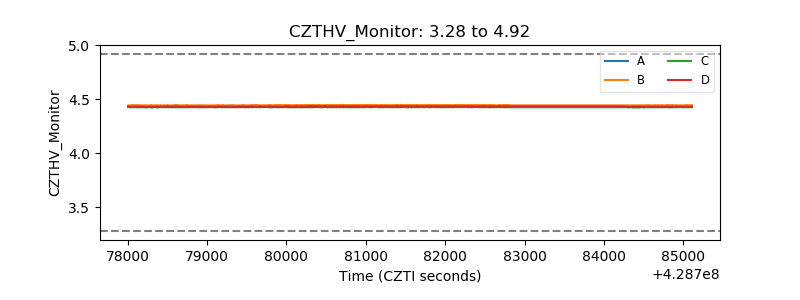 |
| D_VDD | 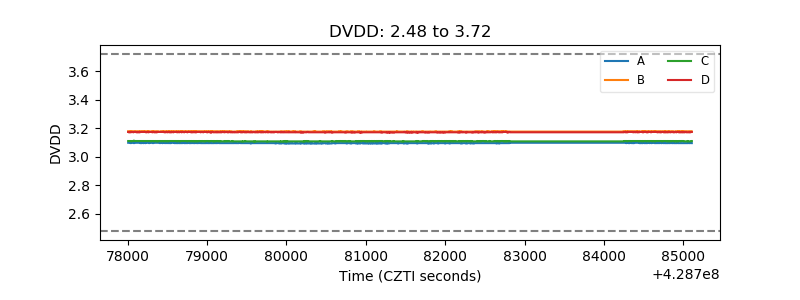 |
| Temperature 1 | 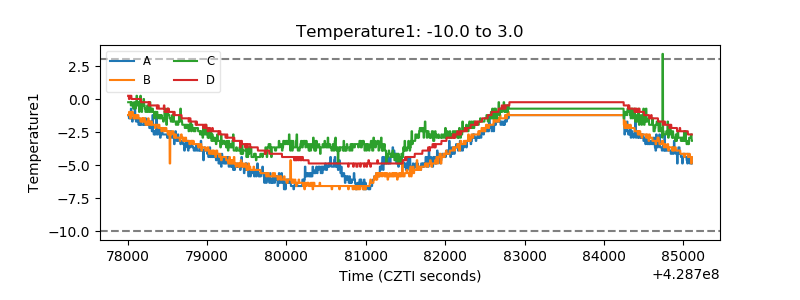 |
| Veto HV Monitor | 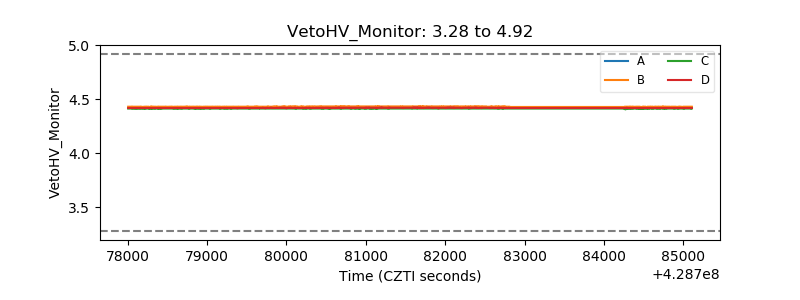 |
| Veto LLD | 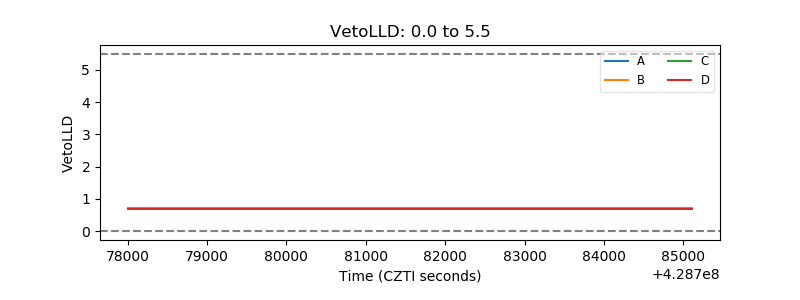 |
| Alpha Counter | 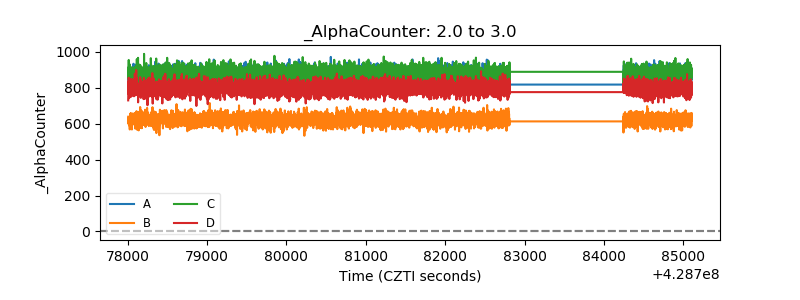 |
| _CPM_Rate | 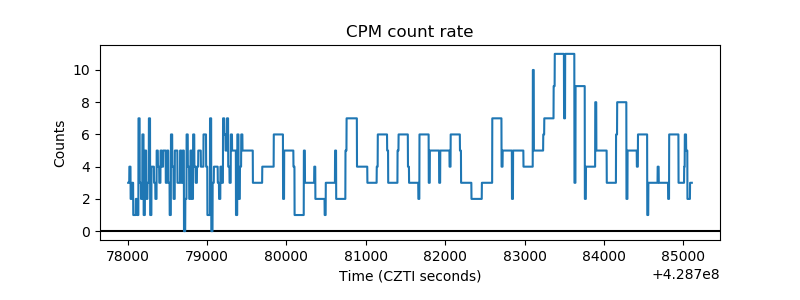 |
| CZT Counter | 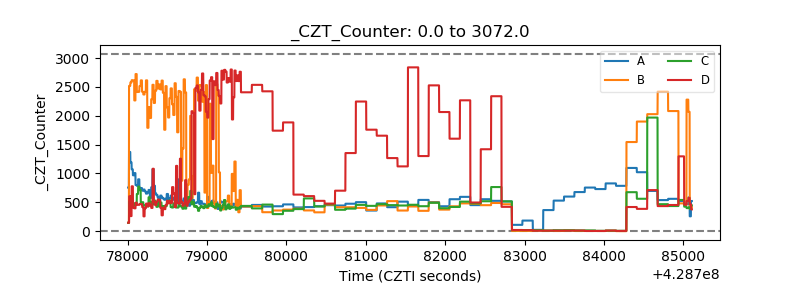 |
| +2.5 Volts monitor | 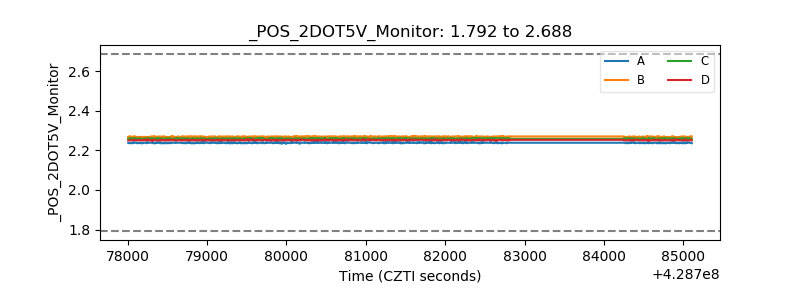 |
| +5 Volts monitor | 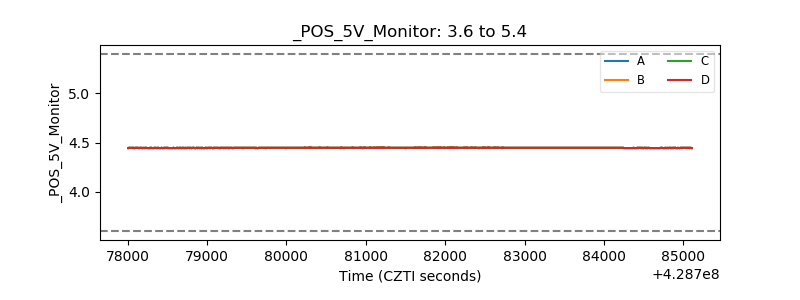 |
| _ROLL_ROT | 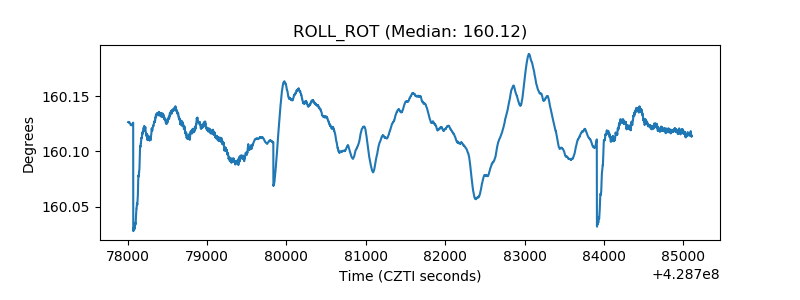 |
| _Roll_DEC | 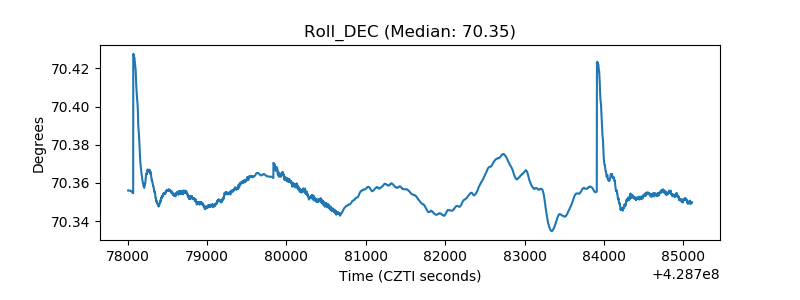 |
| _Roll_RA | 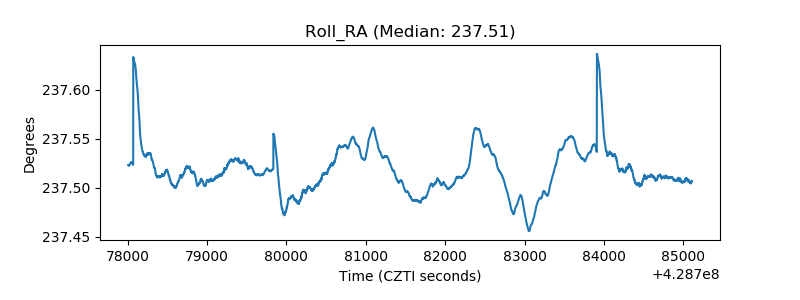 |
| Veto Counter | 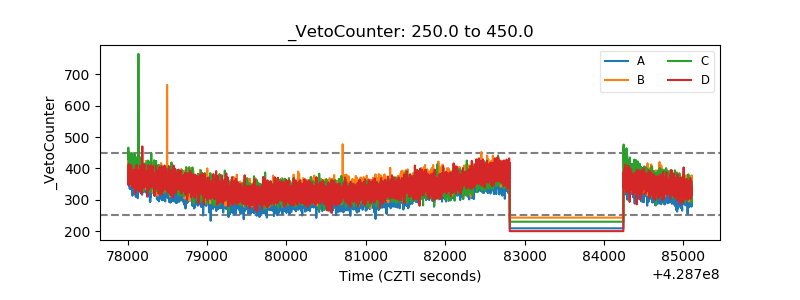 |