| Param | Original file | Final file |
|---|---|---|
| Filename | modeM0/AS1C07_001T10_9000005806_42442cztM0_level2.fits | modeM0/AS1C07_001T10_9000005806_42442cztM0_level2_quad_clean.evt |
| Size (bytes) | 415,497,600 | 81,599,040 |
| Size | 396.2 MB | 77.8 MB |
| Events in quadrant A | 2,955,269 | 587,580 |
| Events in quadrant B | 6,077,890 | 391,397 |
| Events in quadrant C | 2,511,824 | 578,935 |
| Events in quadrant D | 3,413,519 | 533,963 |
| Mode M9 | |||
|---|---|---|---|
| Quadrant | BADHDUFLAG | Total packets | Discarded packets |
| A | 0 | 29 | 0 |
| B | 0 | 30 | 0 |
| C | 0 | 30 | 0 |
| D | 0 | 30 | 0 |
| Mode SS | |||
|---|---|---|---|
| Quadrant | BADHDUFLAG | Total packets | Discarded packets |
| A | 0 | 110 | 0 |
| B | 0 | 110 | 0 |
| C | 0 | 110 | 0 |
| D | 0 | 110 | 0 |
| Mode M0 | |||
|---|---|---|---|
| Quadrant | BADHDUFLAG | Total packets | Discarded packets |
| A | 0 | 11998 | 2 |
| B | 0 | 21939 | 2 |
| C | 0 | 11022 | 2 |
| D | 0 | 14019 | 2 |
| Quadrant | Total seconds | Saturated seconds | Saturation percentage |
|---|---|---|---|
| A | 5412 | 13 | 0.240207% |
| B | 5412 | 1859 | 34.349593% |
| C | 5412 | 8 | 0.147820% |
| D | 5412 | 78 | 1.441242% |
Noise dominated data is calculated using 1-second bins in cleaned event files. If a bin has >2000 counts, and if more than 50% of those come from <1% of pixels, then it is considered to be noise-dominated and hence unusable.
| Quadrant | # 1 sec bins | Bins with >0 counts | Bins with >2000 counts | High rate bins dominated by noise | Noise dominated (total time) | Noise dominated (detector-on time) | Marked lightcurve |
|---|---|---|---|---|---|---|---|
| A | 7145 | 5413 | 5 | 5 | 0.07% | 0.09% | 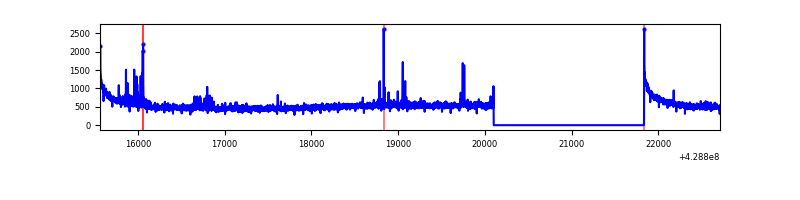 |
| B | 7145 | 5413 | 1602 | 1602 | 22.42% | 29.60% | 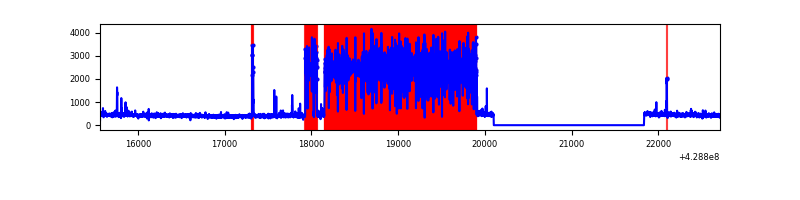 |
| C | 7145 | 5413 | 4 | 4 | 0.06% | 0.07% | 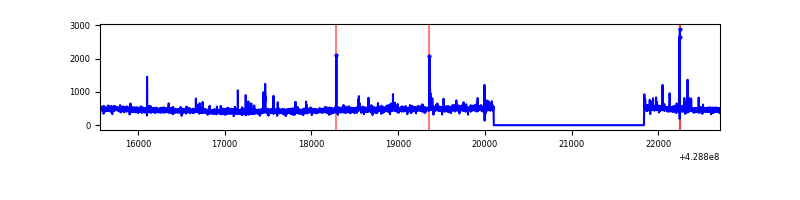 |
| D | 7145 | 5413 | 80 | 80 | 1.12% | 1.48% | 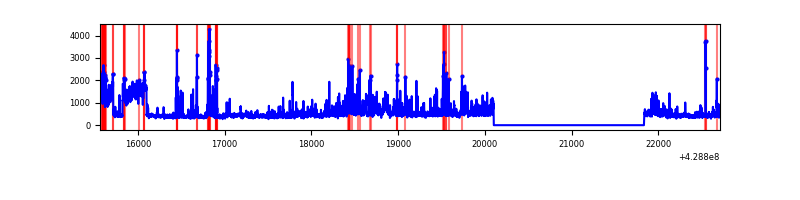 |
Top three noisy pixels from each quadrant. If the there are fewer than three noisy pixels in the level2.evt file, extra rows are filled as -1
| Pixel properties | Quadrant properties | ||||||
|---|---|---|---|---|---|---|---|
| Quadrant | DetID | PixID | Counts | Sigma | Mean | Median | Sigma |
| A | 10 | 83 | 594394 | 4915.95 | 584 | 572 | 120.8 |
| A | 13 | 248 | 68430 | 561.76 | 584 | 572 | 120.8 |
| A | 14 | 223 | 14791 | 117.71 | 584 | 572 | 120.8 |
| B | 0 | 186 | 4166747 | 47680.73 | 452 | 439 | 87.4 |
| B | 5 | 255 | 63831 | 725.48 | 452 | 439 | 87.4 |
| B | 5 | 172 | 28691 | 323.33 | 452 | 439 | 87.4 |
| C | 15 | 214 | 228615 | 1734.62 | 564 | 568 | 131.5 |
| C | 5 | 250 | 32927 | 246.14 | 564 | 568 | 131.5 |
| C | 14 | 254 | 16540 | 121.49 | 564 | 568 | 131.5 |
| D | 1 | 52 | 548569 | 3967.95 | 566 | 550 | 138.1 |
| D | 13 | 171 | 195315 | 1410.2 | 566 | 550 | 138.1 |
| D | 12 | 6 | 151303 | 1091.53 | 566 | 550 | 138.1 |
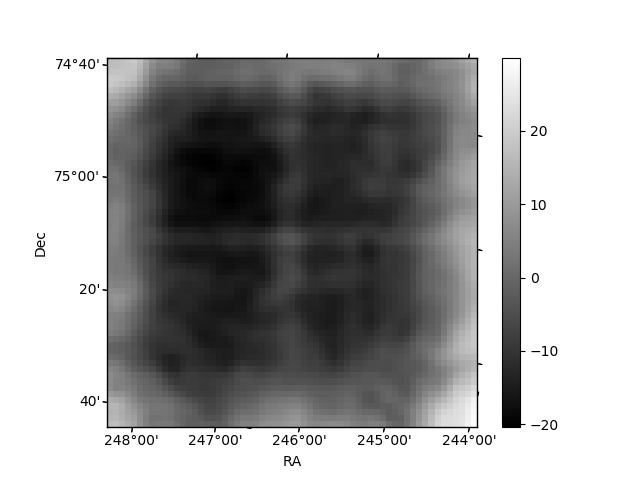
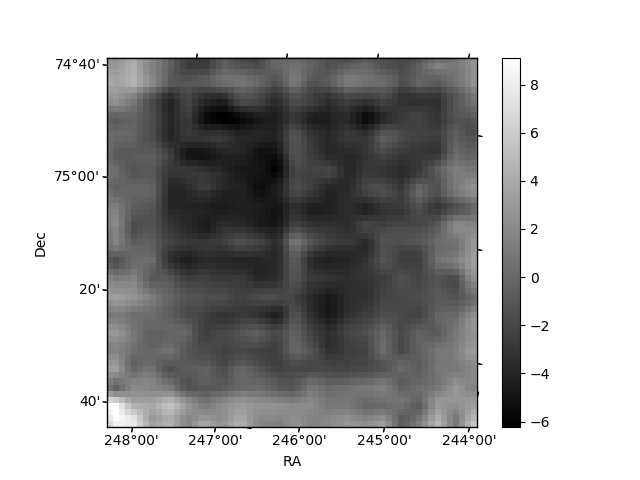
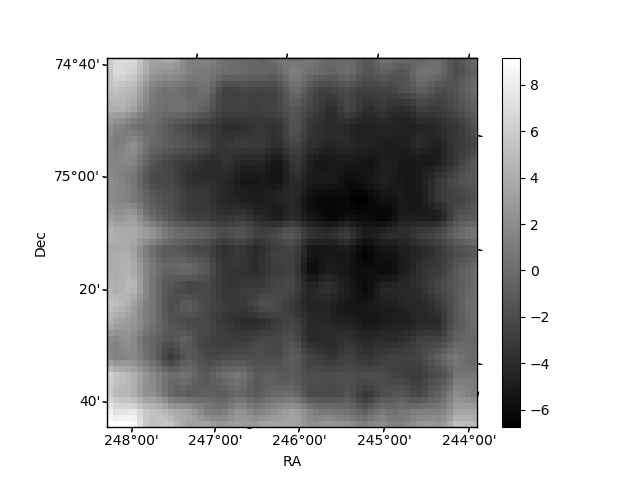
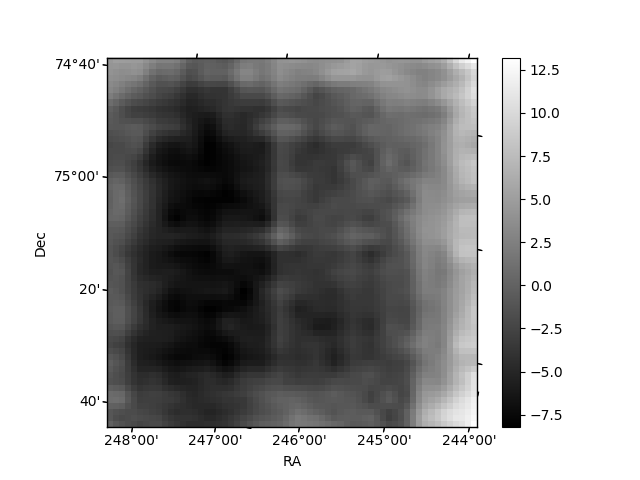
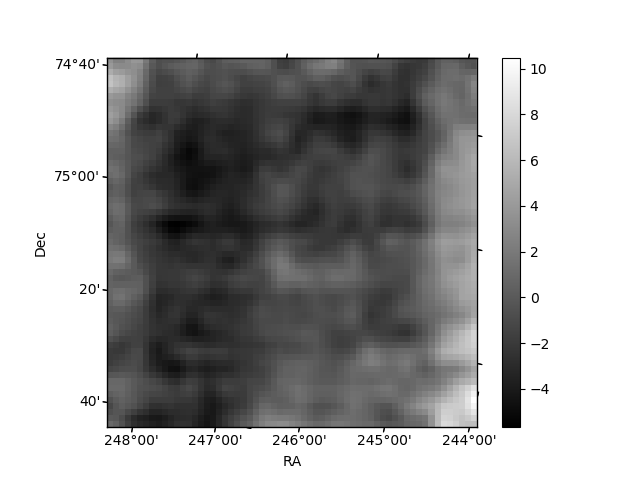
Histogram calculated using DETX and DETY for each event in the final _common_clean file
| Quadrant A | 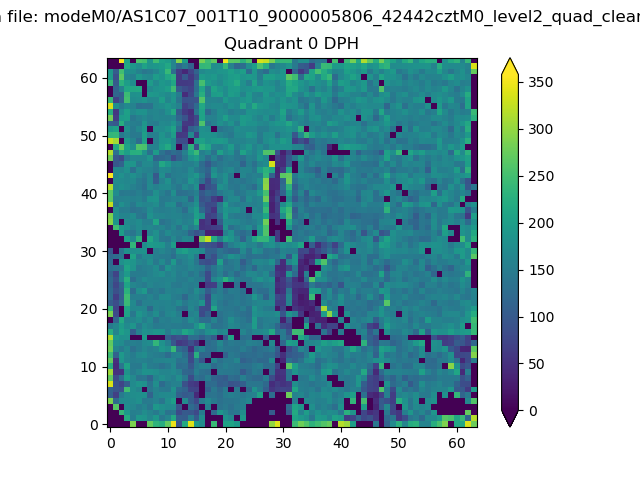 |
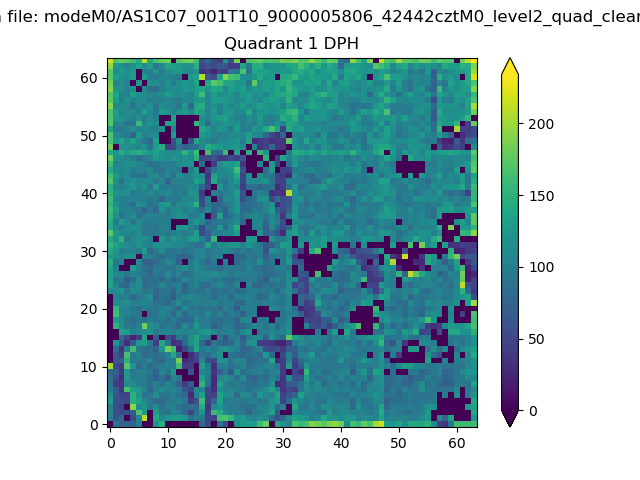 |
Quadrant B |
|---|---|---|---|
| Quadrant D |  |
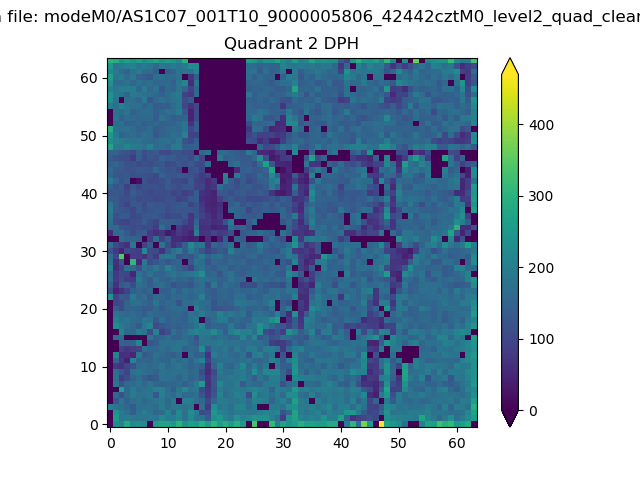 |
Quadrant C |
| Plot type | Count rate plots | Images |
|---|---|---|
| Comparison with Poisson distribution Blue bars denote a histogram of data divided into 1 sec bins. Red curve is a Poisson curve with rate = median count rate of data. |
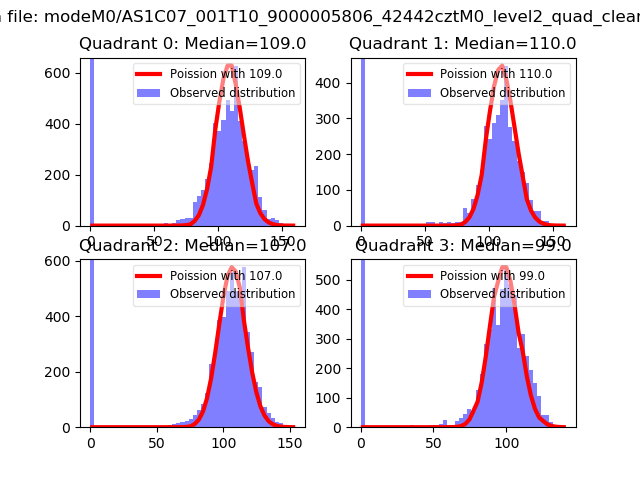 |
 |
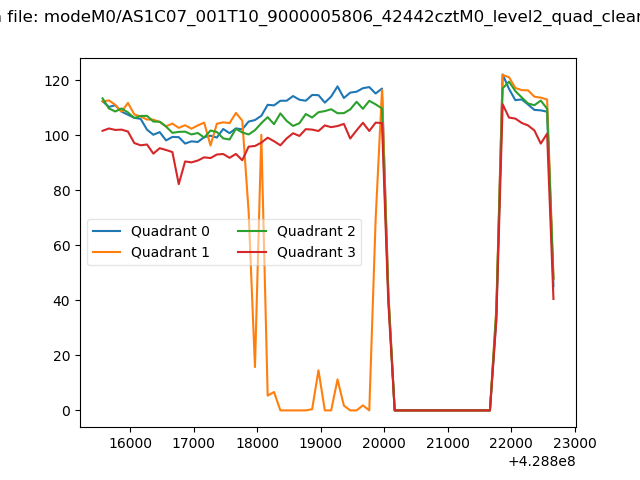
| Quadrant-wise count rates Data is divided into 100 sec bins |
 |
|
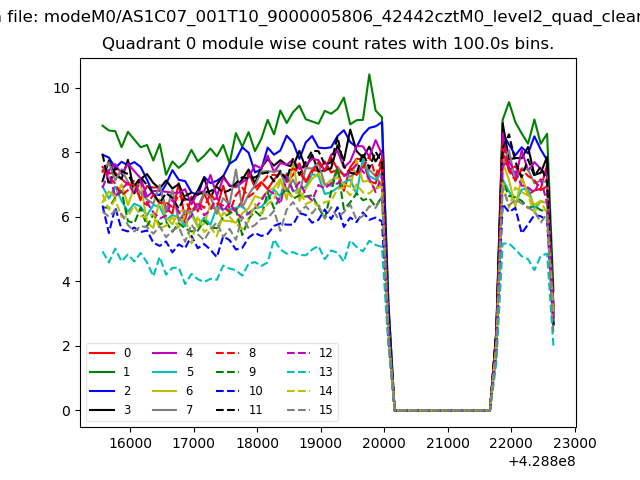
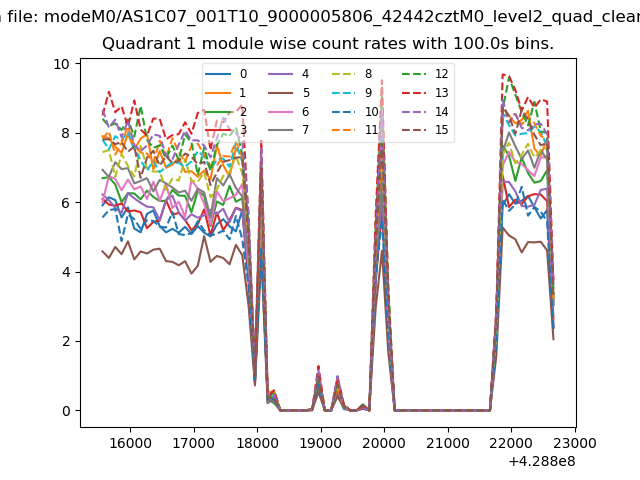
| Module-wise count rates for Quadrant A Data is divided into 100 sec bins |
 |
 |
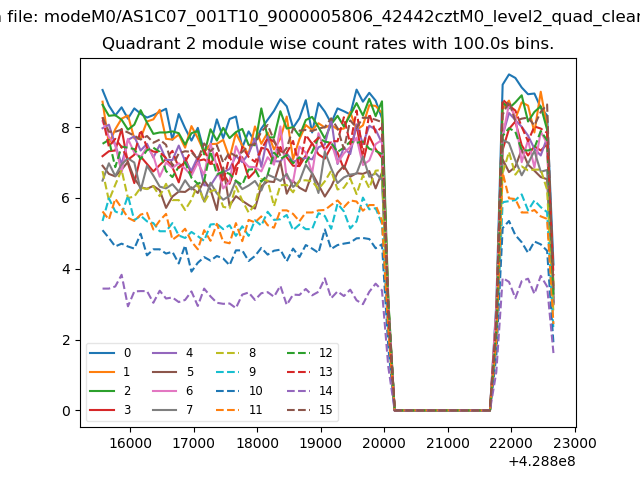
| Module-wise count rates for Quadrant B Data is divided into 100 sec bins |
 |
 |
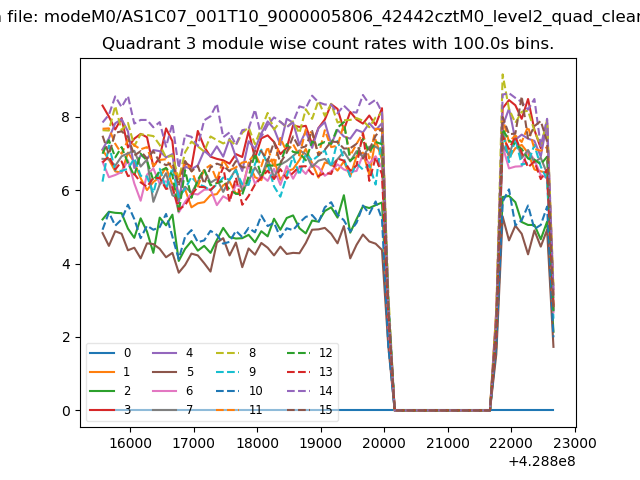
| Module-wise count rates for Quadrant C Data is divided into 100 sec bins |
 |
 |
| Module-wise count rates for Quadrant D Data is divided into 100 sec bins |
 |
 |
| Parameter | Plot |
|---|---|
| CZT HV Monitor | 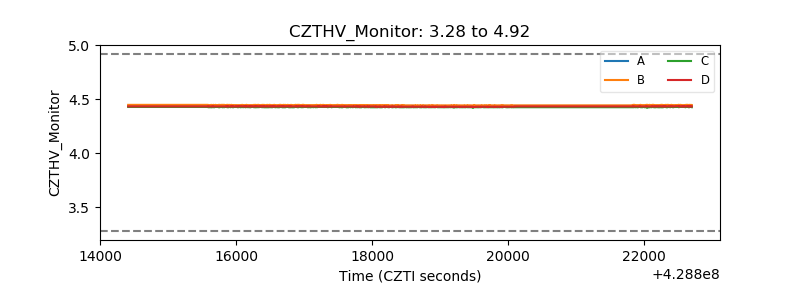 |
| D_VDD | 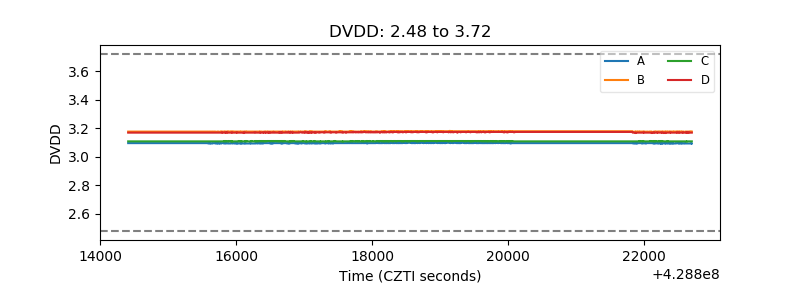 |
| Temperature 1 | 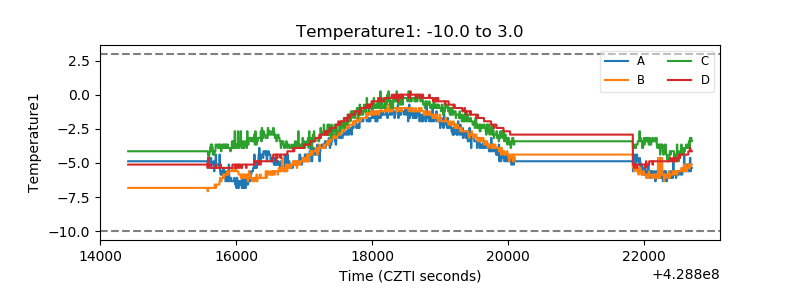 |
| Veto HV Monitor | 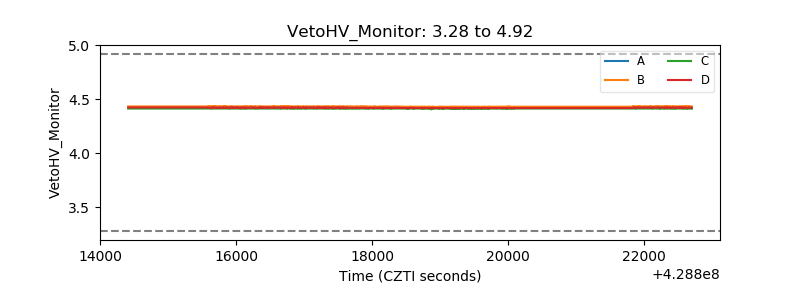 |
| Veto LLD | 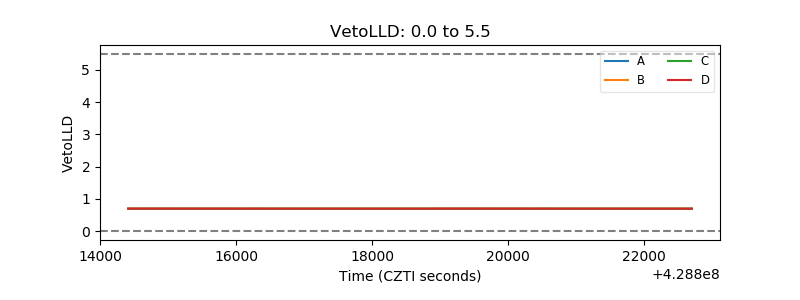 |
| Alpha Counter | 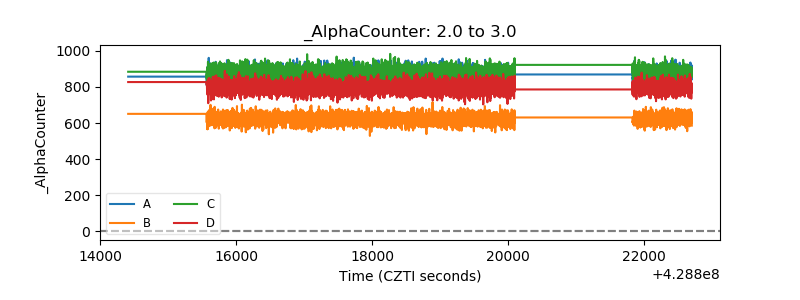 |
| _CPM_Rate |  |
| CZT Counter | 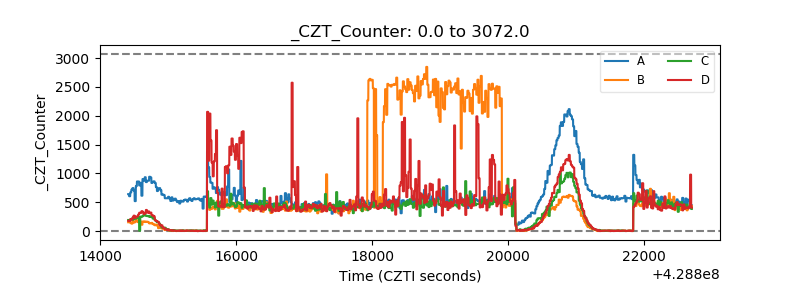 |
| +2.5 Volts monitor |  |
| +5 Volts monitor | 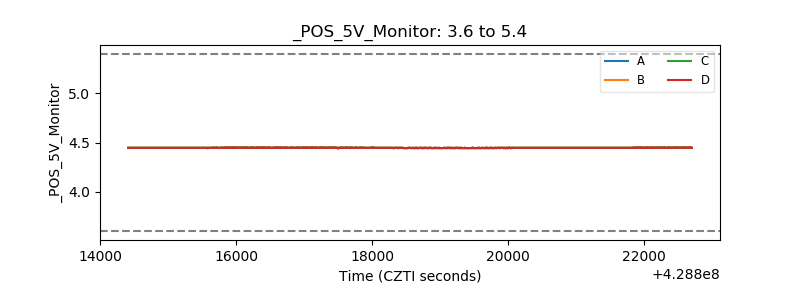 |
| _ROLL_ROT | 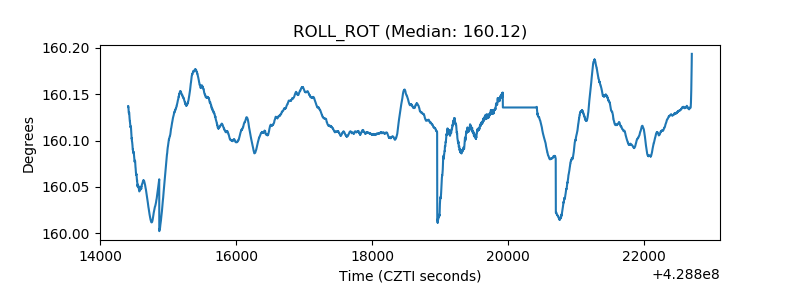 |
| _Roll_DEC | 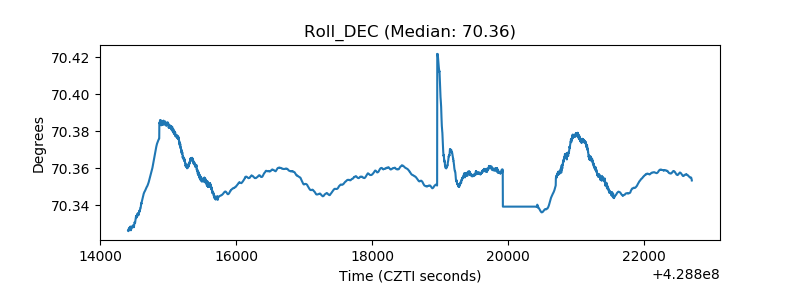 |
| _Roll_RA | 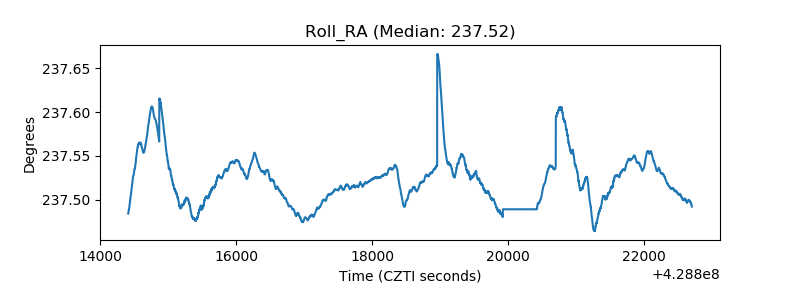 |
| Veto Counter | 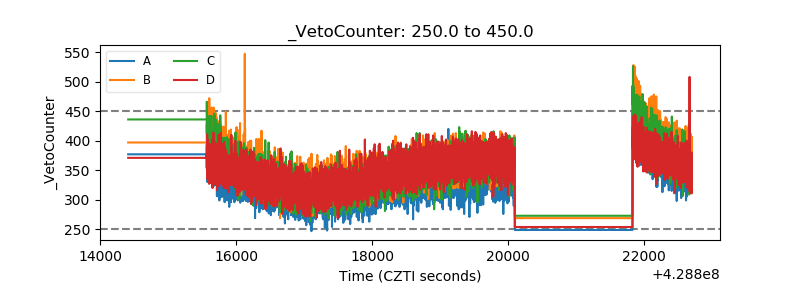 |