| Param | Original file | Final file |
|---|---|---|
| Filename | modeM0/AS1C07_001T10_9000005806_42443cztM0_level2.fits | modeM0/AS1C07_001T10_9000005806_42443cztM0_level2_quad_clean.evt |
| Size (bytes) | 394,369,920 | 82,572,480 |
| Size | 376.1 MB | 78.7 MB |
| Events in quadrant A | 2,836,916 | 597,867 |
| Events in quadrant B | 5,856,153 | 415,092 |
| Events in quadrant C | 2,463,817 | 581,757 |
| Events in quadrant D | 3,031,956 | 537,683 |
| Mode M9 | |||
|---|---|---|---|
| Quadrant | BADHDUFLAG | Total packets | Discarded packets |
| A | 0 | 31 | 0 |
| B | 0 | 32 | 0 |
| C | 0 | 32 | 0 |
| D | 0 | 32 | 0 |
| Mode SS | |||
|---|---|---|---|
| Quadrant | BADHDUFLAG | Total packets | Discarded packets |
| A | 0 | 108 | 0 |
| B | 0 | 108 | 0 |
| C | 0 | 108 | 0 |
| D | 0 | 108 | 0 |
| Mode M0 | |||
|---|---|---|---|
| Quadrant | BADHDUFLAG | Total packets | Discarded packets |
| A | 0 | 11472 | 2 |
| B | 0 | 20977 | 2 |
| C | 0 | 10671 | 2 |
| D | 0 | 12661 | 2 |
| Quadrant | Total seconds | Saturated seconds | Saturation percentage |
|---|---|---|---|
| A | 5249 | 12 | 0.228615% |
| B | 5249 | 1743 | 33.206325% |
| C | 5248 | 8 | 0.152439% |
| D | 5248 | 73 | 1.391006% |
Noise dominated data is calculated using 1-second bins in cleaned event files. If a bin has >2000 counts, and if more than 50% of those come from <1% of pixels, then it is considered to be noise-dominated and hence unusable.
| Quadrant | # 1 sec bins | Bins with >0 counts | Bins with >2000 counts | High rate bins dominated by noise | Noise dominated (total time) | Noise dominated (detector-on time) | Marked lightcurve |
|---|---|---|---|---|---|---|---|
| A | 7100 | 5250 | 2 | 2 | 0.03% | 0.04% | 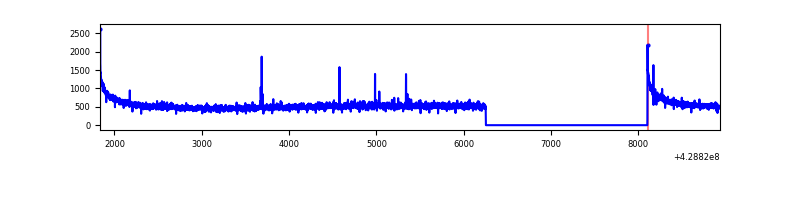 |
| B | 7100 | 5250 | 1415 | 1415 | 19.93% | 26.95% | 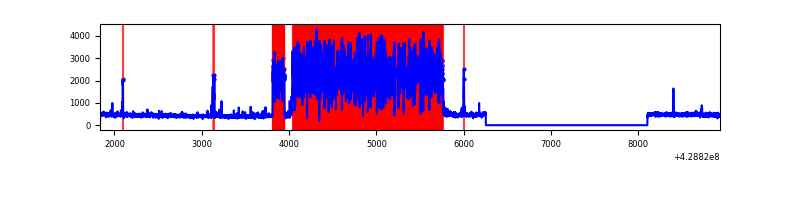 |
| C | 7099 | 5249 | 5 | 5 | 0.07% | 0.10% | 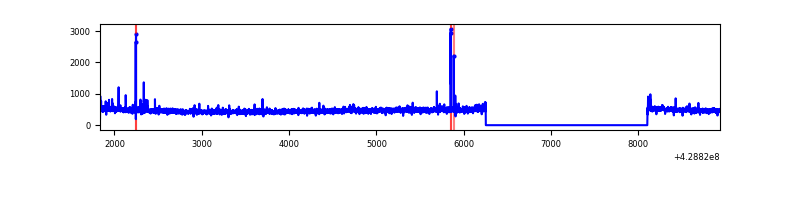 |
| D | 7099 | 5249 | 58 | 58 | 0.82% | 1.10% | 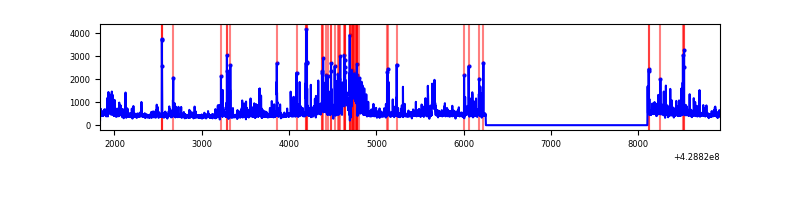 |
Top three noisy pixels from each quadrant. If the there are fewer than three noisy pixels in the level2.evt file, extra rows are filled as -1
| Pixel properties | Quadrant properties | ||||||
|---|---|---|---|---|---|---|---|
| Quadrant | DetID | PixID | Counts | Sigma | Mean | Median | Sigma |
| A | 10 | 83 | 570750 | 4777.7 | 580 | 569 | 119.3 |
| A | 13 | 254 | 9754 | 76.96 | 580 | 569 | 119.3 |
| A | 14 | 223 | 9073 | 71.26 | 580 | 569 | 119.3 |
| B | 0 | 186 | 3836273 | 42756.84 | 468 | 455 | 89.7 |
| B | 4 | 141 | 41237 | 454.59 | 468 | 455 | 89.7 |
| B | 5 | 255 | 35526 | 390.93 | 468 | 455 | 89.7 |
| C | 15 | 214 | 225895 | 1742.54 | 556 | 560 | 129.3 |
| C | 5 | 250 | 27757 | 210.32 | 556 | 560 | 129.3 |
| C | 14 | 254 | 19352 | 145.32 | 556 | 560 | 129.3 |
| D | 2 | 120 | 147308 | 1082.93 | 559 | 544 | 135.5 |
| D | 1 | 52 | 145338 | 1068.39 | 559 | 544 | 135.5 |
| D | 13 | 171 | 125314 | 920.64 | 559 | 544 | 135.5 |
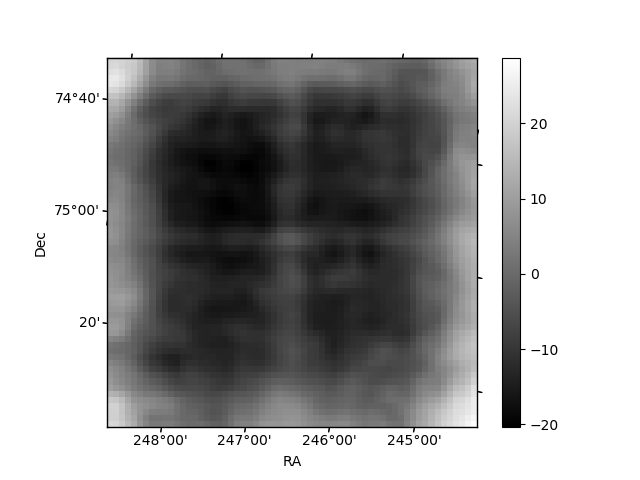
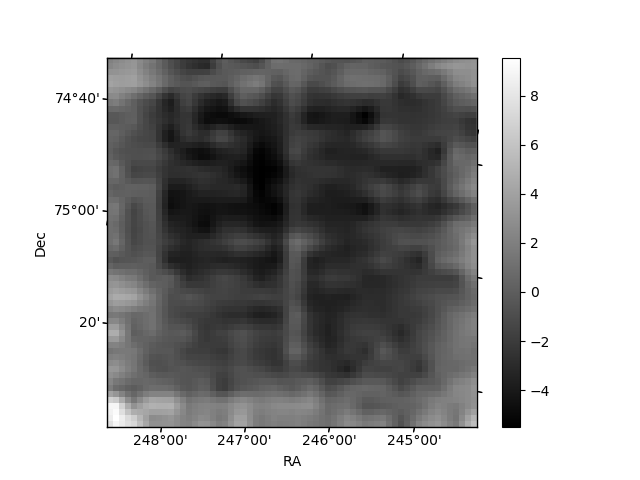
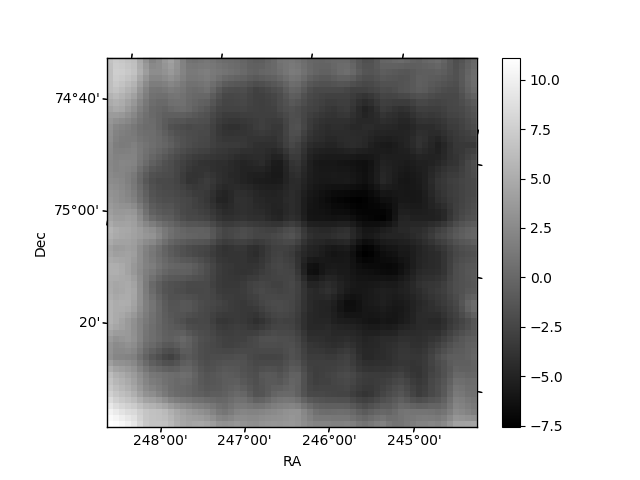
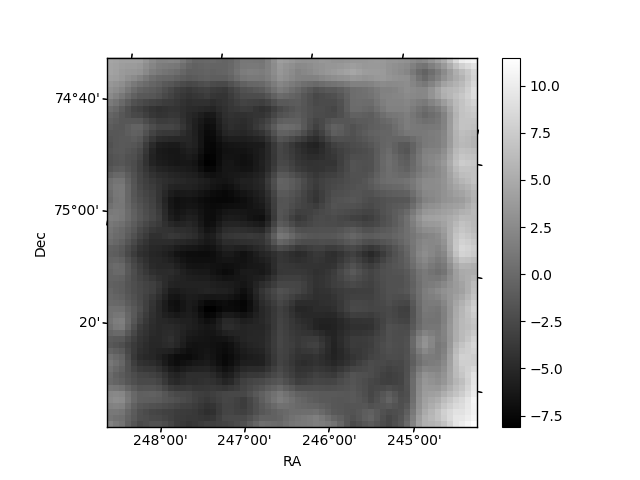
Histogram calculated using DETX and DETY for each event in the final _common_clean file
| Quadrant A | 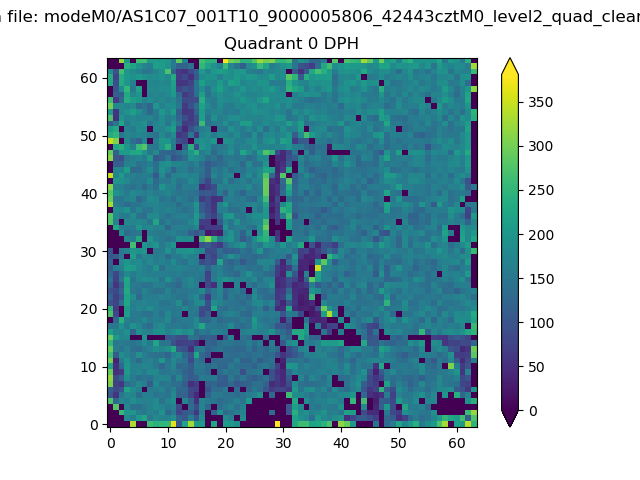 |
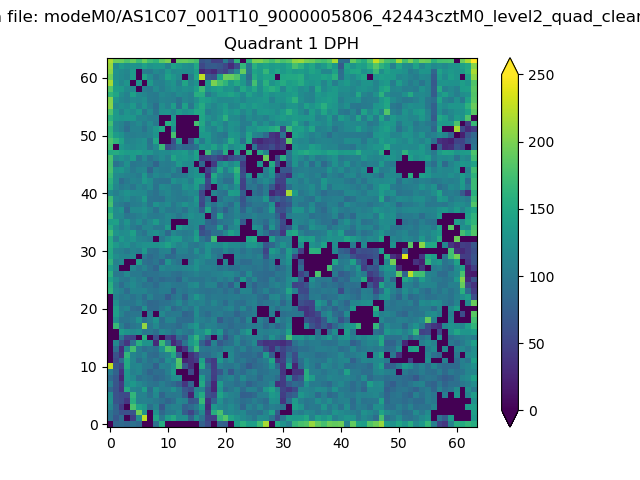 |
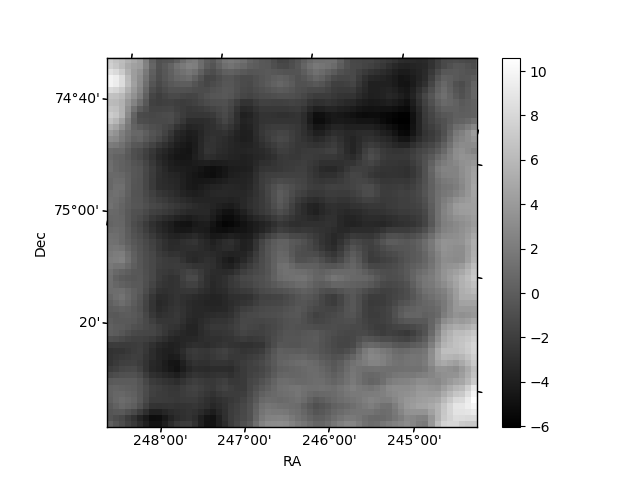
Quadrant B |
|---|---|---|---|
| Quadrant D | 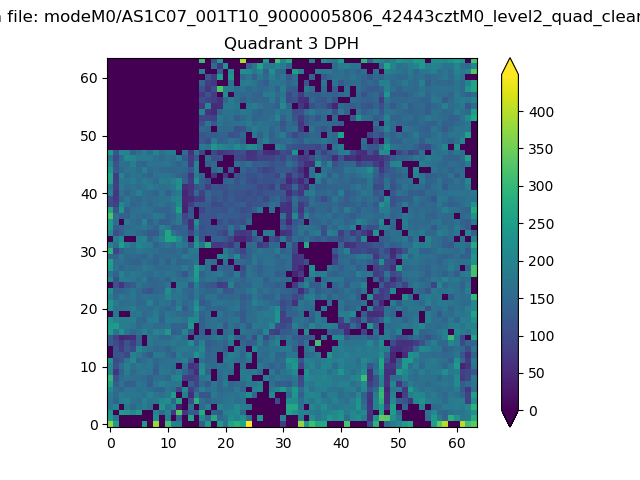 |
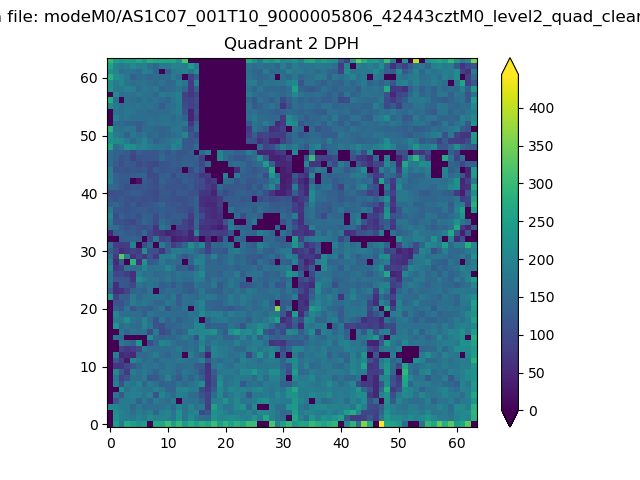 |
Quadrant C |
| Plot type | Count rate plots | Images |
|---|---|---|
| Comparison with Poisson distribution Blue bars denote a histogram of data divided into 1 sec bins. Red curve is a Poisson curve with rate = median count rate of data. |
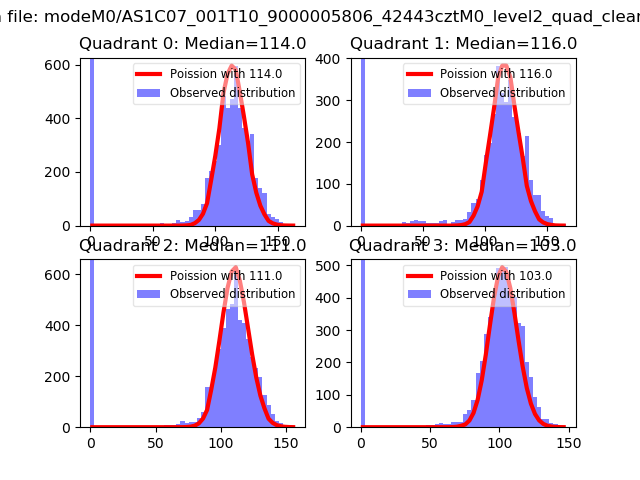 |
 |
| Quadrant-wise count rates Data is divided into 100 sec bins |
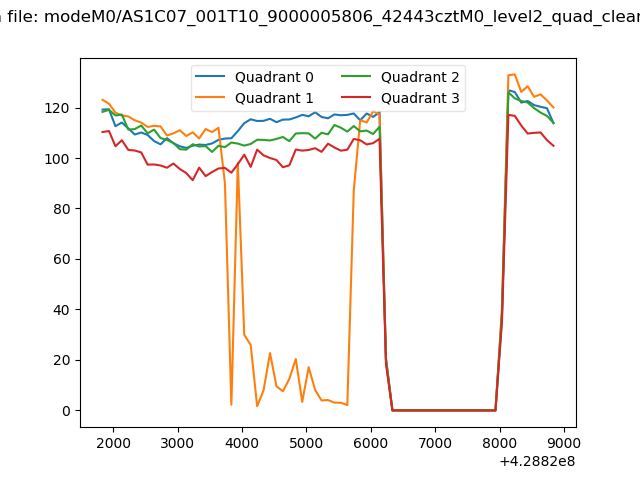 |
|
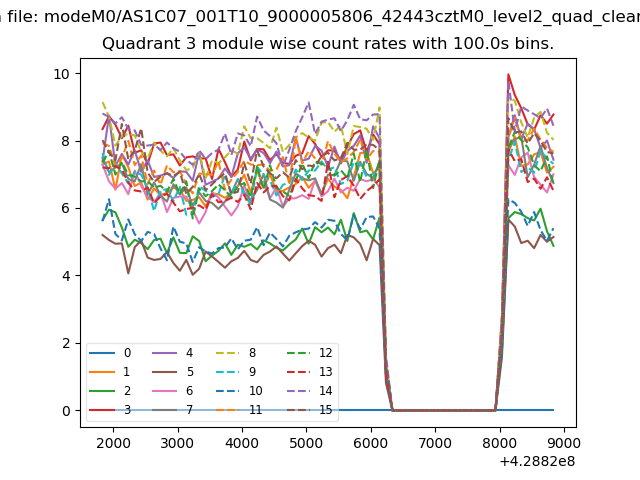
| Module-wise count rates for Quadrant A Data is divided into 100 sec bins |
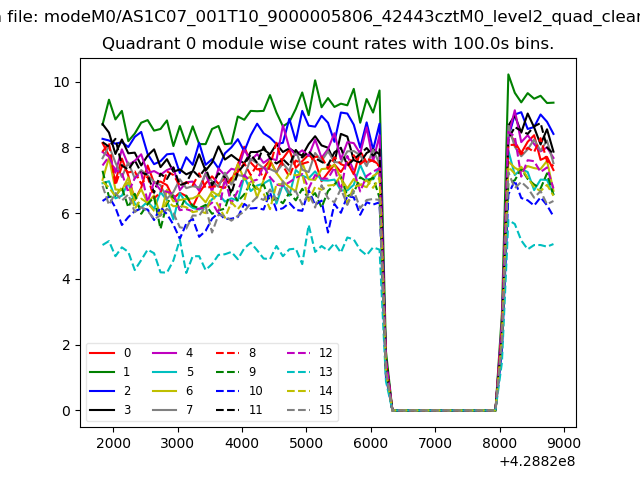 |
 |
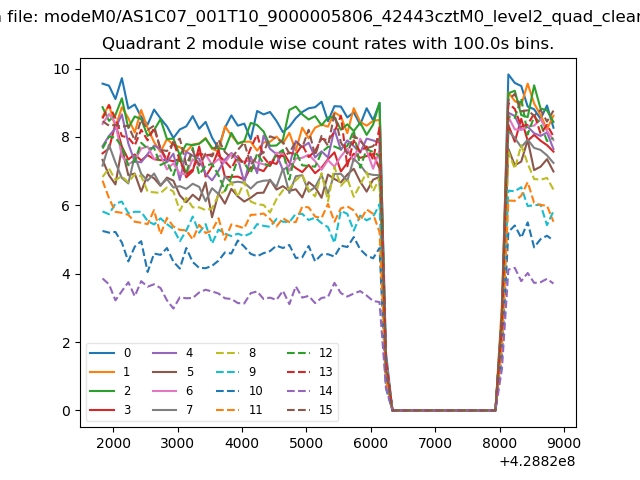
| Module-wise count rates for Quadrant B Data is divided into 100 sec bins |
 |
 |
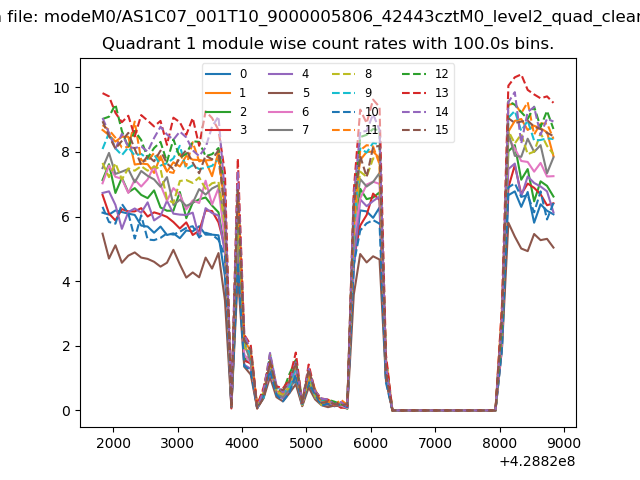
| Module-wise count rates for Quadrant C Data is divided into 100 sec bins |
 |
 |
| Module-wise count rates for Quadrant D Data is divided into 100 sec bins |
 |
 |
| Parameter | Plot |
|---|---|
| CZT HV Monitor | 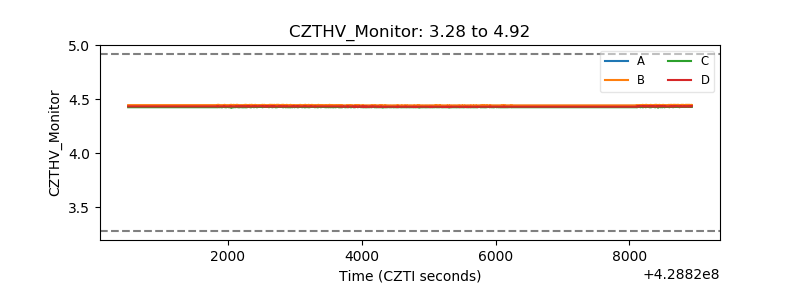 |
| D_VDD | 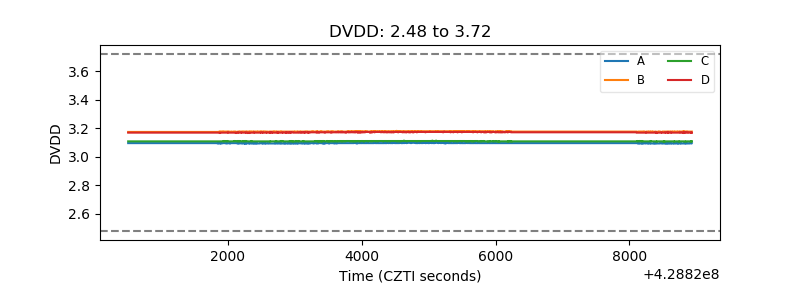 |
| Temperature 1 | 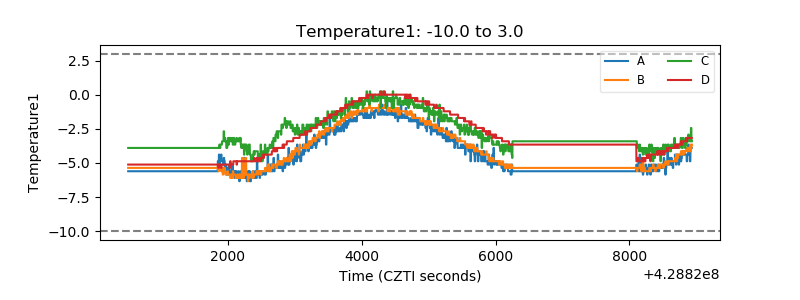 |
| Veto HV Monitor | 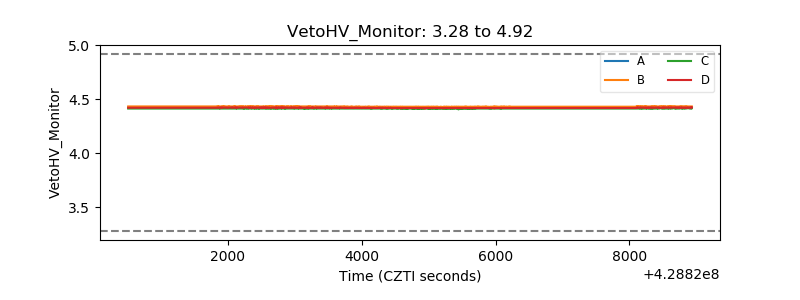 |
| Veto LLD | 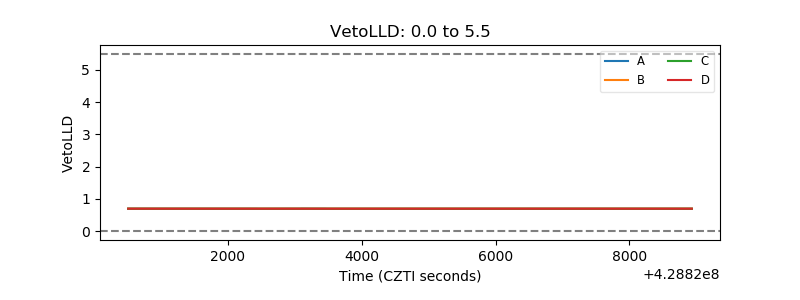 |
| Alpha Counter | 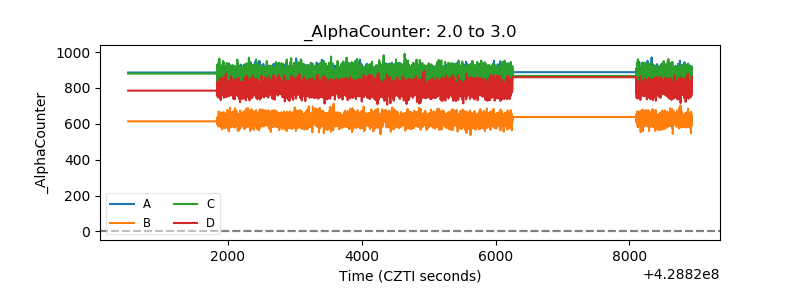 |
| _CPM_Rate | 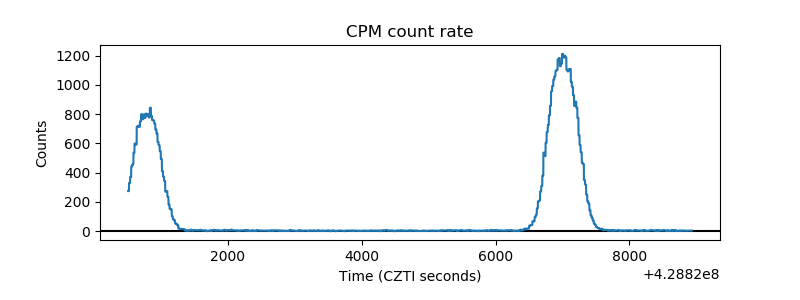 |
| CZT Counter | 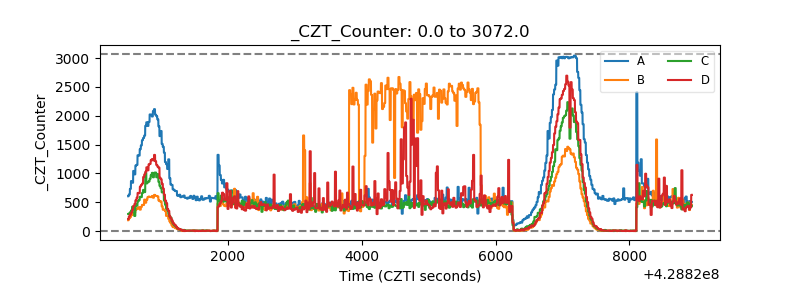 |
| +2.5 Volts monitor | 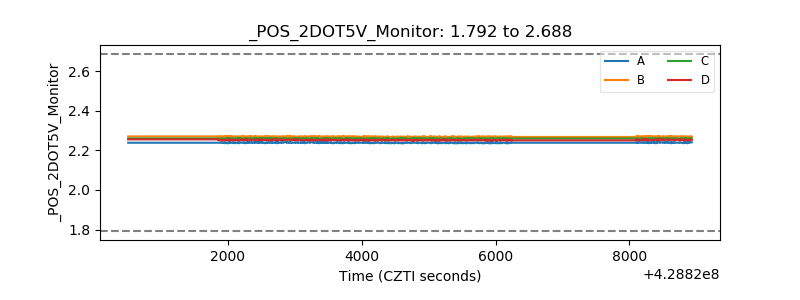 |
| +5 Volts monitor | 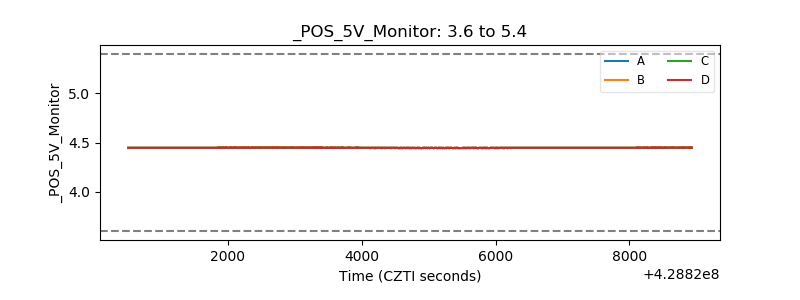 |
| _ROLL_ROT | 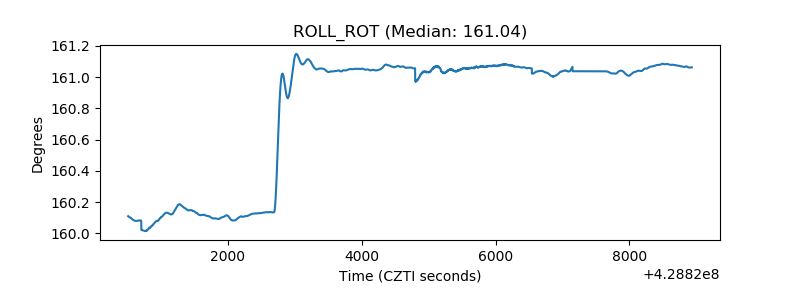 |
| _Roll_DEC | 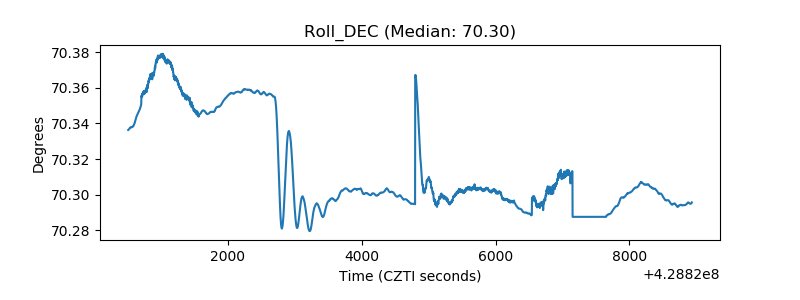 |
| _Roll_RA | 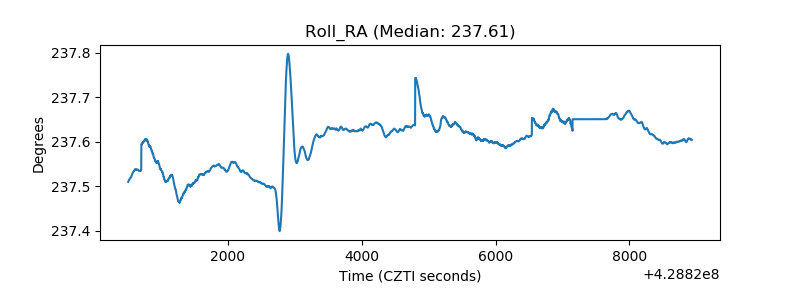 |
| Veto Counter | 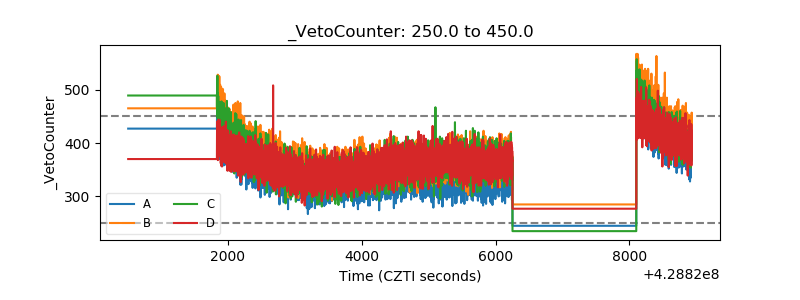 |