| Param | Original file | Final file |
|---|---|---|
| Filename | modeM0/AS1C07_001T10_9000005806_42444cztM0_level2.fits | modeM0/AS1C07_001T10_9000005806_42444cztM0_level2_quad_clean.evt |
| Size (bytes) | 386,130,240 | 81,866,880 |
| Size | 368.2 MB | 78.1 MB |
| Events in quadrant A | 2,835,662 | 604,969 |
| Events in quadrant B | 5,829,427 | 404,870 |
| Events in quadrant C | 2,370,147 | 579,021 |
| Events in quadrant D | 2,865,876 | 537,555 |
| Mode M9 | |||
|---|---|---|---|
| Quadrant | BADHDUFLAG | Total packets | Discarded packets |
| A | 0 | 23 | 0 |
| B | 0 | 24 | 0 |
| C | 0 | 24 | 0 |
| D | 0 | 24 | 0 |
| Mode SS | |||
|---|---|---|---|
| Quadrant | BADHDUFLAG | Total packets | Discarded packets |
| A | 0 | 104 | 0 |
| B | 0 | 104 | 0 |
| C | 0 | 104 | 0 |
| D | 0 | 104 | 0 |
| Mode M0 | |||
|---|---|---|---|
| Quadrant | BADHDUFLAG | Total packets | Discarded packets |
| A | 0 | 11292 | 2 |
| B | 0 | 20626 | 2 |
| C | 0 | 10170 | 2 |
| D | 0 | 11778 | 2 |
| Quadrant | Total seconds | Saturated seconds | Saturation percentage |
|---|---|---|---|
| A | 5026 | 19 | 0.378034% |
| B | 5026 | 1777 | 35.356148% |
| C | 5026 | 4 | 0.079586% |
| D | 5026 | 76 | 1.512137% |
Noise dominated data is calculated using 1-second bins in cleaned event files. If a bin has >2000 counts, and if more than 50% of those come from <1% of pixels, then it is considered to be noise-dominated and hence unusable.
| Quadrant | # 1 sec bins | Bins with >0 counts | Bins with >2000 counts | High rate bins dominated by noise | Noise dominated (total time) | Noise dominated (detector-on time) | Marked lightcurve |
|---|---|---|---|---|---|---|---|
| A | 7028 | 5027 | 7 | 7 | 0.10% | 0.14% | 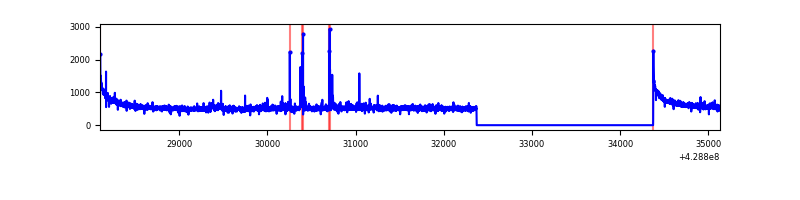 |
| B | 7028 | 5027 | 1631 | 1631 | 23.21% | 32.44% | 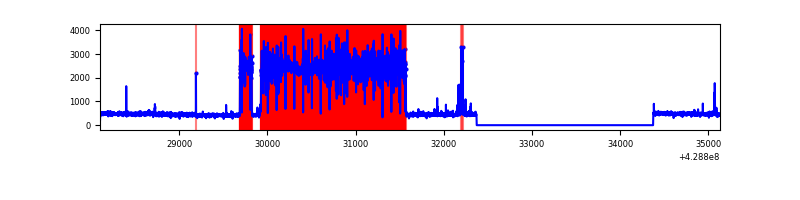 |
| C | 7028 | 5027 | 1 | 1 | 0.01% | 0.02% | 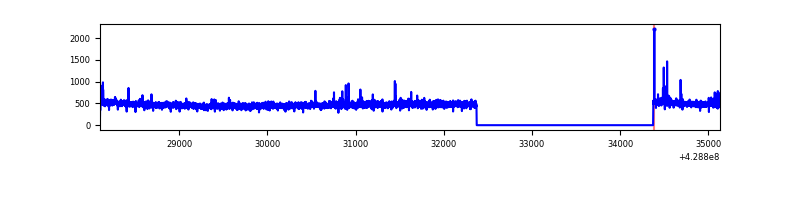 |
| D | 7028 | 5027 | 63 | 63 | 0.90% | 1.25% | 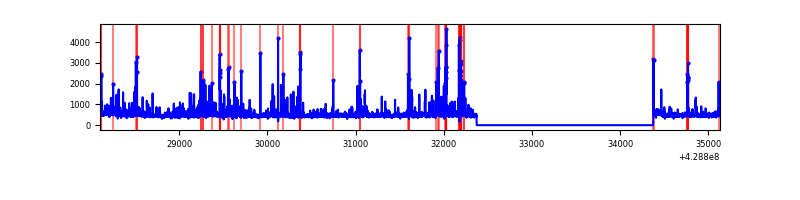 |
Top three noisy pixels from each quadrant. If the there are fewer than three noisy pixels in the level2.evt file, extra rows are filled as -1
| Pixel properties | Quadrant properties | ||||||
|---|---|---|---|---|---|---|---|
| Quadrant | DetID | PixID | Counts | Sigma | Mean | Median | Sigma |
| A | 10 | 83 | 561361 | 4803.43 | 571 | 561 | 116.7 |
| A | 15 | 223 | 24005 | 200.81 | 571 | 561 | 116.7 |
| A | 14 | 223 | 23272 | 194.53 | 571 | 561 | 116.7 |
| B | 0 | 186 | 4007621 | 47027.34 | 440 | 428 | 85.2 |
| B | 5 | 172 | 31212 | 361.27 | 440 | 428 | 85.2 |
| B | 3 | 112 | 27215 | 314.37 | 440 | 428 | 85.2 |
| C | 15 | 214 | 215561 | 1718.87 | 544 | 546 | 125.1 |
| C | 10 | 34 | 17293 | 133.88 | 544 | 546 | 125.1 |
| C | 5 | 250 | 5394 | 38.76 | 544 | 546 | 125.1 |
| D | 1 | 47 | 134686 | 1002.03 | 550 | 535 | 133.9 |
| D | 1 | 52 | 126279 | 939.23 | 550 | 535 | 133.9 |
| D | 2 | 16 | 118700 | 882.62 | 550 | 535 | 133.9 |
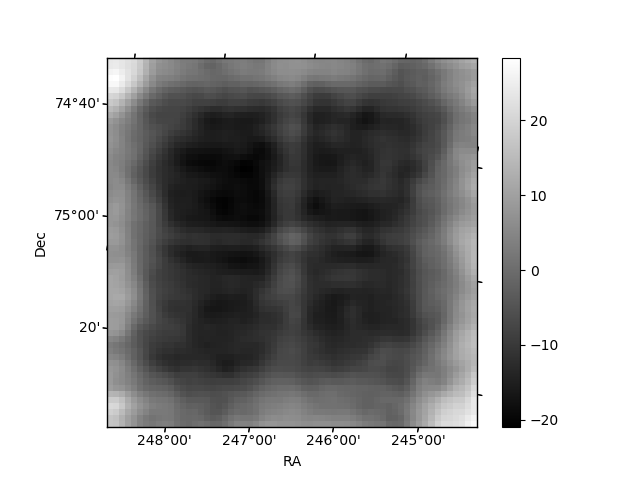
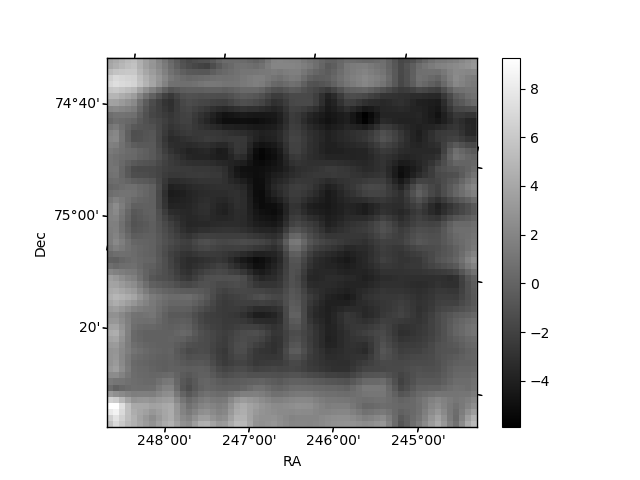
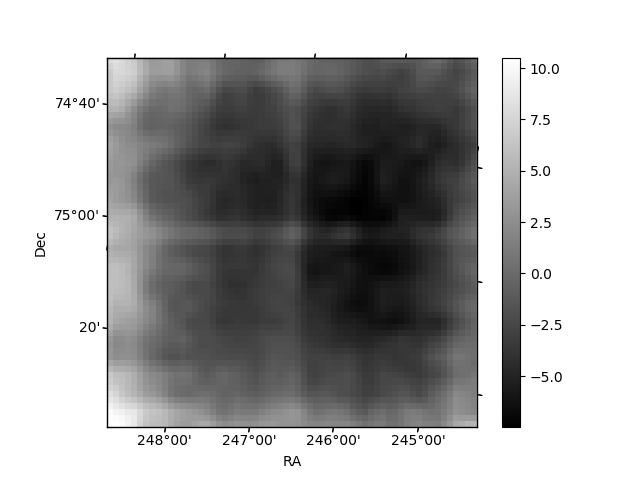
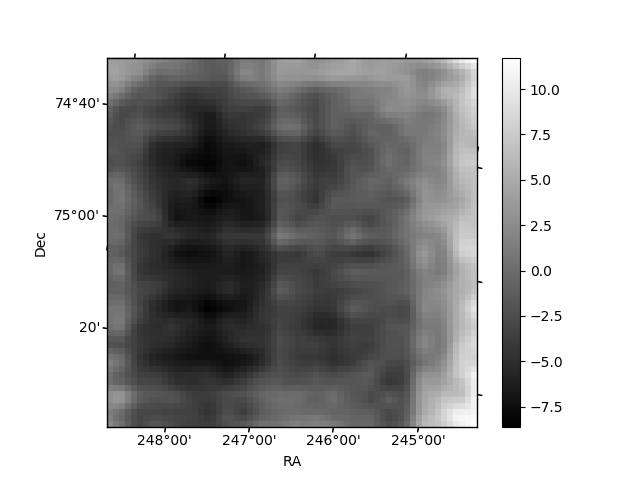
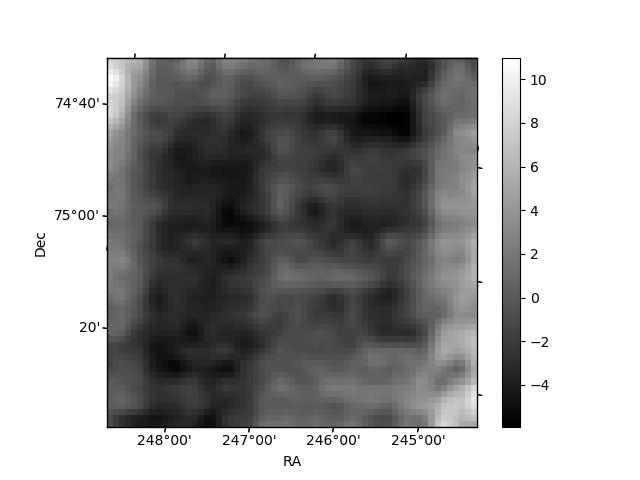
Histogram calculated using DETX and DETY for each event in the final _common_clean file
| Quadrant A | 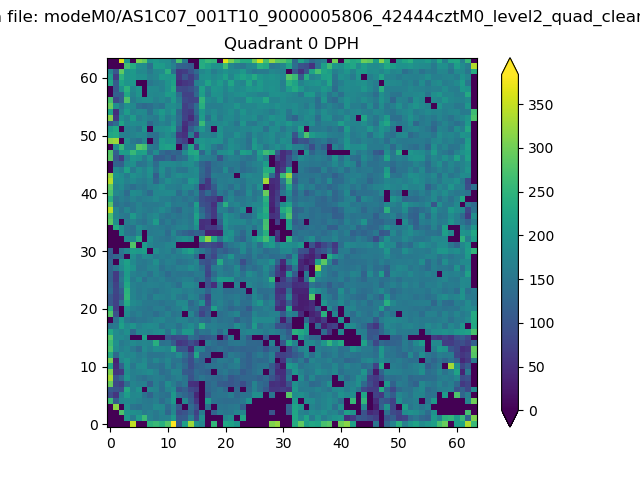 |
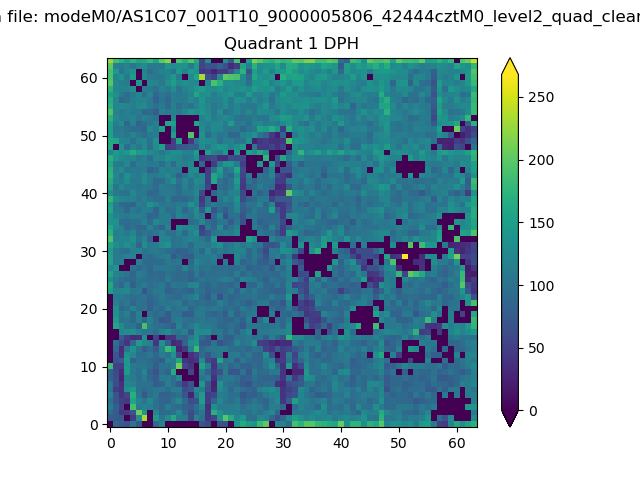 |
Quadrant B |
|---|---|---|---|
| Quadrant D | 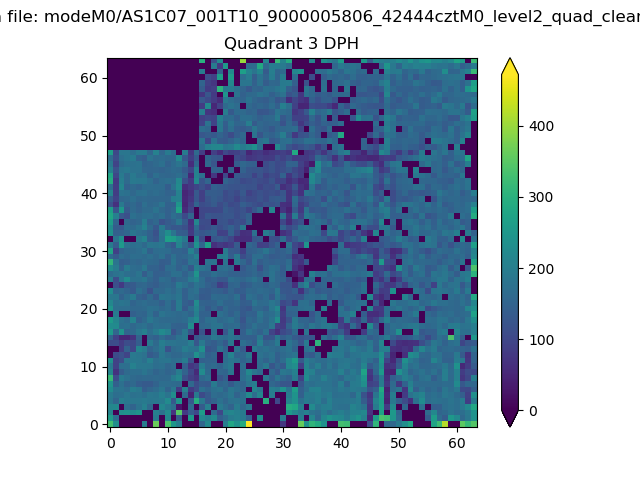 |
 |
Quadrant C |
| Plot type | Count rate plots | Images |
|---|---|---|
| Comparison with Poisson distribution Blue bars denote a histogram of data divided into 1 sec bins. Red curve is a Poisson curve with rate = median count rate of data. |
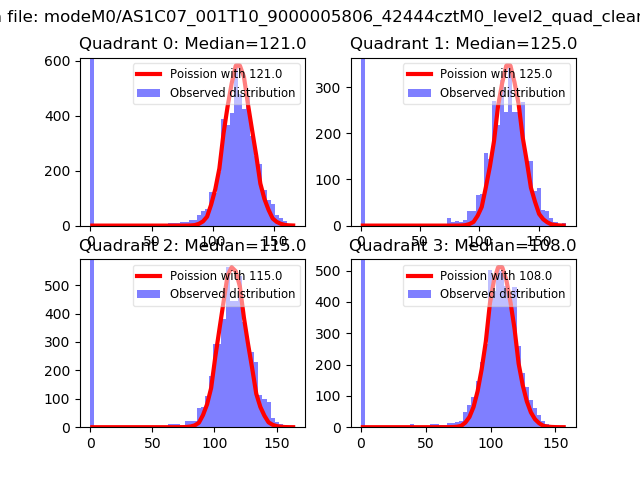 |
 |
| Quadrant-wise count rates Data is divided into 100 sec bins |
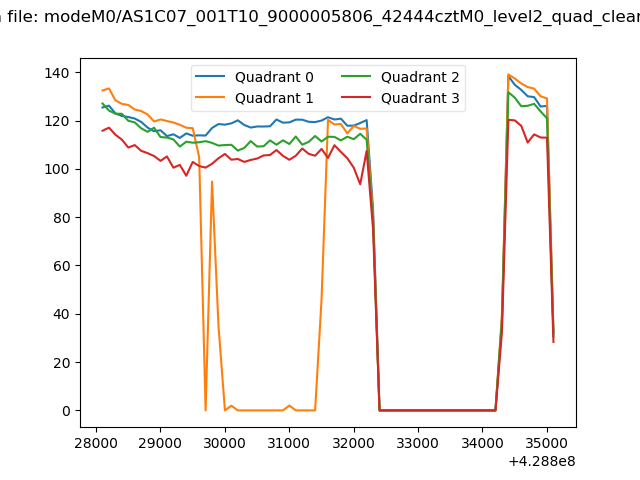 |
|
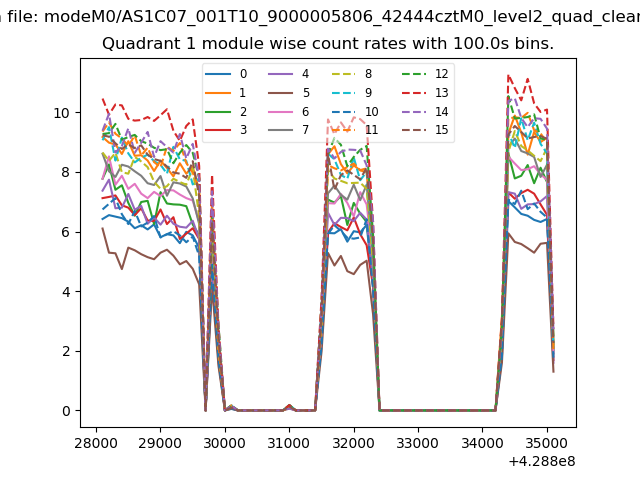
| Module-wise count rates for Quadrant A Data is divided into 100 sec bins |
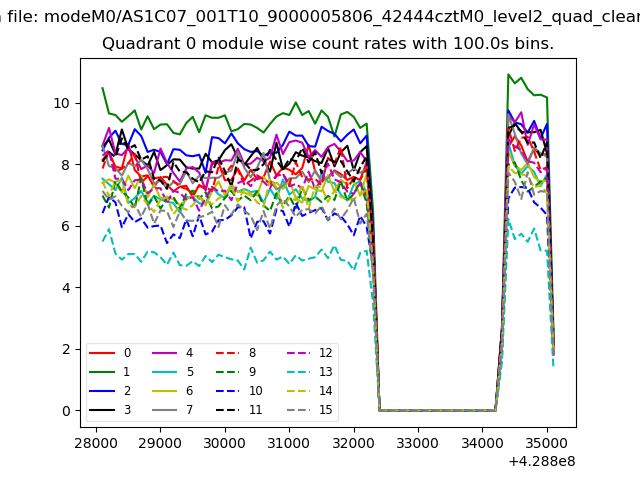 |
 |
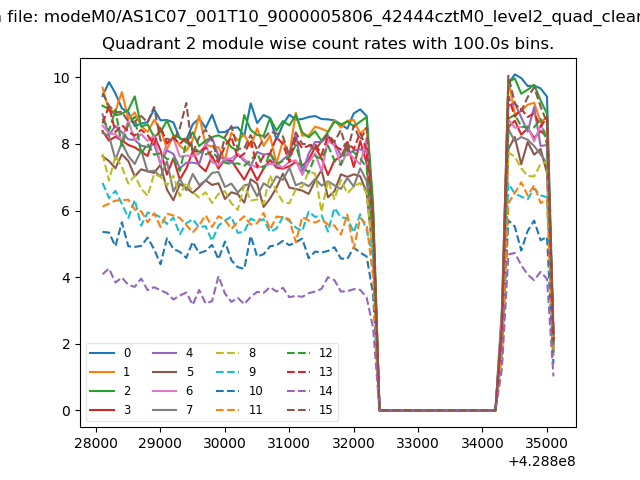
| Module-wise count rates for Quadrant B Data is divided into 100 sec bins |
 |
 |
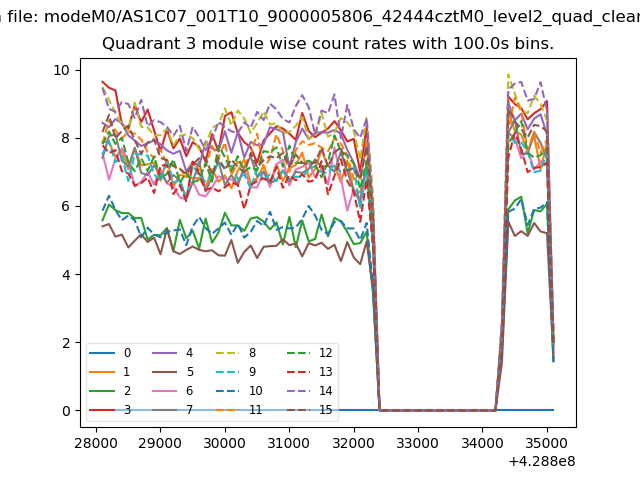
| Module-wise count rates for Quadrant C Data is divided into 100 sec bins |
 |
 |
| Module-wise count rates for Quadrant D Data is divided into 100 sec bins |
 |
 |
| Parameter | Plot |
|---|---|
| CZT HV Monitor | 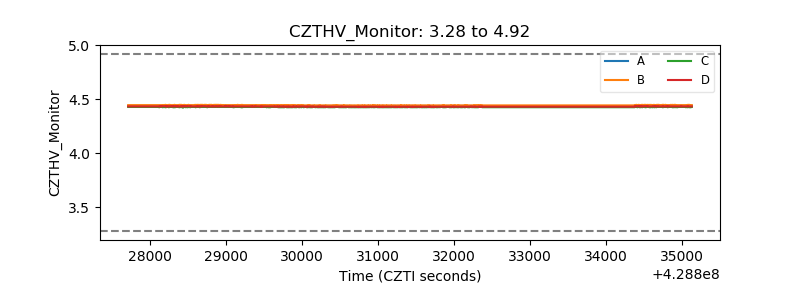 |
| D_VDD | 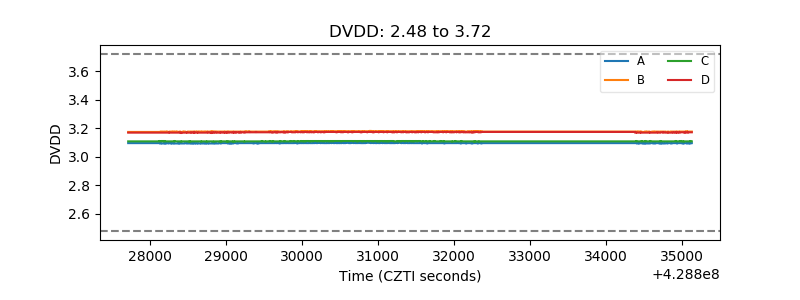 |
| Temperature 1 | 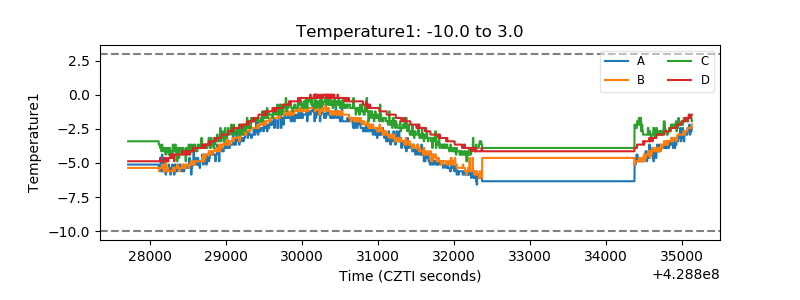 |
| Veto HV Monitor | 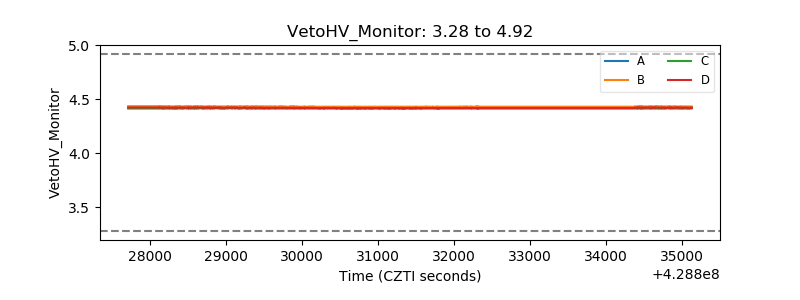 |
| Veto LLD | 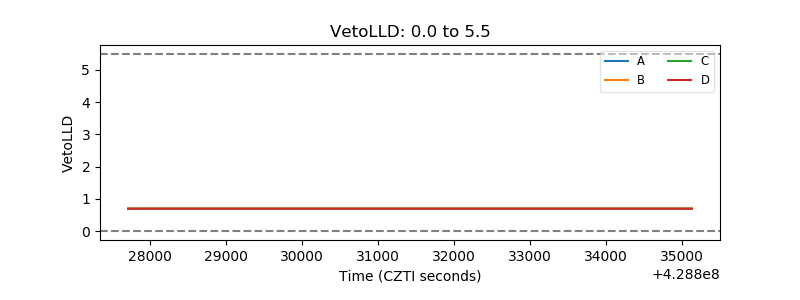 |
| Alpha Counter | 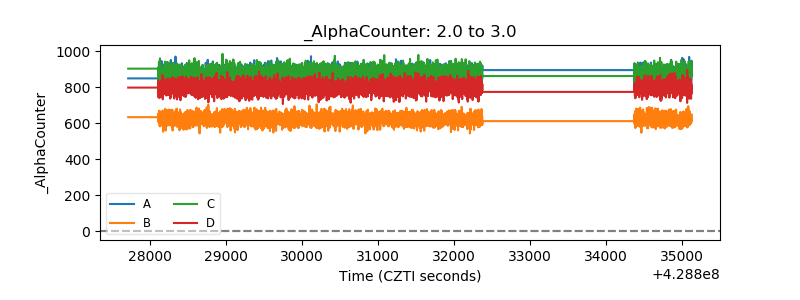 |
| _CPM_Rate | 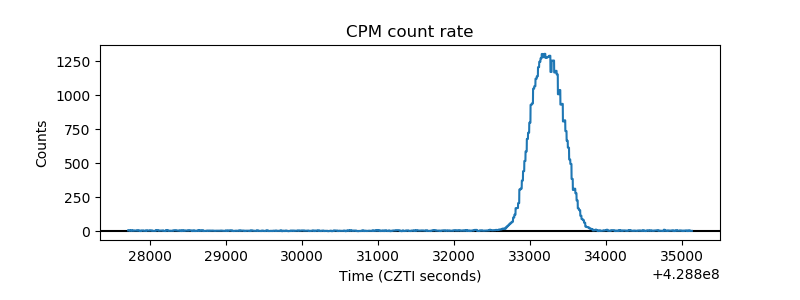 |
| CZT Counter | 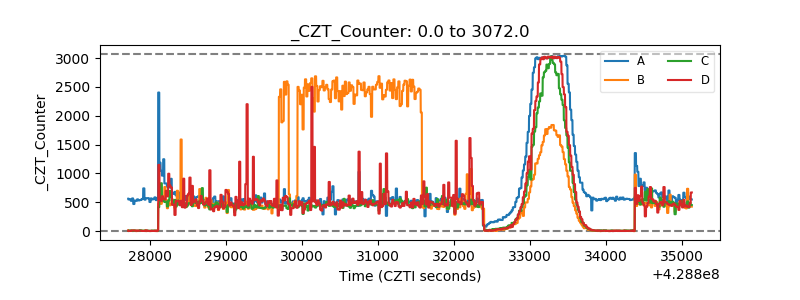 |
| +2.5 Volts monitor | 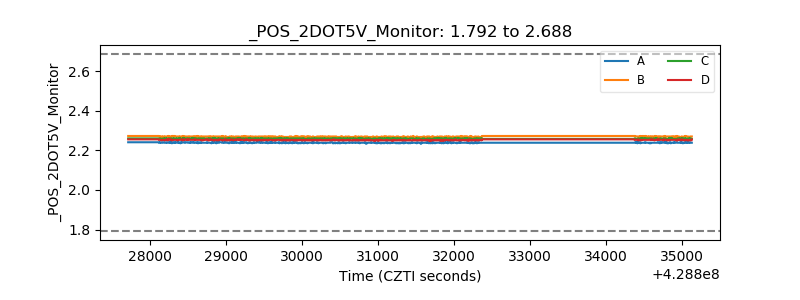 |
| +5 Volts monitor | 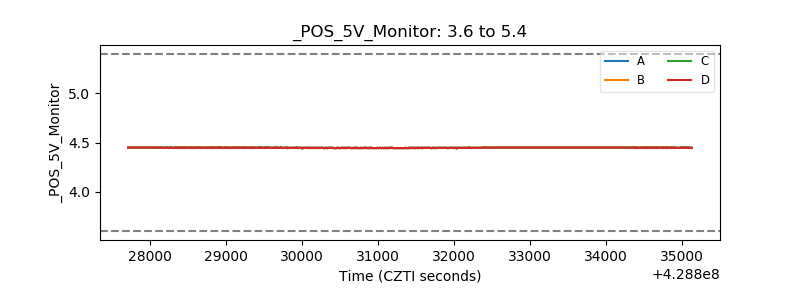 |
| _ROLL_ROT | 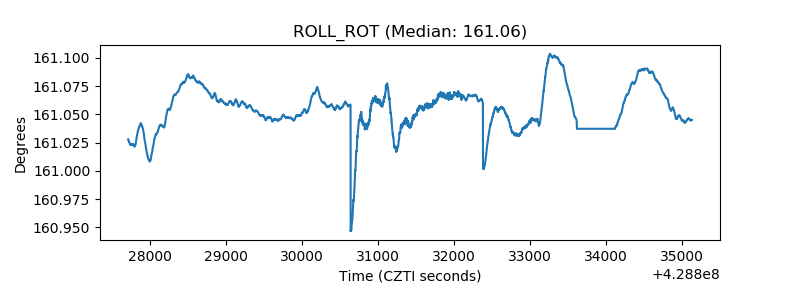 |
| _Roll_DEC | 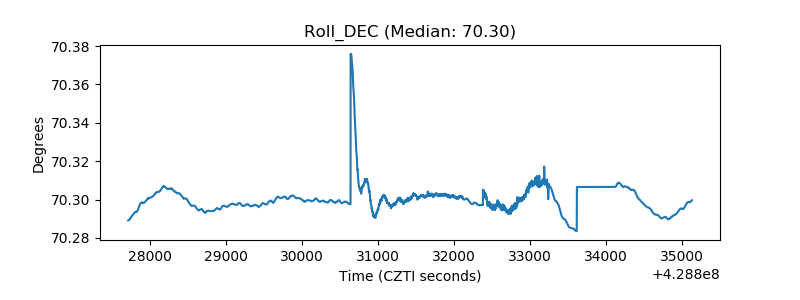 |
| _Roll_RA | 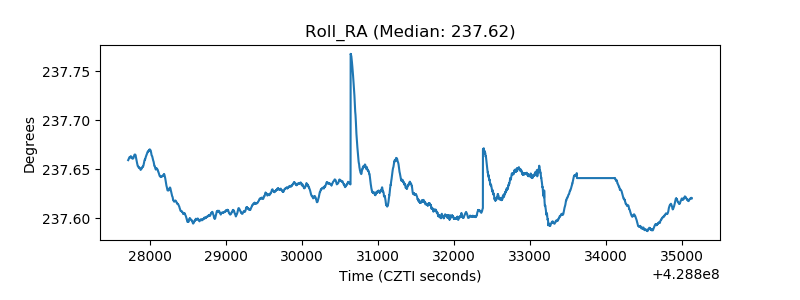 |
| Veto Counter | 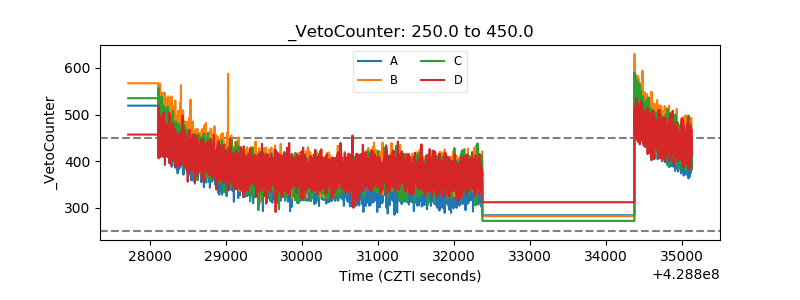 |