| Param | Original file | Final file |
|---|---|---|
| Filename | modeM0/AS1C07_001T10_9000005806_42445cztM0_level2.fits | modeM0/AS1C07_001T10_9000005806_42445cztM0_level2_quad_clean.evt |
| Size (bytes) | 416,496,960 | 80,789,760 |
| Size | 397.2 MB | 77.0 MB |
| Events in quadrant A | 2,903,695 | 614,811 |
| Events in quadrant B | 6,474,287 | 368,575 |
| Events in quadrant C | 2,434,270 | 580,277 |
| Events in quadrant D | 3,219,674 | 535,852 |
| Mode M9 | |||
|---|---|---|---|
| Quadrant | BADHDUFLAG | Total packets | Discarded packets |
| A | 0 | 22 | 0 |
| B | 0 | 23 | 0 |
| C | 0 | 23 | 0 |
| D | 0 | 23 | 0 |
| Mode SS | |||
|---|---|---|---|
| Quadrant | BADHDUFLAG | Total packets | Discarded packets |
| A | 0 | 102 | 0 |
| B | 0 | 102 | 0 |
| C | 0 | 102 | 0 |
| D | 0 | 102 | 0 |
| Mode M0 | |||
|---|---|---|---|
| Quadrant | BADHDUFLAG | Total packets | Discarded packets |
| A | 0 | 11500 | 2 |
| B | 0 | 22398 | 2 |
| C | 0 | 10233 | 2 |
| D | 0 | 12740 | 2 |
| Quadrant | Total seconds | Saturated seconds | Saturation percentage |
|---|---|---|---|
| A | 4943 | 17 | 0.343921% |
| B | 4943 | 2070 | 41.877402% |
| C | 4943 | 5 | 0.101153% |
| D | 4943 | 171 | 3.459438% |
Noise dominated data is calculated using 1-second bins in cleaned event files. If a bin has >2000 counts, and if more than 50% of those come from <1% of pixels, then it is considered to be noise-dominated and hence unusable.
| Quadrant | # 1 sec bins | Bins with >0 counts | Bins with >2000 counts | High rate bins dominated by noise | Noise dominated (total time) | Noise dominated (detector-on time) | Marked lightcurve |
|---|---|---|---|---|---|---|---|
| A | 7035 | 4944 | 14 | 14 | 0.20% | 0.28% | 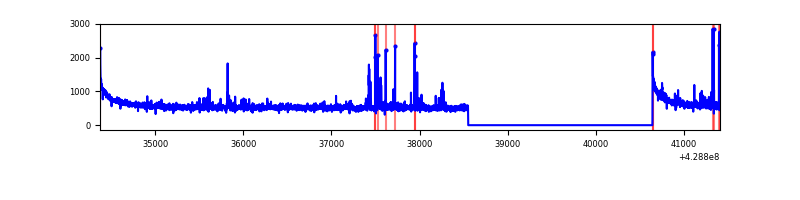 |
| B | 7035 | 4944 | 1870 | 1870 | 26.58% | 37.82% | 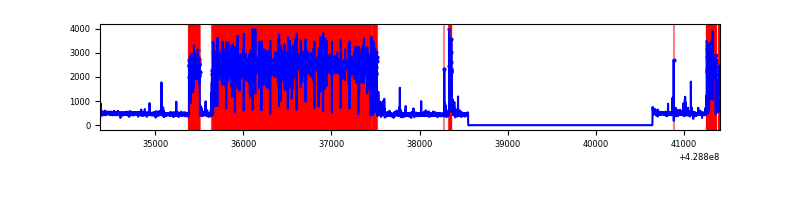 |
| C | 7035 | 4944 | 1 | 1 | 0.01% | 0.02% | 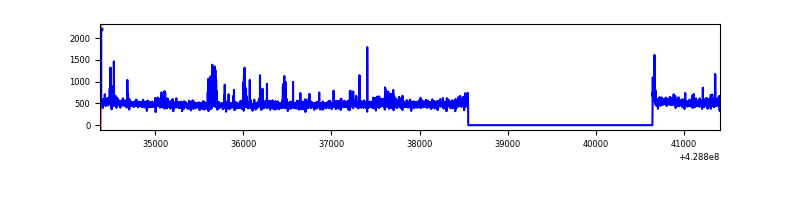 |
| D | 7035 | 4944 | 143 | 143 | 2.03% | 2.89% | 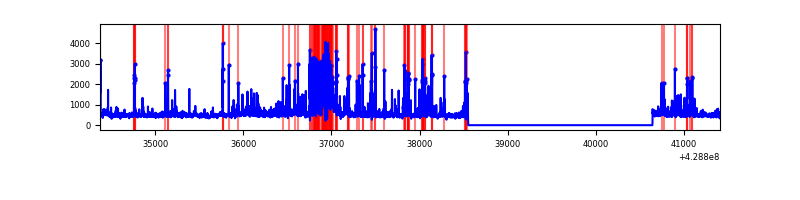 |
Top three noisy pixels from each quadrant. If the there are fewer than three noisy pixels in the level2.evt file, extra rows are filled as -1
| Pixel properties | Quadrant properties | ||||||
|---|---|---|---|---|---|---|---|
| Quadrant | DetID | PixID | Counts | Sigma | Mean | Median | Sigma |
| A | 10 | 83 | 575133 | 4971.12 | 567 | 557 | 115.6 |
| A | 15 | 223 | 79289 | 681.17 | 567 | 557 | 115.6 |
| A | 13 | 248 | 43697 | 373.24 | 567 | 557 | 115.6 |
| B | 0 | 186 | 4658157 | 59038.96 | 419 | 409 | 78.9 |
| B | 5 | 255 | 72671 | 915.95 | 419 | 409 | 78.9 |
| B | 5 | 172 | 39596 | 496.71 | 419 | 409 | 78.9 |
| C | 15 | 214 | 210279 | 1682.53 | 542 | 543 | 124.7 |
| C | 10 | 34 | 86115 | 686.47 | 542 | 543 | 124.7 |
| C | 14 | 254 | 9358 | 70.71 | 542 | 543 | 124.7 |
| D | 13 | 171 | 455449 | 3485.06 | 545 | 531 | 130.5 |
| D | 1 | 52 | 217533 | 1662.42 | 545 | 531 | 130.5 |
| D | 1 | 47 | 166702 | 1273.01 | 545 | 531 | 130.5 |
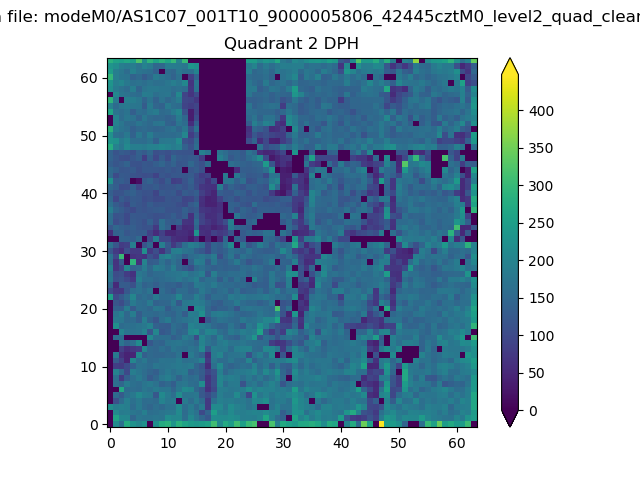
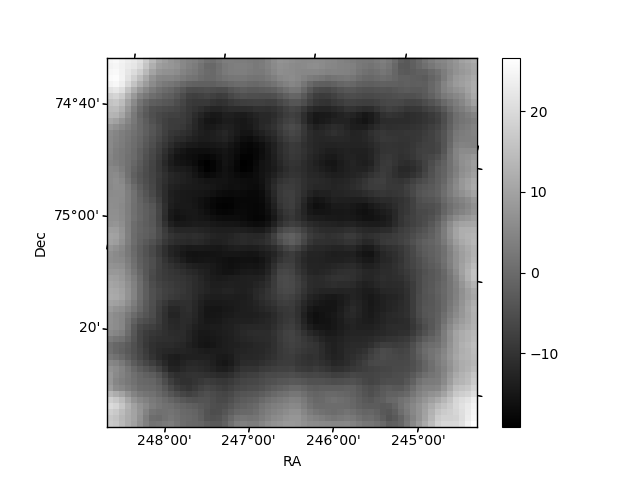
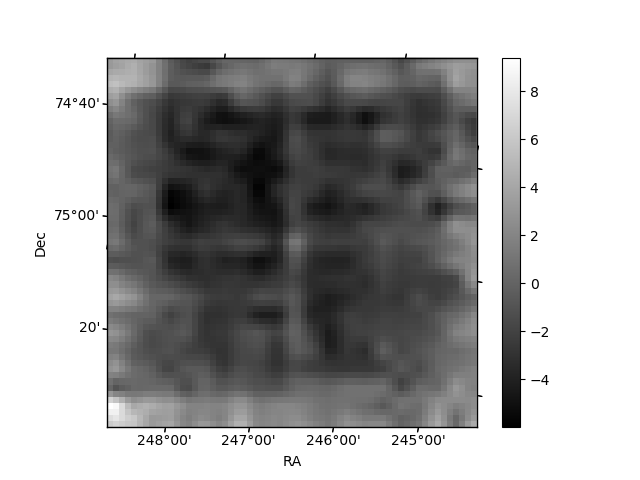
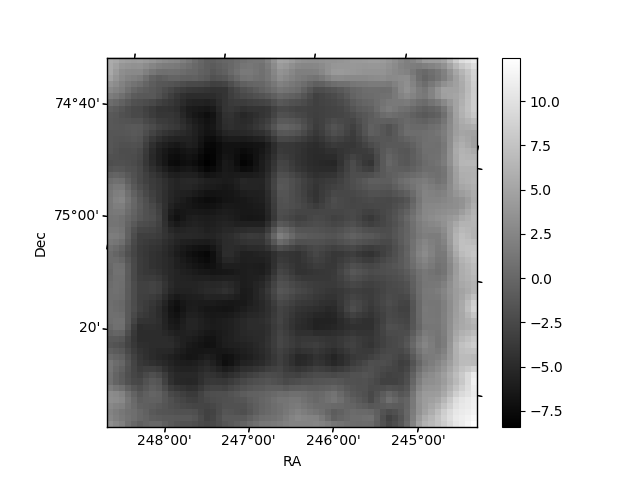
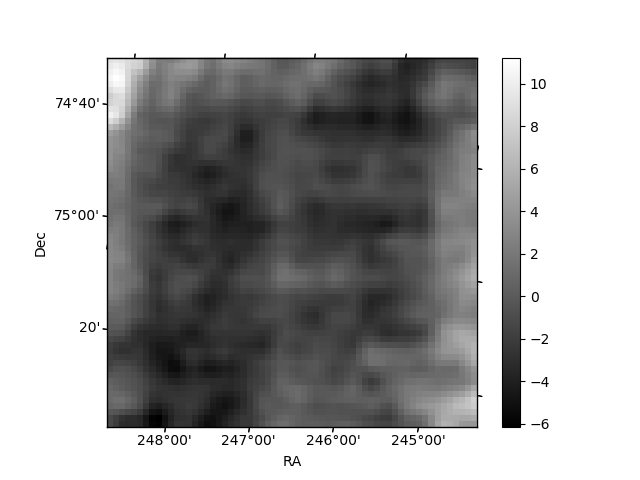
Histogram calculated using DETX and DETY for each event in the final _common_clean file
| Quadrant A | 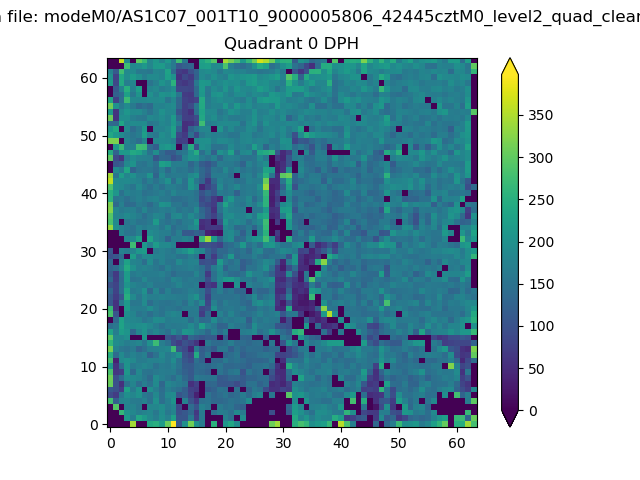 |
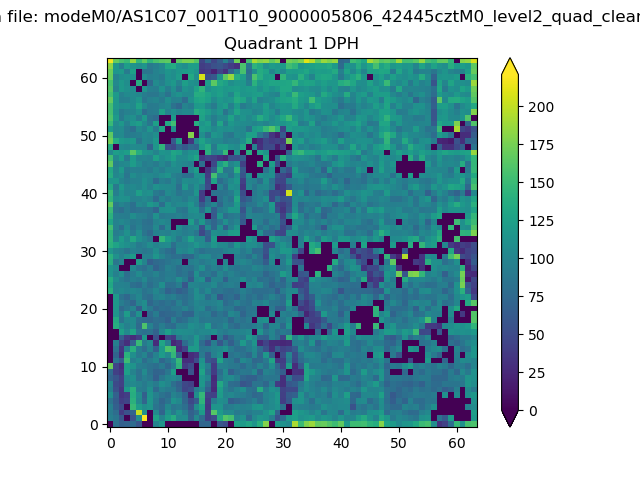 |
Quadrant B |
|---|---|---|---|
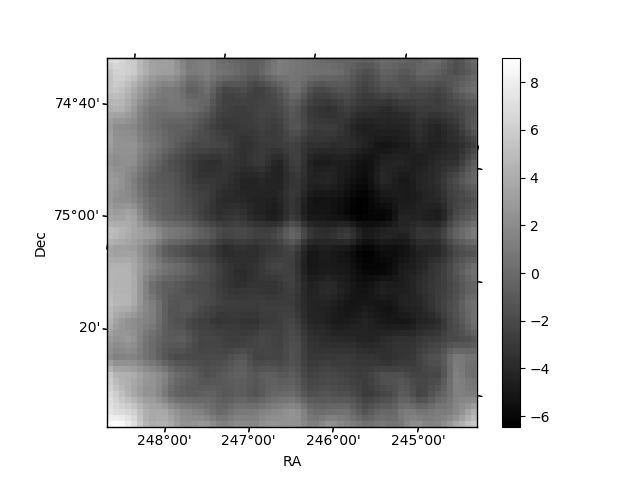
| Quadrant D | 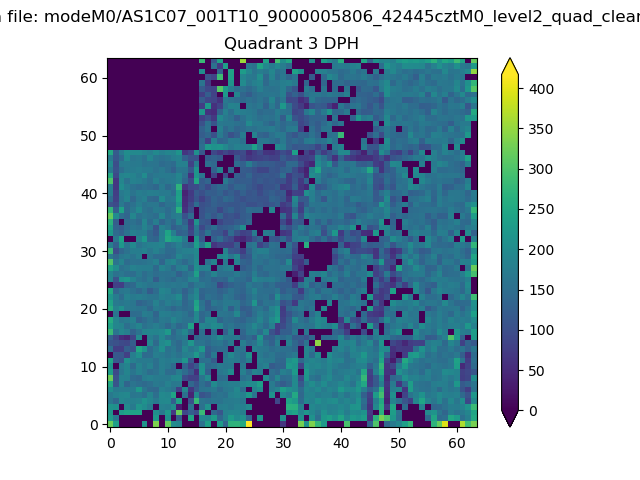 |
 |
Quadrant C |
| Plot type | Count rate plots | Images |
|---|---|---|
| Comparison with Poisson distribution Blue bars denote a histogram of data divided into 1 sec bins. Red curve is a Poisson curve with rate = median count rate of data. |
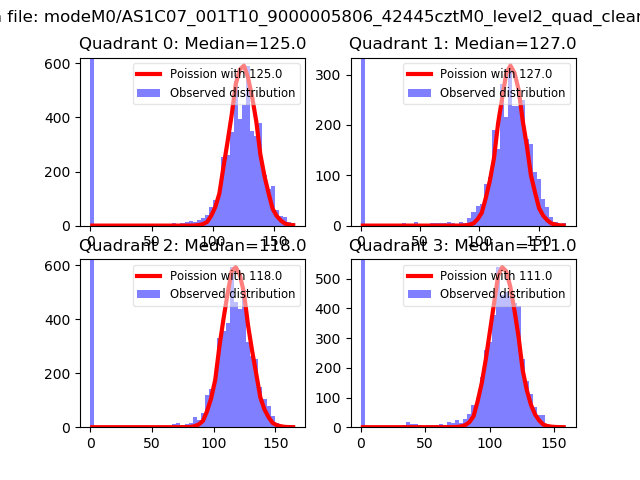 |
 |
| Quadrant-wise count rates Data is divided into 100 sec bins |
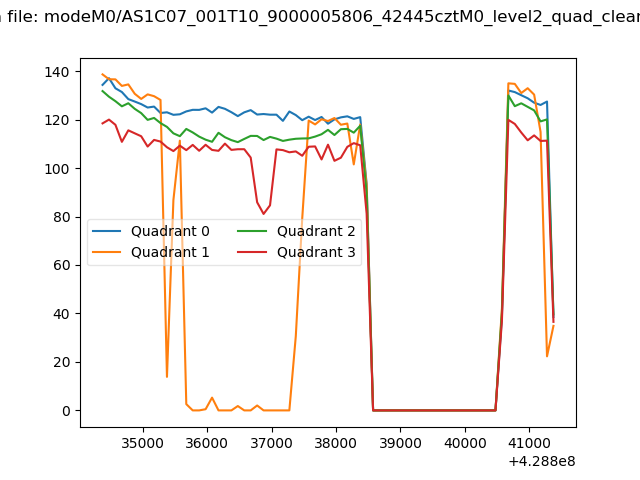 |
|
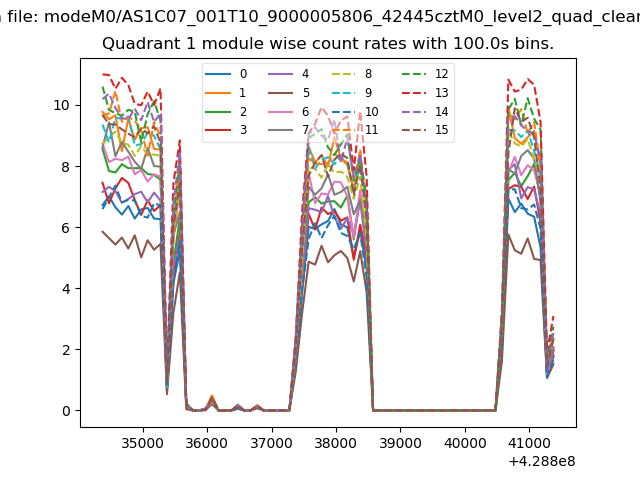
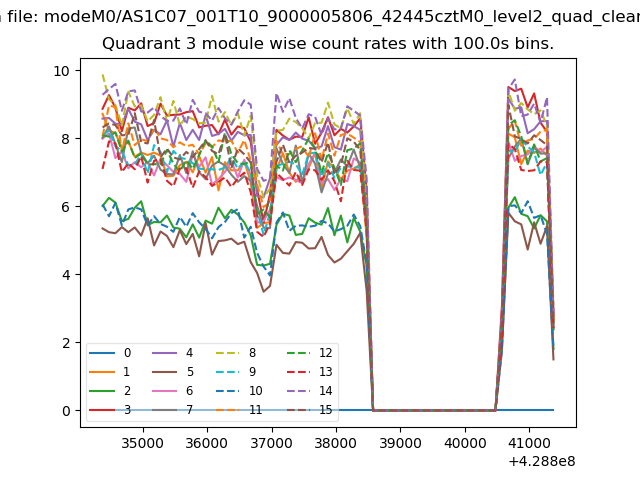
| Module-wise count rates for Quadrant A Data is divided into 100 sec bins |
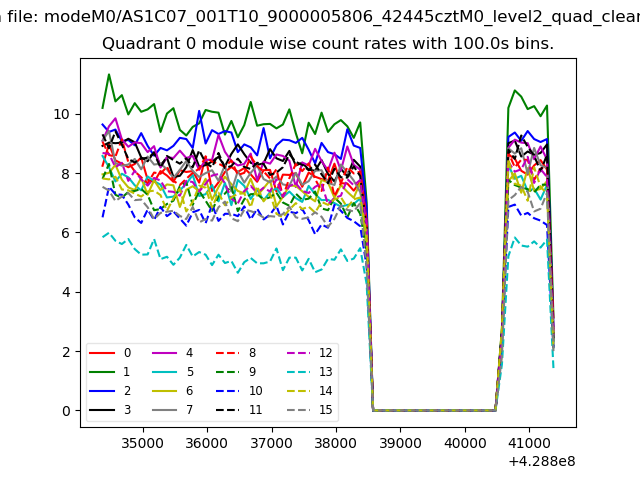 |
 |
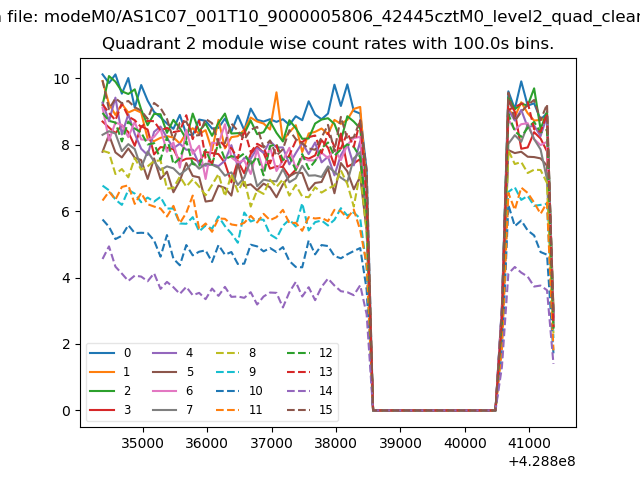
| Module-wise count rates for Quadrant B Data is divided into 100 sec bins |
 |
 |
| Module-wise count rates for Quadrant C Data is divided into 100 sec bins |
 |
 |
| Module-wise count rates for Quadrant D Data is divided into 100 sec bins |
 |
 |
| Parameter | Plot |
|---|---|
| CZT HV Monitor |  |
| D_VDD | 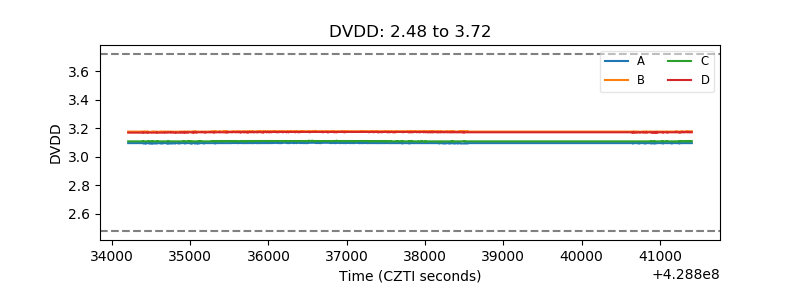 |
| Temperature 1 | 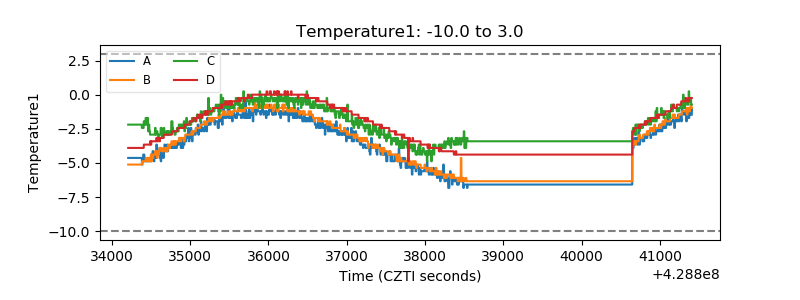 |
| Veto HV Monitor | 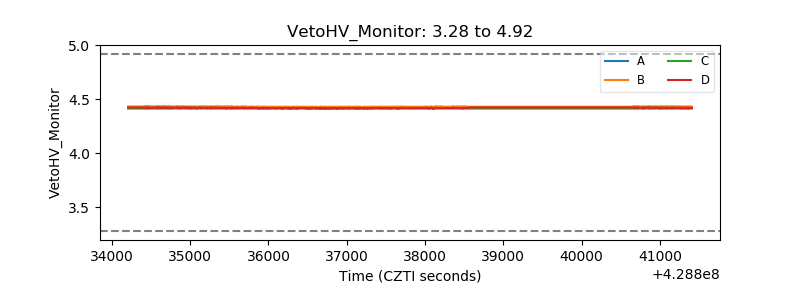 |
| Veto LLD | 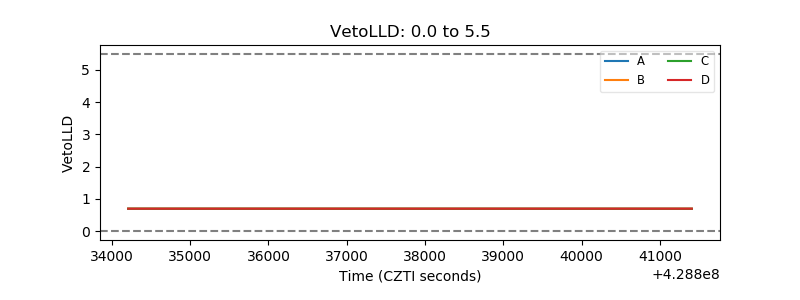 |
| Alpha Counter | 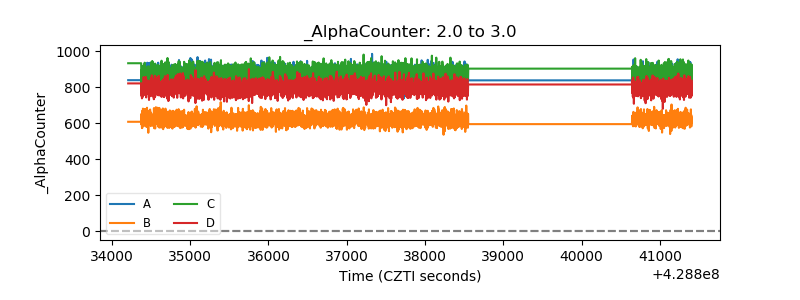 |
| _CPM_Rate | 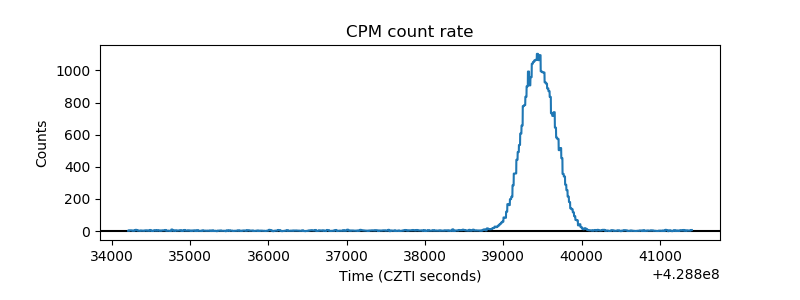 |
| CZT Counter | 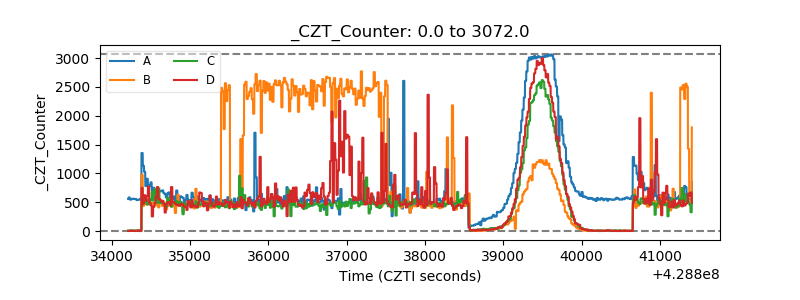 |
| +2.5 Volts monitor | 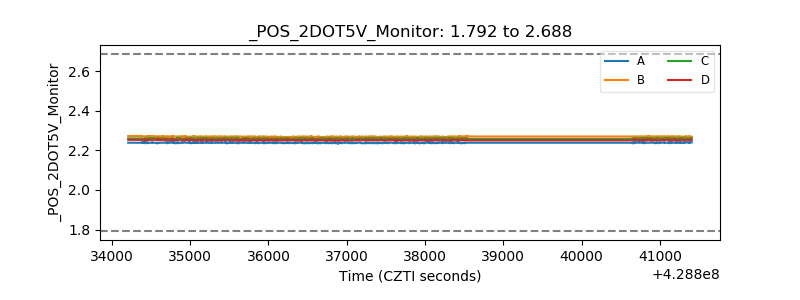 |
| +5 Volts monitor | 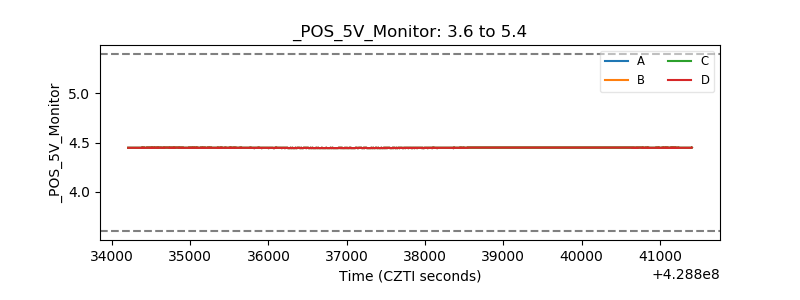 |
| _ROLL_ROT | 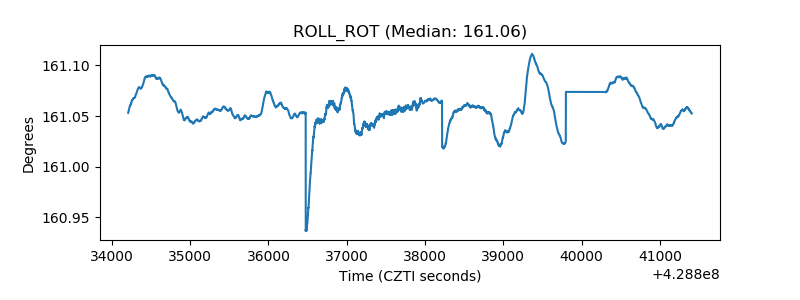 |
| _Roll_DEC |  |
| _Roll_RA | 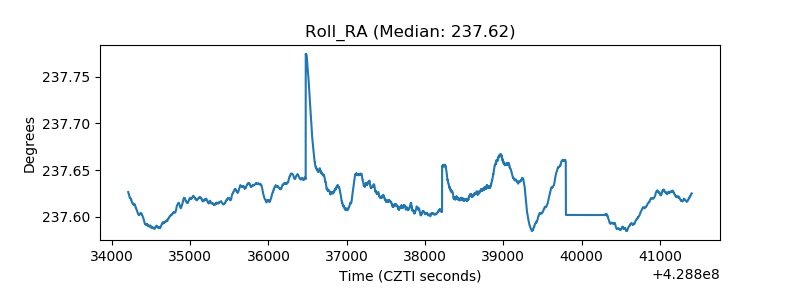 |
| Veto Counter | 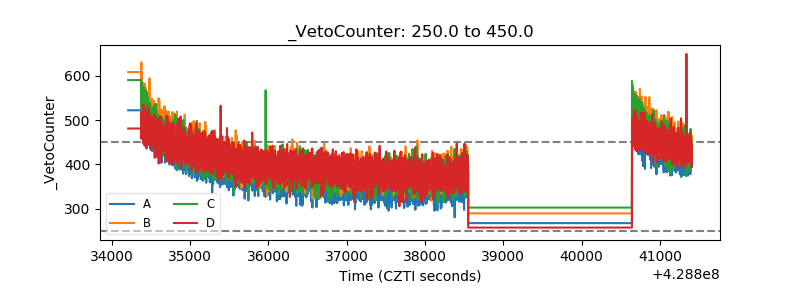 |