| Param | Original file | Final file |
|---|---|---|
| Filename | modeM0/AS1C07_001T10_9000005806_42446cztM0_level2.fits | modeM0/AS1C07_001T10_9000005806_42446cztM0_level2_quad_clean.evt |
| Size (bytes) | 503,516,160 | 80,956,800 |
| Size | 480.2 MB | 77.2 MB |
| Events in quadrant A | 3,081,022 | 638,566 |
| Events in quadrant B | 7,980,468 | 306,762 |
| Events in quadrant C | 2,693,100 | 603,963 |
| Events in quadrant D | 4,477,733 | 536,543 |
| Mode M9 | |||
|---|---|---|---|
| Quadrant | BADHDUFLAG | Total packets | Discarded packets |
| A | 0 | 24 | 0 |
| B | 0 | 25 | 0 |
| C | 0 | 25 | 0 |
| D | 0 | 25 | 0 |
| Mode SS | |||
|---|---|---|---|
| Quadrant | BADHDUFLAG | Total packets | Discarded packets |
| A | 0 | 106 | 0 |
| B | 0 | 106 | 0 |
| C | 0 | 106 | 0 |
| D | 0 | 106 | 0 |
| Mode M0 | |||
|---|---|---|---|
| Quadrant | BADHDUFLAG | Total packets | Discarded packets |
| A | 0 | 12194 | 2 |
| B | 0 | 27141 | 2 |
| C | 0 | 11136 | 2 |
| D | 0 | 16772 | 2 |
| Quadrant | Total seconds | Saturated seconds | Saturation percentage |
|---|---|---|---|
| A | 5220 | 33 | 0.632184% |
| B | 5219 | 2770 | 53.075302% |
| C | 5219 | 5 | 0.095804% |
| D | 5219 | 437 | 8.373252% |
Noise dominated data is calculated using 1-second bins in cleaned event files. If a bin has >2000 counts, and if more than 50% of those come from <1% of pixels, then it is considered to be noise-dominated and hence unusable.
| Quadrant | # 1 sec bins | Bins with >0 counts | Bins with >2000 counts | High rate bins dominated by noise | Noise dominated (total time) | Noise dominated (detector-on time) | Marked lightcurve |
|---|---|---|---|---|---|---|---|
| A | 7343 | 5221 | 20 | 20 | 0.27% | 0.38% | 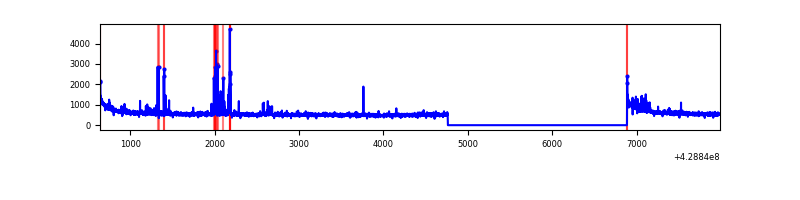 |
| B | 7341 | 5219 | 2485 | 2485 | 33.85% | 47.61% | 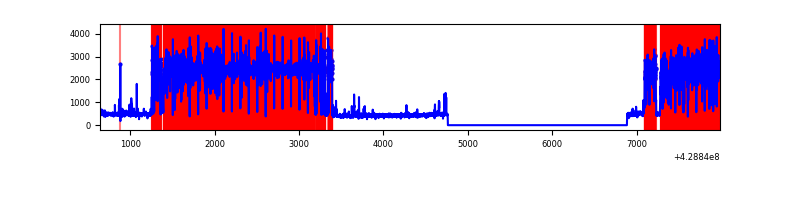 |
| C | 7342 | 5220 | 2 | 2 | 0.03% | 0.04% | 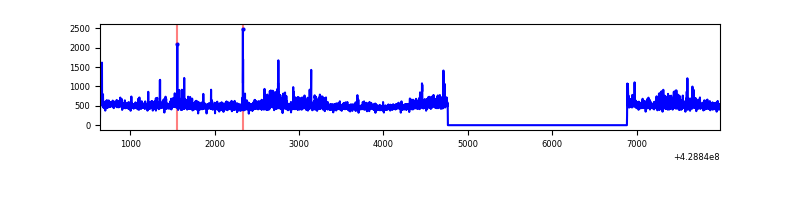 |
| D | 7342 | 5220 | 383 | 383 | 5.22% | 7.34% | 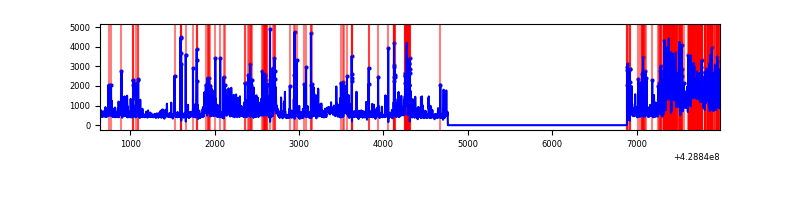 |
Top three noisy pixels from each quadrant. If the there are fewer than three noisy pixels in the level2.evt file, extra rows are filled as -1
| Pixel properties | Quadrant properties | ||||||
|---|---|---|---|---|---|---|---|
| Quadrant | DetID | PixID | Counts | Sigma | Mean | Median | Sigma |
| A | 10 | 83 | 613302 | 5135.46 | 589 | 579 | 119.3 |
| A | 14 | 223 | 78033 | 649.17 | 589 | 579 | 119.3 |
| A | 13 | 248 | 57452 | 476.67 | 589 | 579 | 119.3 |
| B | 0 | 186 | 6198554 | 81106.18 | 398 | 388 | 76.4 |
| B | 3 | 112 | 61347 | 797.68 | 398 | 388 | 76.4 |
| B | 5 | 255 | 59648 | 775.45 | 398 | 388 | 76.4 |
| C | 15 | 214 | 223108 | 1715.86 | 565 | 570 | 129.7 |
| C | 10 | 34 | 193762 | 1489.59 | 565 | 570 | 129.7 |
| C | 5 | 250 | 51173 | 390.17 | 565 | 570 | 129.7 |
| D | 1 | 52 | 1423950 | 10498.97 | 559 | 544 | 135.6 |
| D | 13 | 171 | 334353 | 2462.16 | 559 | 544 | 135.6 |
| D | 1 | 47 | 111924 | 821.53 | 559 | 544 | 135.6 |
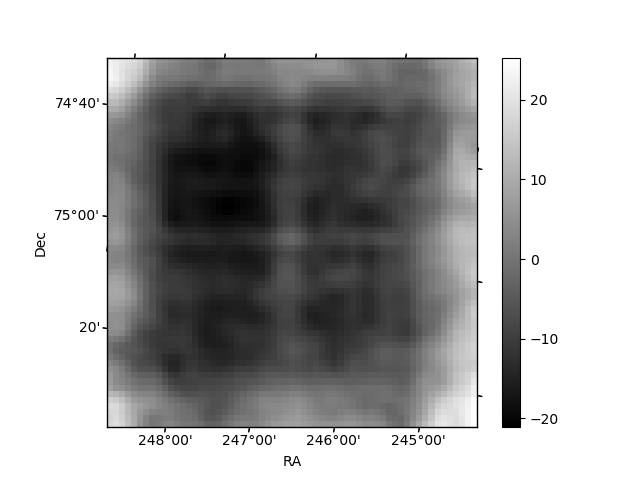
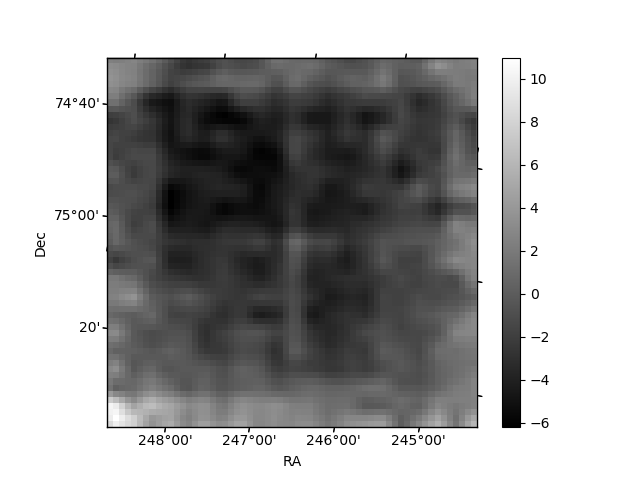
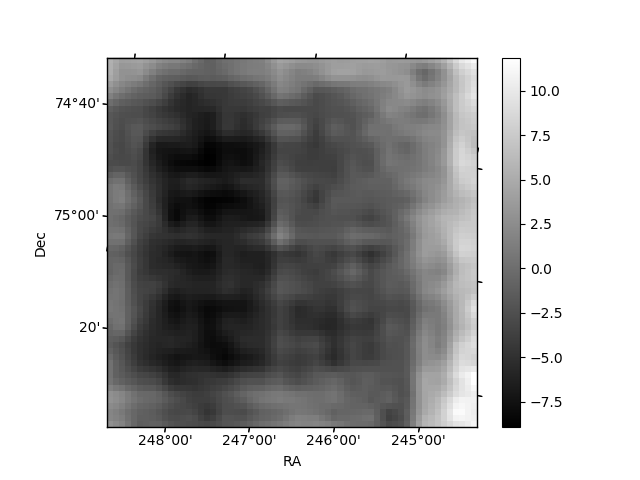
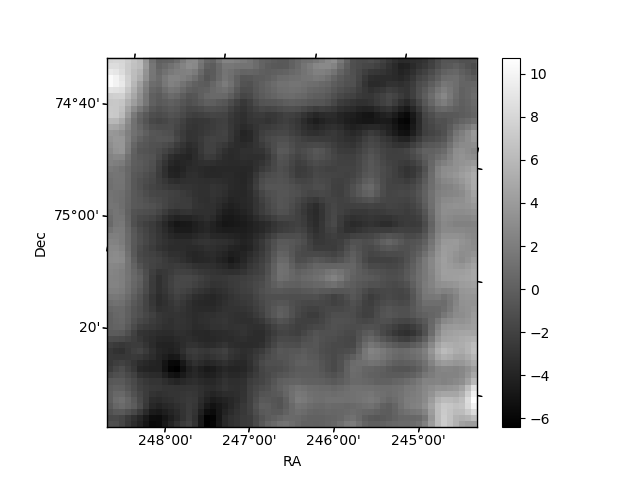
Histogram calculated using DETX and DETY for each event in the final _common_clean file
| Quadrant A | 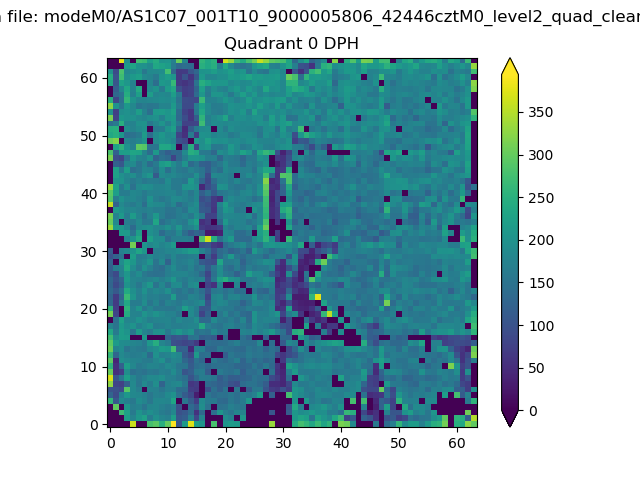 |
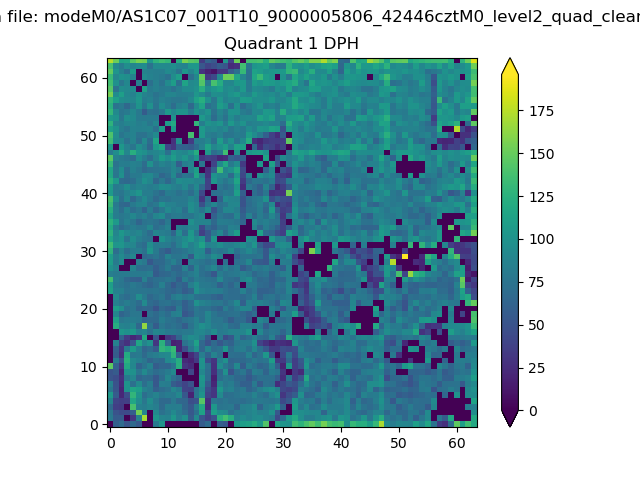 |
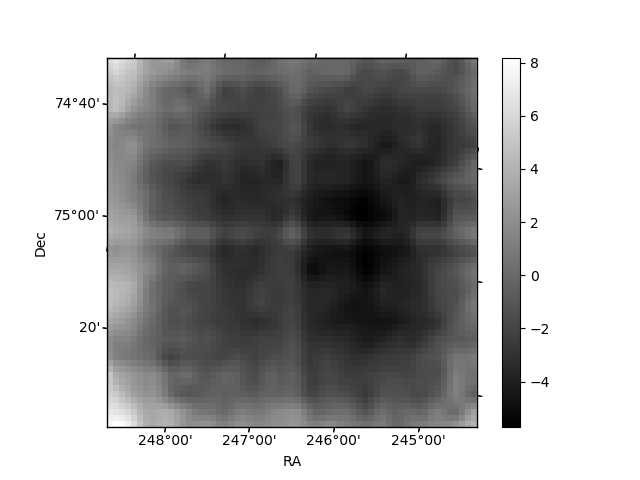
Quadrant B |
|---|---|---|---|
| Quadrant D | 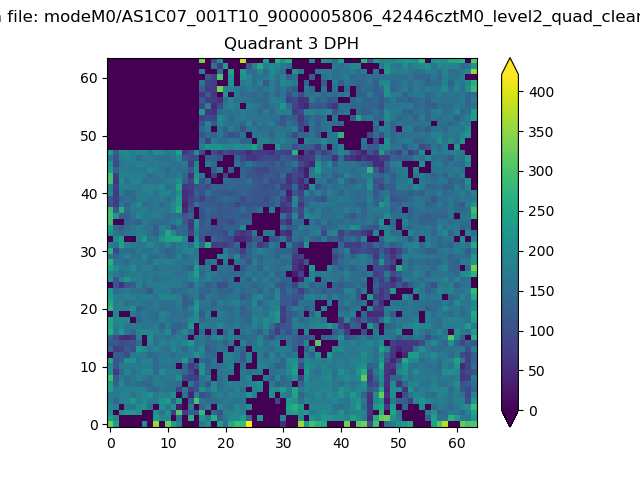 |
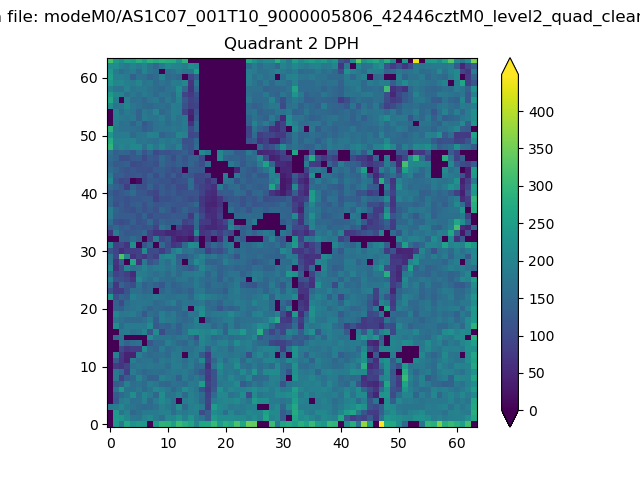 |
Quadrant C |
| Plot type | Count rate plots | Images |
|---|---|---|
| Comparison with Poisson distribution Blue bars denote a histogram of data divided into 1 sec bins. Red curve is a Poisson curve with rate = median count rate of data. |
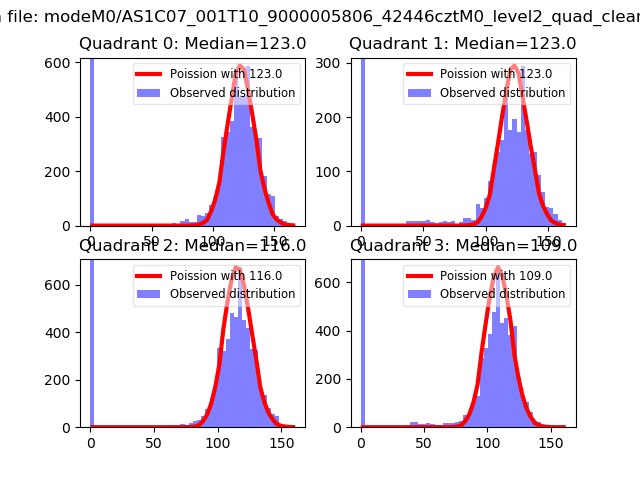 |
 |
| Quadrant-wise count rates Data is divided into 100 sec bins |
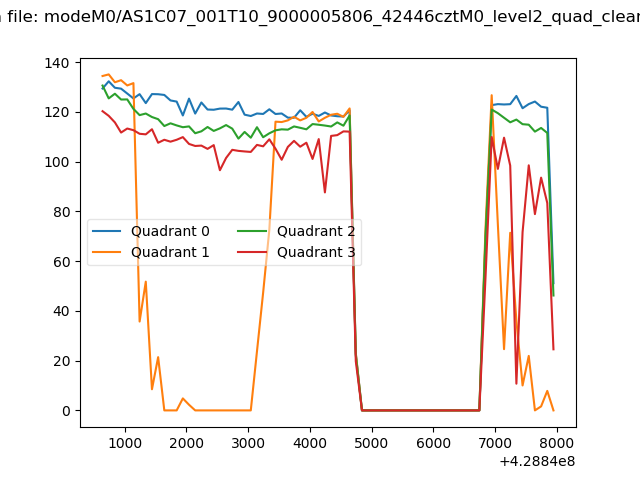 |
|
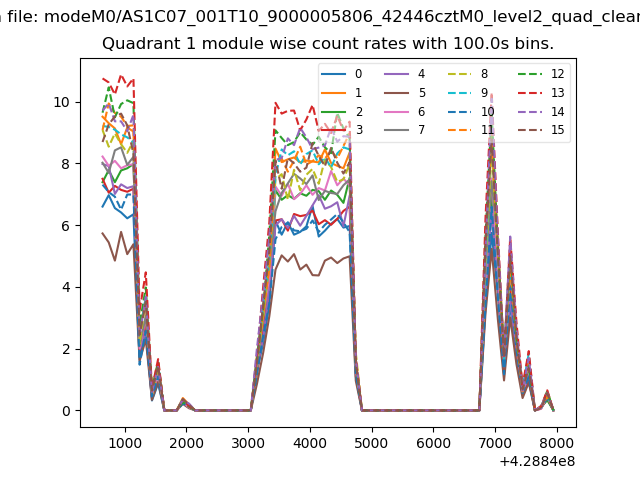
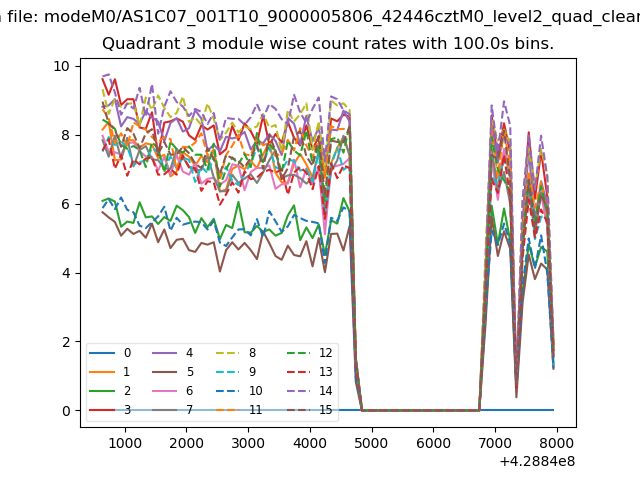
| Module-wise count rates for Quadrant A Data is divided into 100 sec bins |
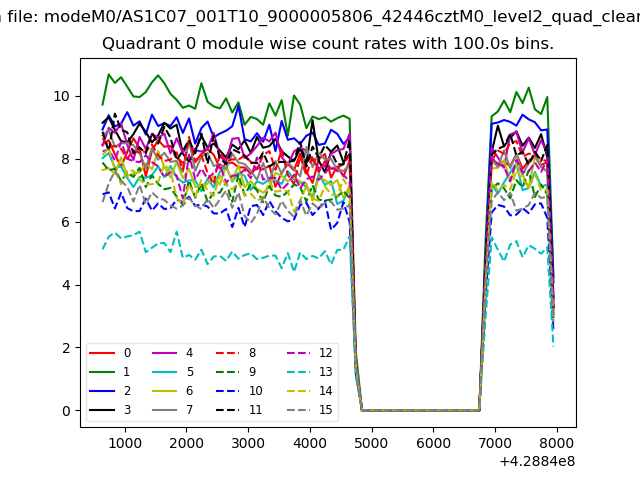 |
 |
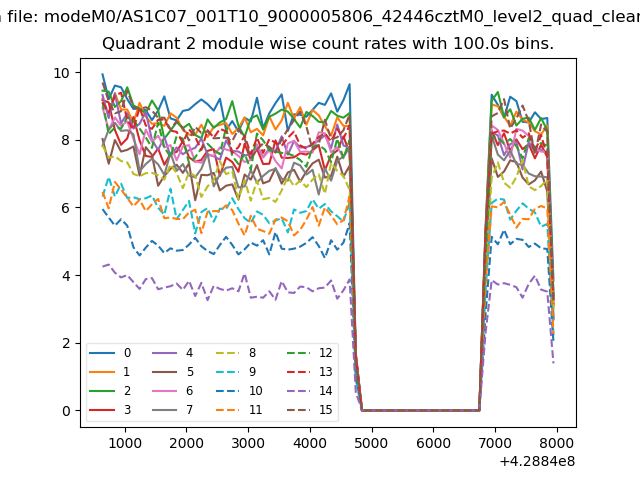
| Module-wise count rates for Quadrant B Data is divided into 100 sec bins |
 |
 |
| Module-wise count rates for Quadrant C Data is divided into 100 sec bins |
 |
 |
| Module-wise count rates for Quadrant D Data is divided into 100 sec bins |
 |
 |
| Parameter | Plot |
|---|---|
| CZT HV Monitor | 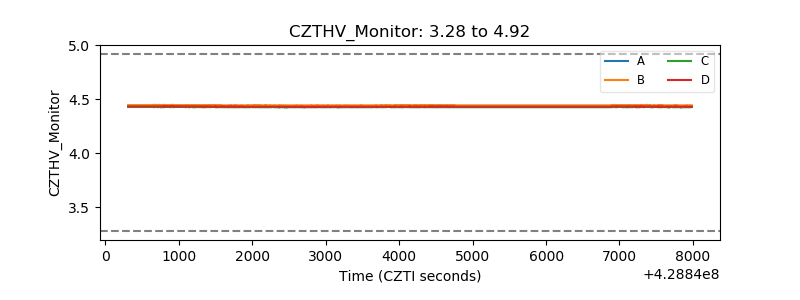 |
| D_VDD | 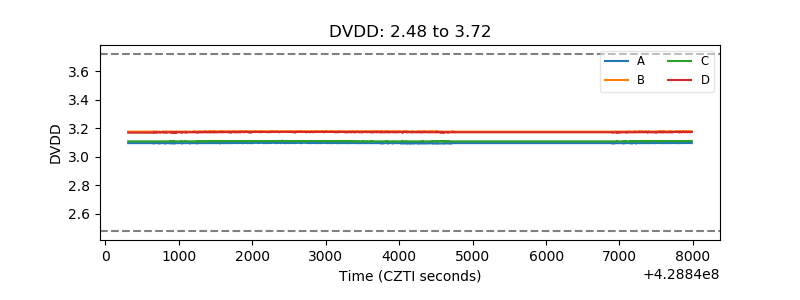 |
| Temperature 1 | 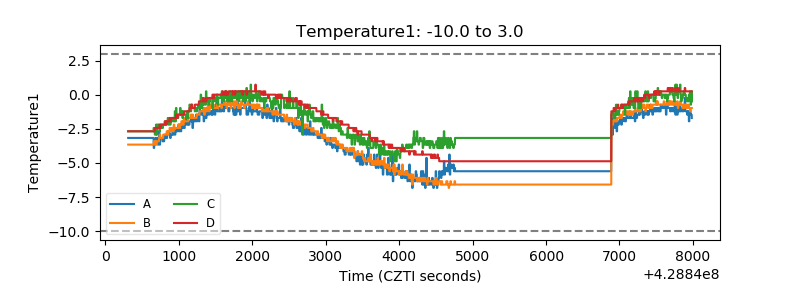 |
| Veto HV Monitor | 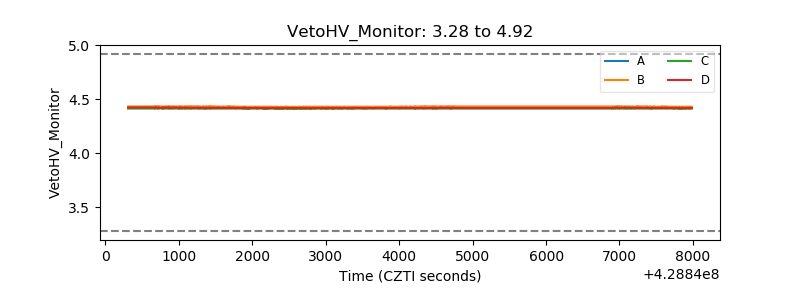 |
| Veto LLD | 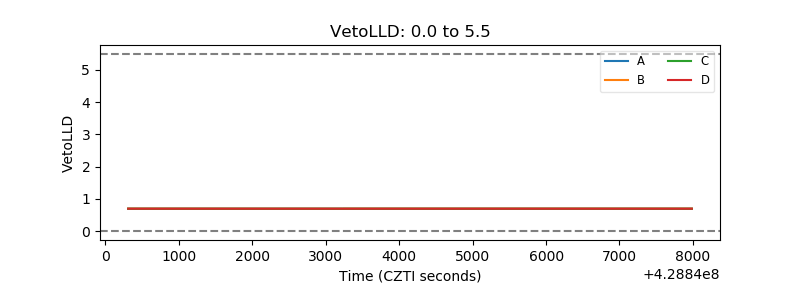 |
| Alpha Counter | 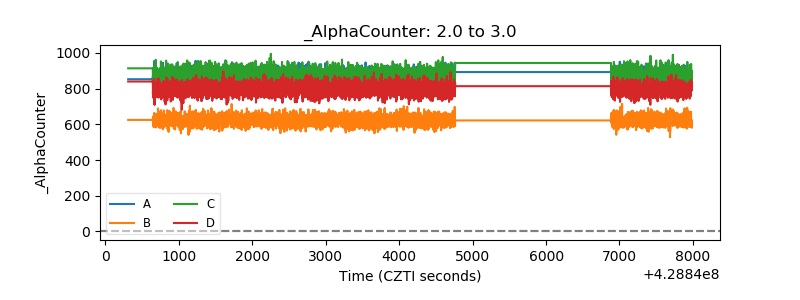 |
| _CPM_Rate | 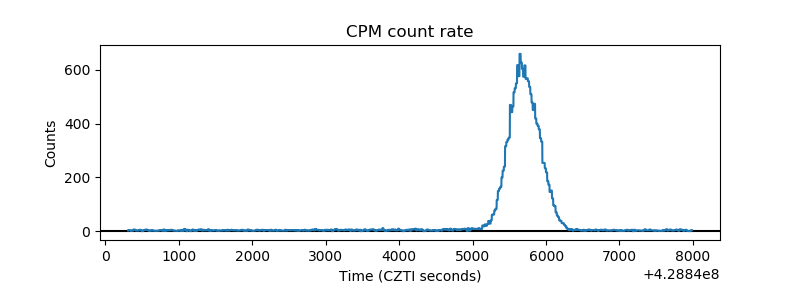 |
| CZT Counter | 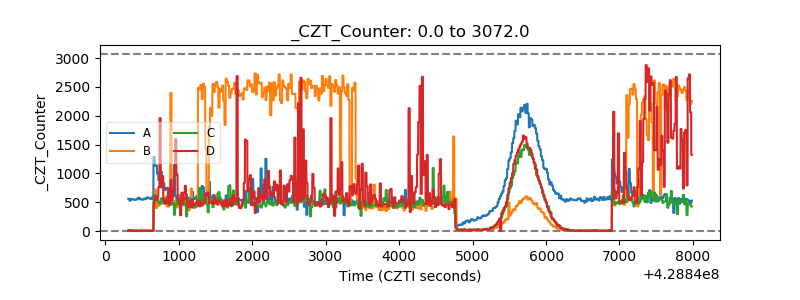 |
| +2.5 Volts monitor | 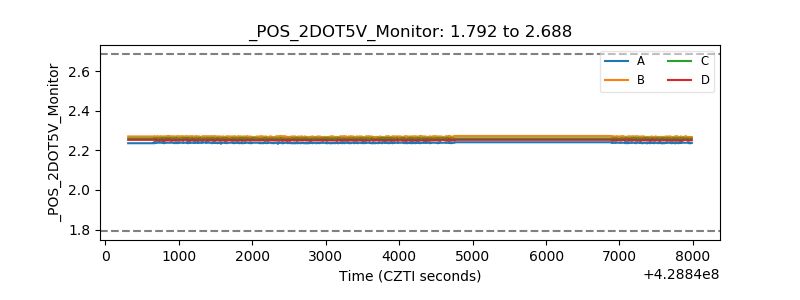 |
| +5 Volts monitor | 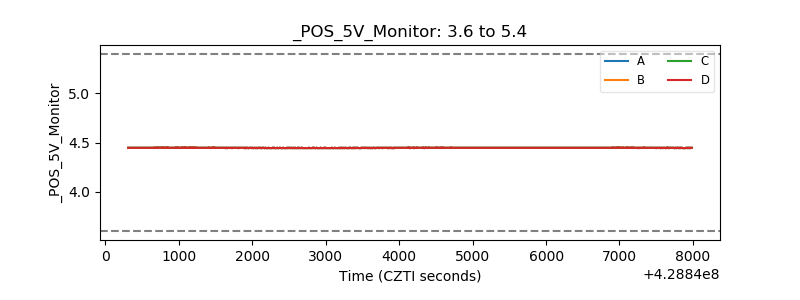 |
| _ROLL_ROT | 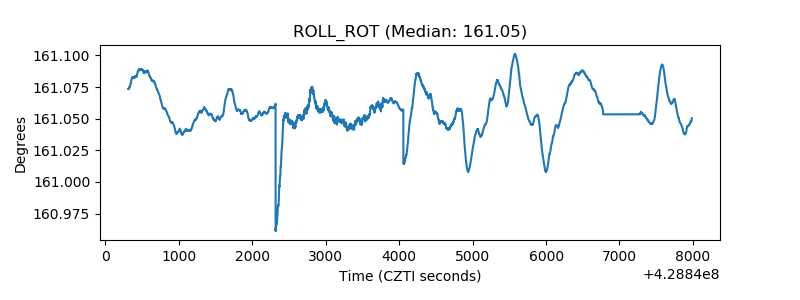 |
| _Roll_DEC | 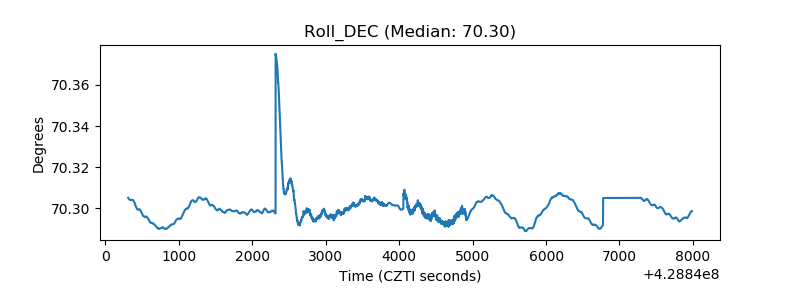 |
| _Roll_RA | 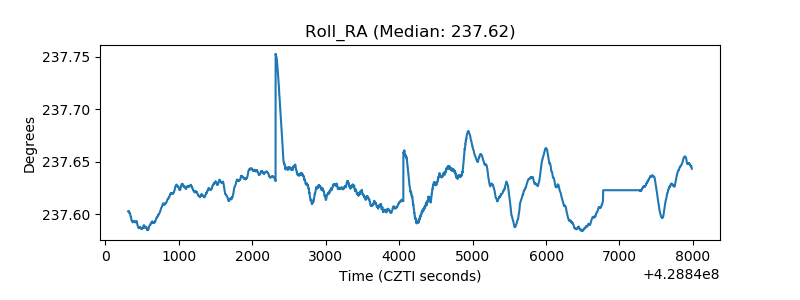 |
| Veto Counter | 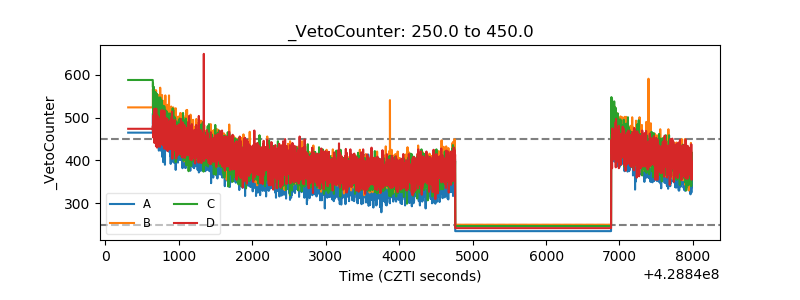 |