| Param | Original file | Final file |
|---|---|---|
| Filename | modeM0/AS1C07_001T10_9000005806_42447cztM0_level2.fits | modeM0/AS1C07_001T10_9000005806_42447cztM0_level2_quad_clean.evt |
| Size (bytes) | 477,086,400 | 71,429,760 |
| Size | 455.0 MB | 68.1 MB |
| Events in quadrant A | 2,735,980 | 565,828 |
| Events in quadrant B | 7,460,709 | 258,581 |
| Events in quadrant C | 2,425,885 | 532,229 |
| Events in quadrant D | 4,661,461 | 467,311 |
| Mode M9 | |||
|---|---|---|---|
| Quadrant | BADHDUFLAG | Total packets | Discarded packets |
| A | 0 | 21 | 0 |
| B | 0 | 21 | 0 |
| C | 0 | 21 | 0 |
| D | 0 | 21 | 0 |
| Mode SS | |||
|---|---|---|---|
| Quadrant | BADHDUFLAG | Total packets | Discarded packets |
| A | 0 | 98 | 0 |
| B | 0 | 98 | 0 |
| C | 0 | 98 | 0 |
| D | 0 | 98 | 0 |
| Mode M0 | |||
|---|---|---|---|
| Quadrant | BADHDUFLAG | Total packets | Discarded packets |
| A | 0 | 10997 | 2 |
| B | 0 | 25547 | 1 |
| C | 0 | 10251 | 1 |
| D | 0 | 17164 | 1 |
| Quadrant | Total seconds | Saturated seconds | Saturation percentage |
|---|---|---|---|
| A | 4827 | 45 | 0.932256% |
| B | 4828 | 2641 | 54.701740% |
| C | 4828 | 5 | 0.103563% |
| D | 4828 | 531 | 10.998343% |
Noise dominated data is calculated using 1-second bins in cleaned event files. If a bin has >2000 counts, and if more than 50% of those come from <1% of pixels, then it is considered to be noise-dominated and hence unusable.
| Quadrant | # 1 sec bins | Bins with >0 counts | Bins with >2000 counts | High rate bins dominated by noise | Noise dominated (total time) | Noise dominated (detector-on time) | Marked lightcurve |
|---|---|---|---|---|---|---|---|
| A | 6920 | 4828 | 27 | 27 | 0.39% | 0.56% | 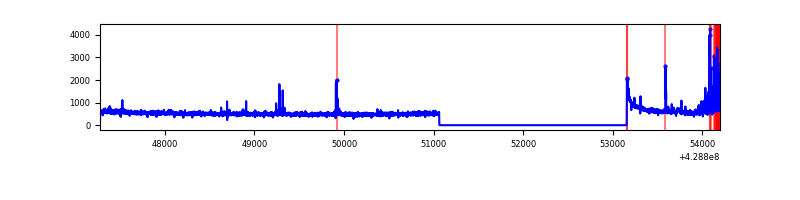 |
| B | 6921 | 4829 | 2223 | 2223 | 32.12% | 46.03% | 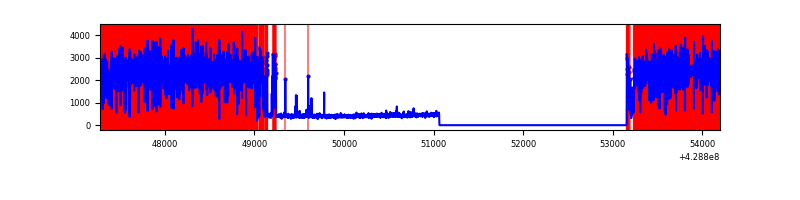 |
| C | 6921 | 4829 | 2 | 2 | 0.03% | 0.04% | 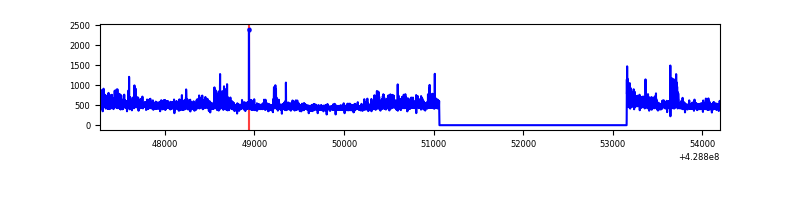 |
| D | 6921 | 4829 | 479 | 479 | 6.92% | 9.92% | 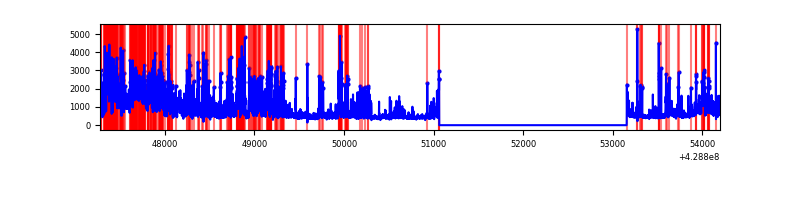 |
Top three noisy pixels from each quadrant. If the there are fewer than three noisy pixels in the level2.evt file, extra rows are filled as -1
| Pixel properties | Quadrant properties | ||||||
|---|---|---|---|---|---|---|---|
| Quadrant | DetID | PixID | Counts | Sigma | Mean | Median | Sigma |
| A | 10 | 83 | 507038 | 4811.37 | 520 | 510 | 105.3 |
| A | 14 | 223 | 145396 | 1376.23 | 520 | 510 | 105.3 |
| A | 13 | 248 | 23342 | 216.87 | 520 | 510 | 105.3 |
| B | 0 | 186 | 5760311 | 82144.66 | 367 | 357 | 70.1 |
| B | 3 | 112 | 92100 | 1308.38 | 367 | 357 | 70.1 |
| B | 5 | 255 | 83242 | 1182.05 | 367 | 357 | 70.1 |
| C | 15 | 214 | 200855 | 1687.34 | 508 | 511 | 118.7 |
| C | 10 | 34 | 191780 | 1610.91 | 508 | 511 | 118.7 |
| C | 15 | 111 | 23030 | 189.66 | 508 | 511 | 118.7 |
| D | 1 | 52 | 1700138 | 14143.65 | 494 | 481 | 120.2 |
| D | 13 | 171 | 315525 | 2621.63 | 494 | 481 | 120.2 |
| D | 2 | 249 | 207718 | 1724.52 | 494 | 481 | 120.2 |
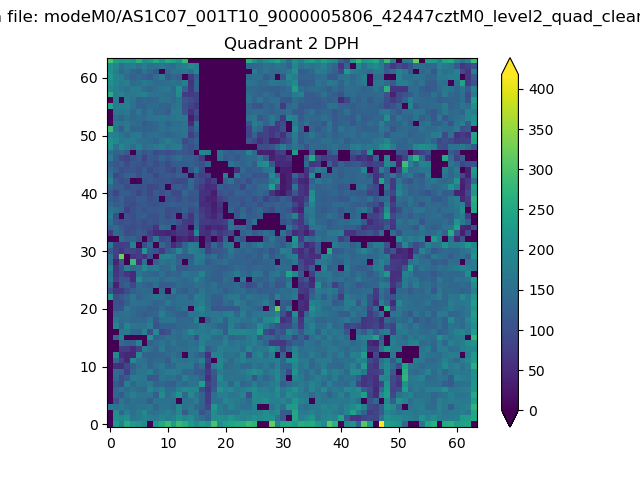
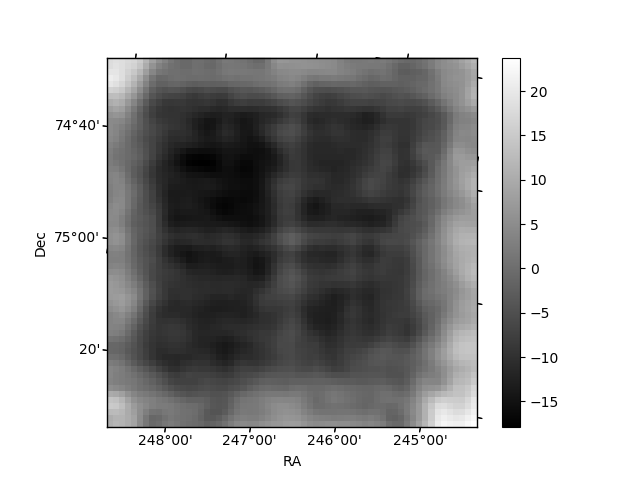
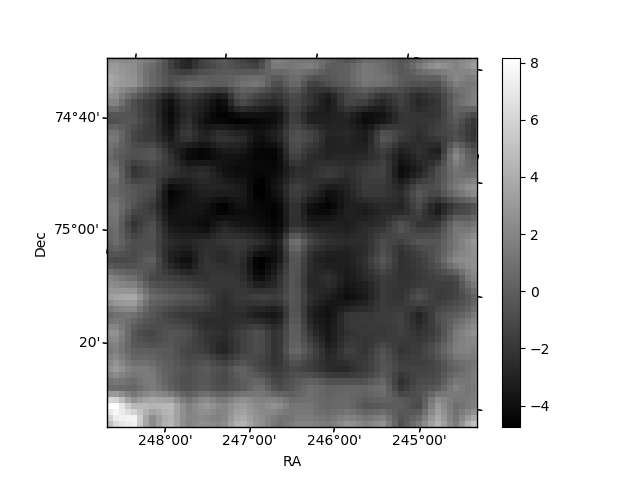
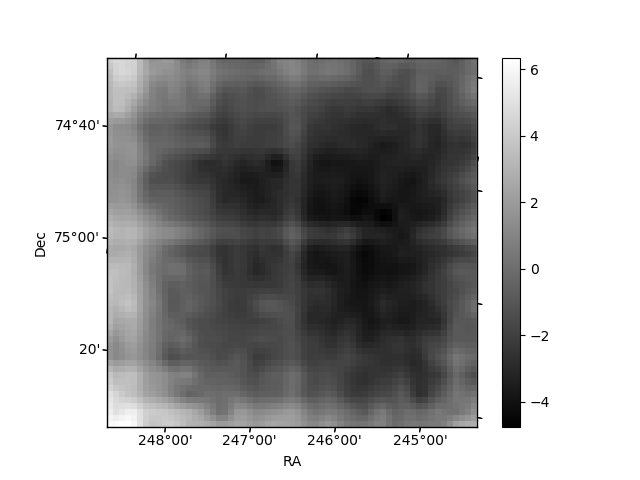
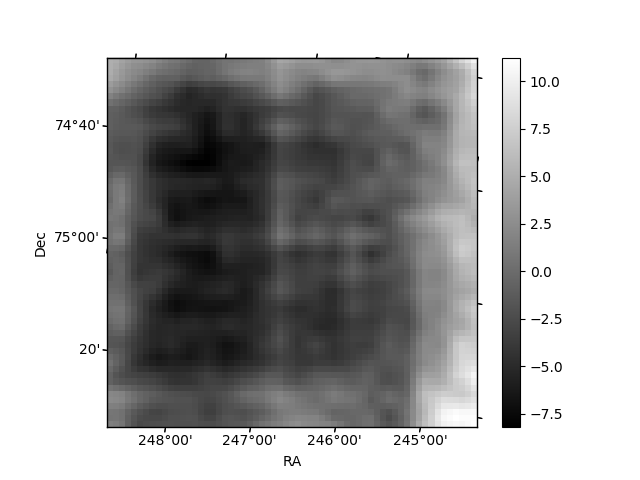
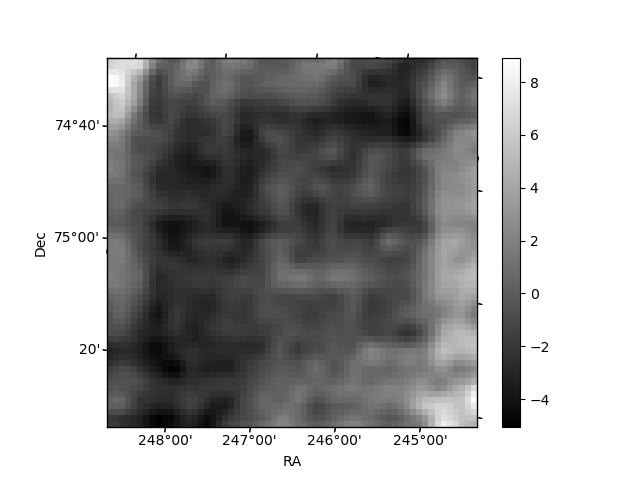
Histogram calculated using DETX and DETY for each event in the final _common_clean file
| Quadrant A | 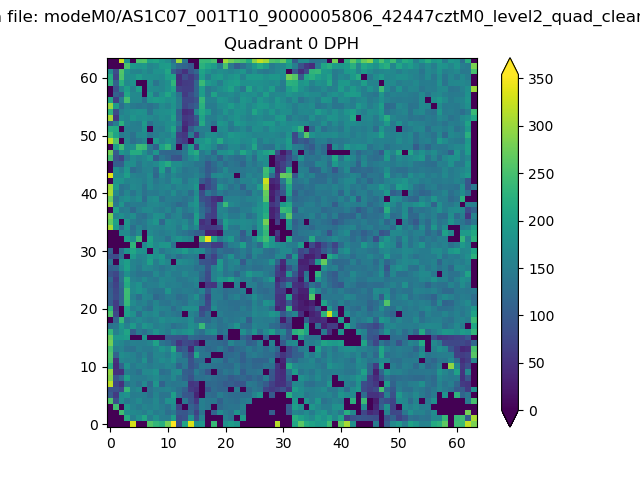 |
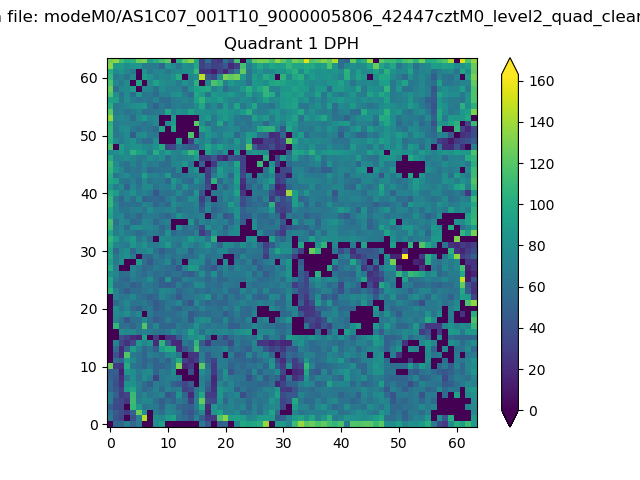 |
Quadrant B |
|---|---|---|---|
| Quadrant D | 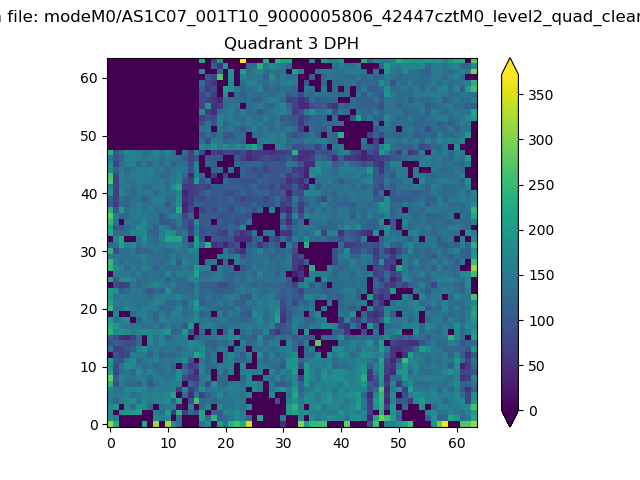 |
 |
Quadrant C |
| Plot type | Count rate plots | Images |
|---|---|---|
| Comparison with Poisson distribution Blue bars denote a histogram of data divided into 1 sec bins. Red curve is a Poisson curve with rate = median count rate of data. |
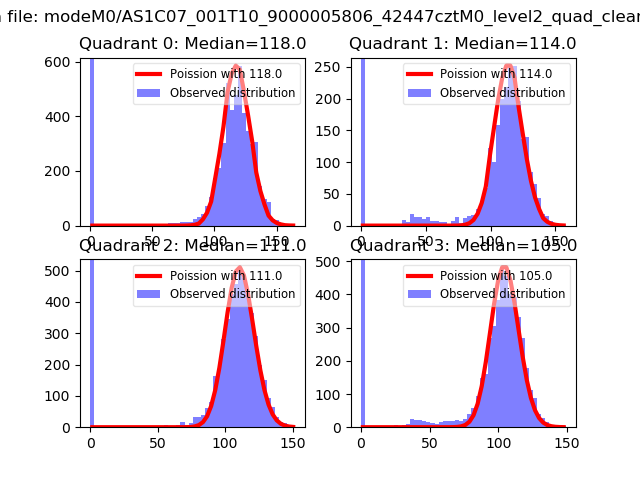 |
 |
| Quadrant-wise count rates Data is divided into 100 sec bins |
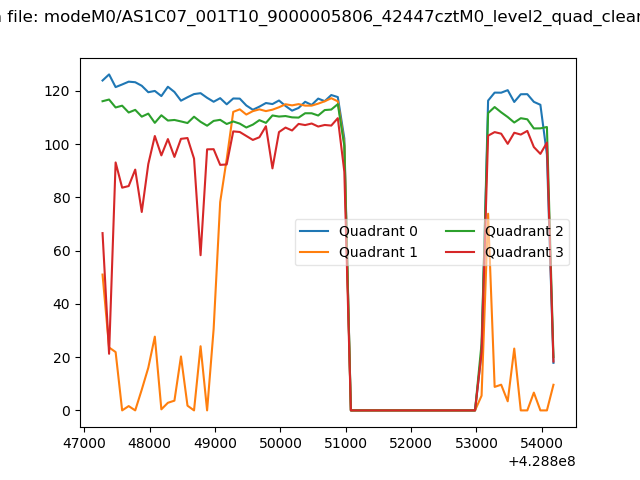 |
|
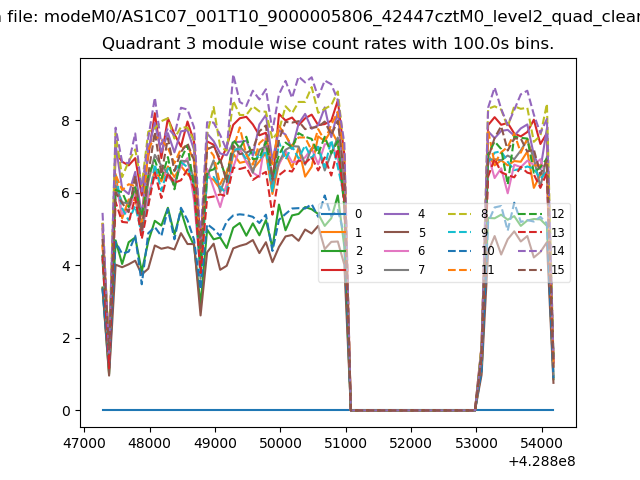
| Module-wise count rates for Quadrant A Data is divided into 100 sec bins |
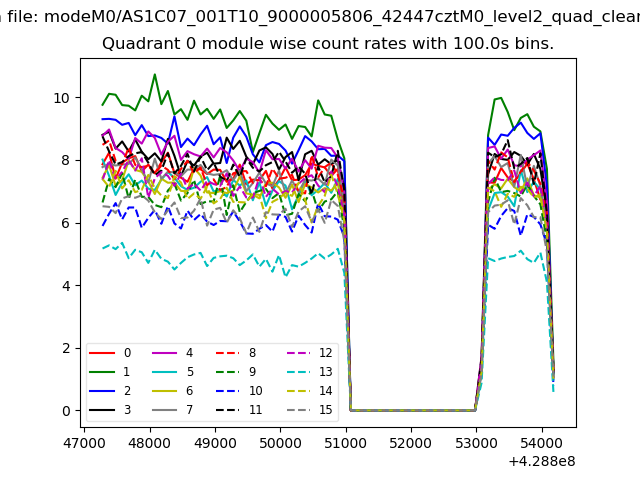 |
 |
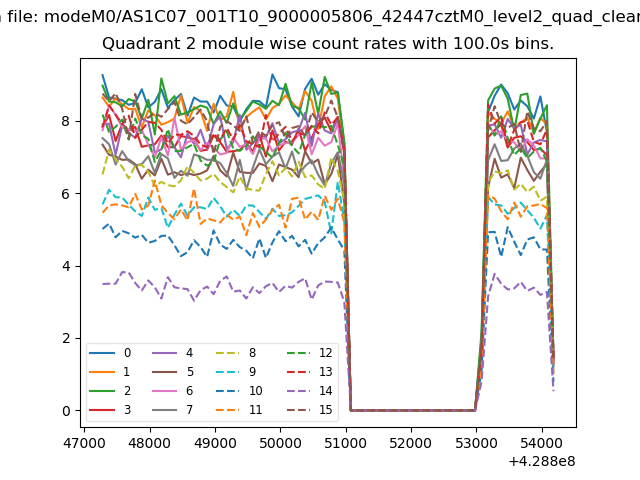
| Module-wise count rates for Quadrant B Data is divided into 100 sec bins |
 |
 |
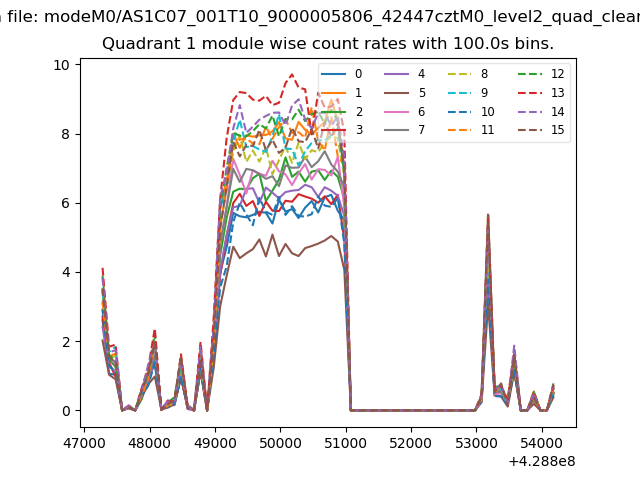
| Module-wise count rates for Quadrant C Data is divided into 100 sec bins |
 |
 |
| Module-wise count rates for Quadrant D Data is divided into 100 sec bins |
 |
 |
| Parameter | Plot |
|---|---|
| CZT HV Monitor | 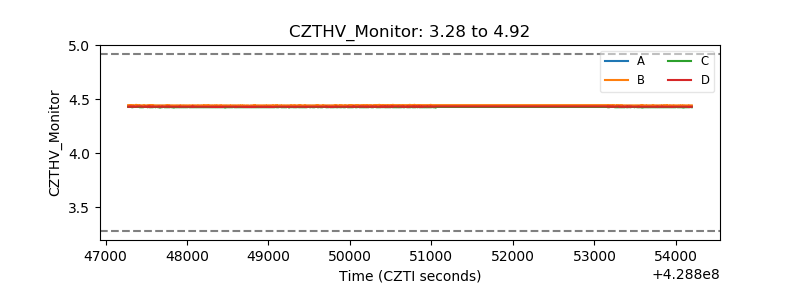 |
| D_VDD | 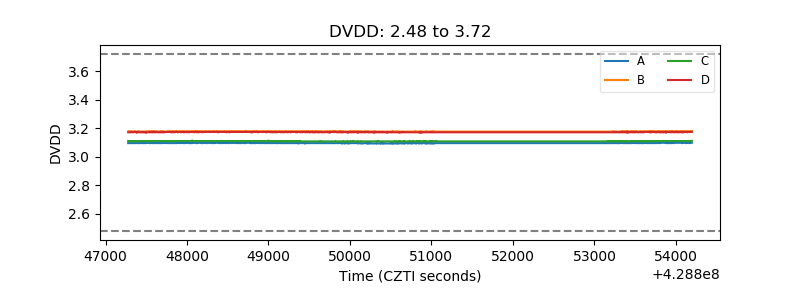 |
| Temperature 1 | 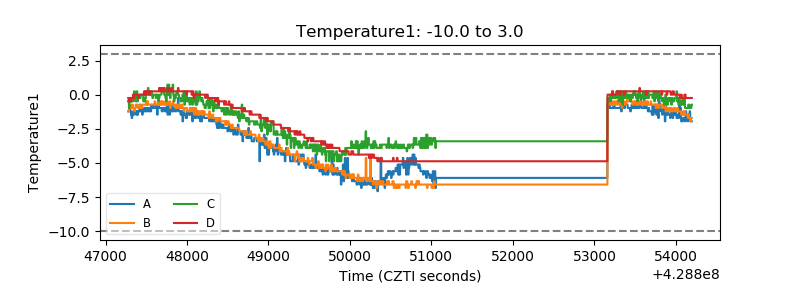 |
| Veto HV Monitor | 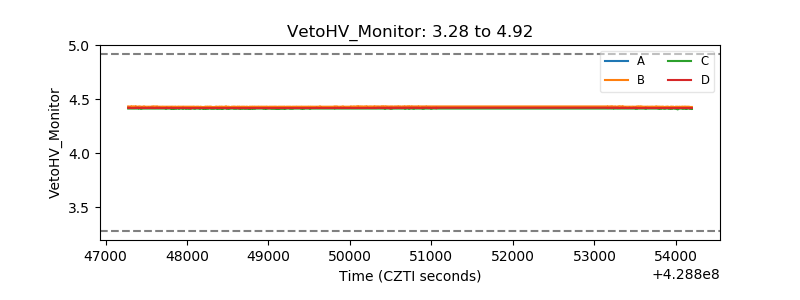 |
| Veto LLD | 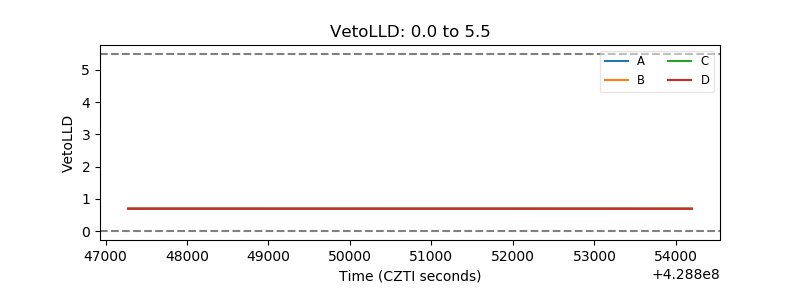 |
| Alpha Counter | 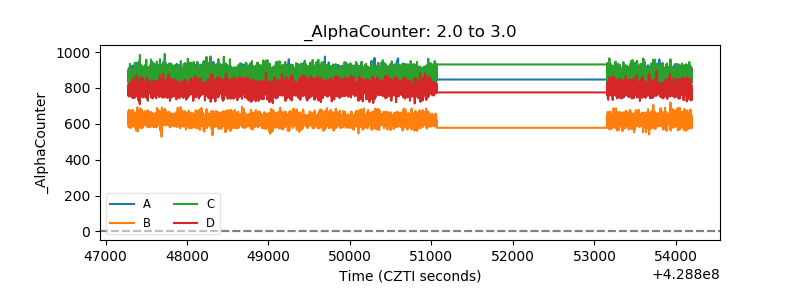 |
| _CPM_Rate | 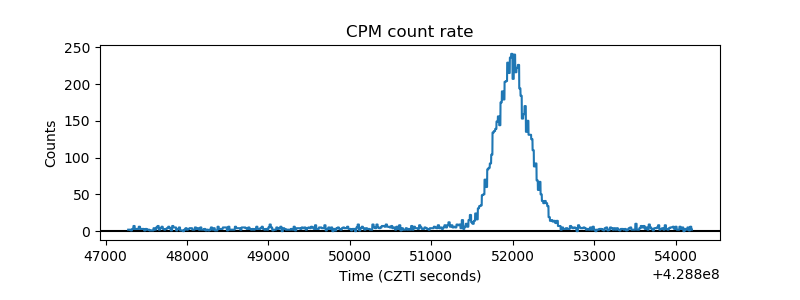 |
| CZT Counter | 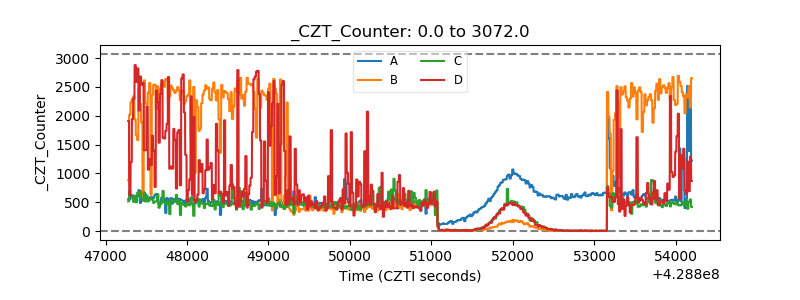 |
| +2.5 Volts monitor | 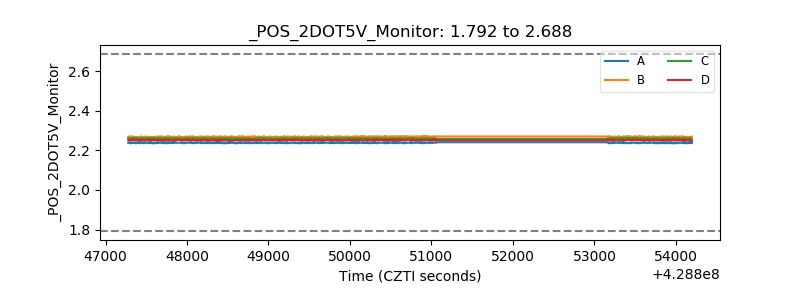 |
| +5 Volts monitor | 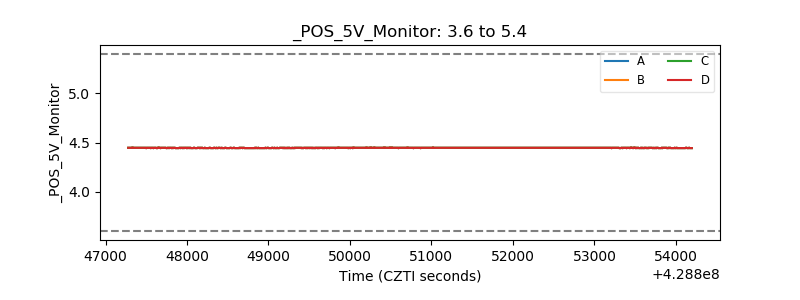 |
| _ROLL_ROT | 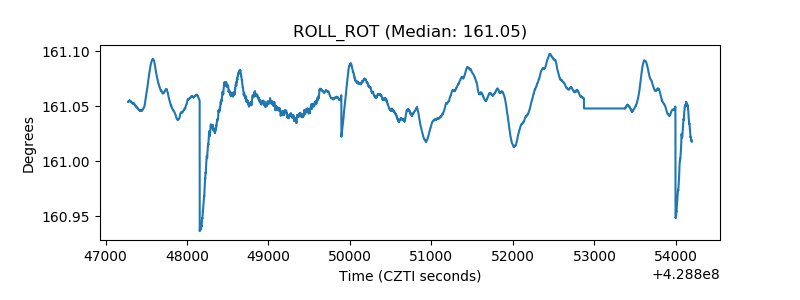 |
| _Roll_DEC | 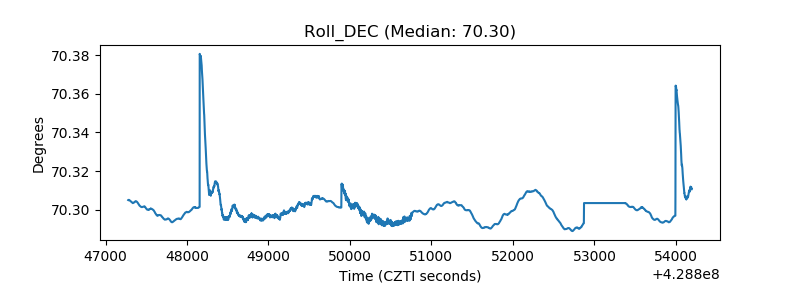 |
| _Roll_RA | 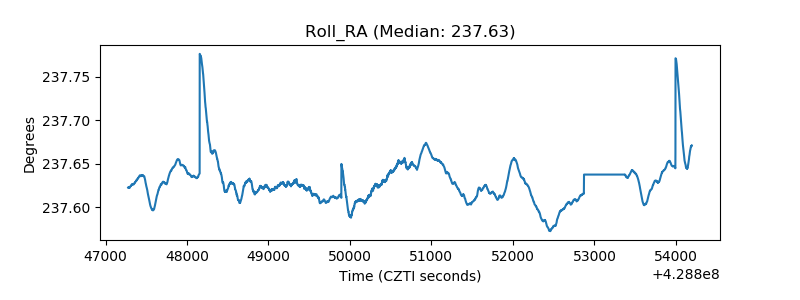 |
| Veto Counter | 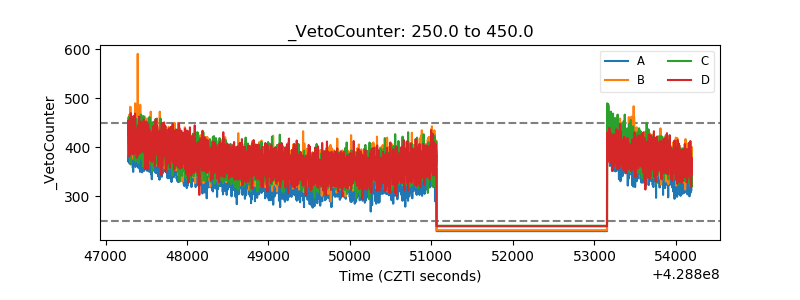 |