| Param | Original file | Final file |
|---|---|---|
| Filename | modeM0/AS1C07_001T10_9000005806_42448cztM0_level2.fits | modeM0/AS1C07_001T10_9000005806_42448cztM0_level2_quad_clean.evt |
| Size (bytes) | 456,707,520 | 72,815,040 |
| Size | 435.6 MB | 69.4 MB |
| Events in quadrant A | 2,996,697 | 544,303 |
| Events in quadrant B | 6,907,362 | 292,819 |
| Events in quadrant C | 2,454,092 | 533,560 |
| Events in quadrant D | 4,161,109 | 486,369 |
| Mode M9 | |||
|---|---|---|---|
| Quadrant | BADHDUFLAG | Total packets | Discarded packets |
| A | 0 | 20 | 0 |
| B | 0 | 20 | 0 |
| C | 0 | 20 | 0 |
| D | 0 | 20 | 0 |
| Mode SS | |||
|---|---|---|---|
| Quadrant | BADHDUFLAG | Total packets | Discarded packets |
| A | 0 | 100 | 0 |
| B | 0 | 100 | 0 |
| C | 0 | 100 | 0 |
| D | 0 | 100 | 0 |
| Mode M0 | |||
|---|---|---|---|
| Quadrant | BADHDUFLAG | Total packets | Discarded packets |
| A | 0 | 12065 | 1 |
| B | 0 | 24076 | 1 |
| C | 0 | 10593 | 1 |
| D | 0 | 15821 | 1 |
| Quadrant | Total seconds | Saturated seconds | Saturation percentage |
|---|---|---|---|
| A | 4959 | 145 | 2.923977% |
| B | 4960 | 2335 | 47.076613% |
| C | 4960 | 8 | 0.161290% |
| D | 4960 | 305 | 6.149194% |
Noise dominated data is calculated using 1-second bins in cleaned event files. If a bin has >2000 counts, and if more than 50% of those come from <1% of pixels, then it is considered to be noise-dominated and hence unusable.
| Quadrant | # 1 sec bins | Bins with >0 counts | Bins with >2000 counts | High rate bins dominated by noise | Noise dominated (total time) | Noise dominated (detector-on time) | Marked lightcurve |
|---|---|---|---|---|---|---|---|
| A | 6901 | 4960 | 94 | 94 | 1.36% | 1.90% | 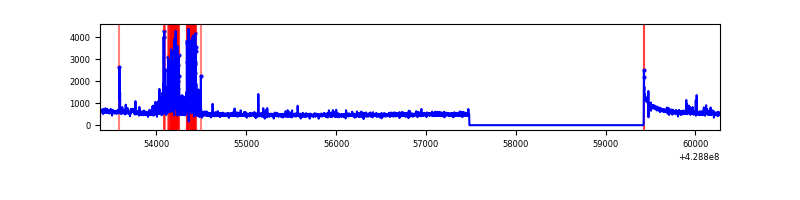 |
| B | 6902 | 4961 | 2040 | 2040 | 29.56% | 41.12% | 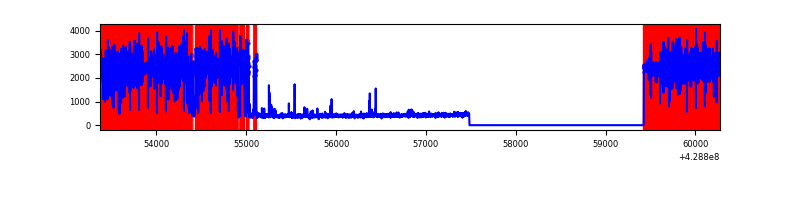 |
| C | 6902 | 4961 | 3 | 3 | 0.04% | 0.06% | 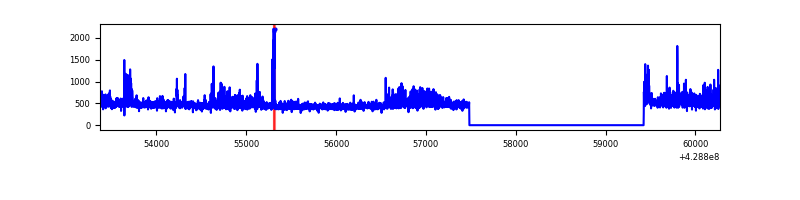 |
| D | 6902 | 4961 | 313 | 313 | 4.53% | 6.31% | 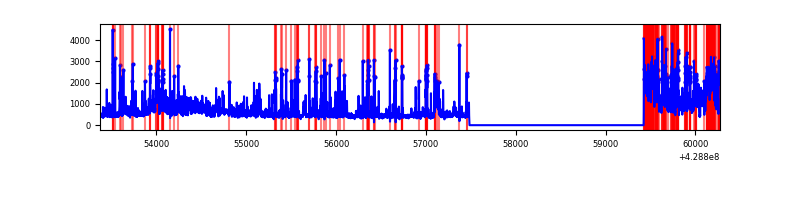 |
Top three noisy pixels from each quadrant. If the there are fewer than three noisy pixels in the level2.evt file, extra rows are filled as -1
| Pixel properties | Quadrant properties | ||||||
|---|---|---|---|---|---|---|---|
| Quadrant | DetID | PixID | Counts | Sigma | Mean | Median | Sigma |
| A | 10 | 83 | 527647 | 4938.78 | 515 | 504 | 106.7 |
| A | 14 | 223 | 430841 | 4031.8 | 515 | 504 | 106.7 |
| A | 13 | 6 | 11690 | 104.8 | 515 | 504 | 106.7 |
| B | 0 | 186 | 5282270 | 72500.34 | 374 | 365 | 72.9 |
| B | 3 | 112 | 48266 | 657.5 | 374 | 365 | 72.9 |
| B | 5 | 172 | 44179 | 601.4 | 374 | 365 | 72.9 |
| C | 15 | 214 | 207316 | 1745.98 | 509 | 511 | 118.4 |
| C | 10 | 34 | 179947 | 1514.91 | 509 | 511 | 118.4 |
| C | 14 | 254 | 28081 | 232.76 | 509 | 511 | 118.4 |
| D | 1 | 52 | 1421463 | 11502.0 | 506 | 492 | 123.5 |
| D | 2 | 16 | 182803 | 1475.71 | 506 | 492 | 123.5 |
| D | 13 | 171 | 133919 | 1080.02 | 506 | 492 | 123.5 |
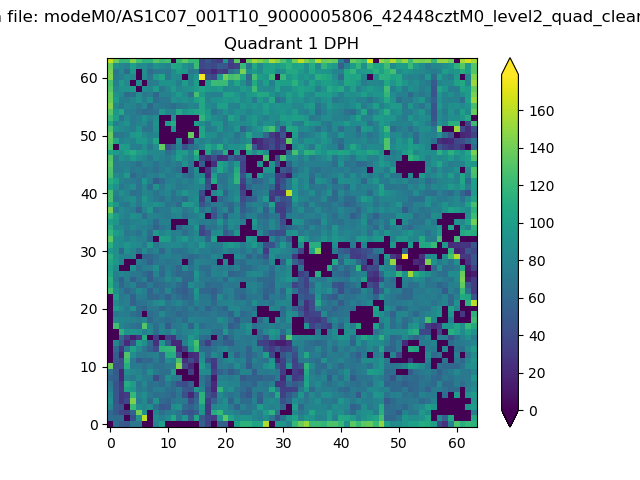
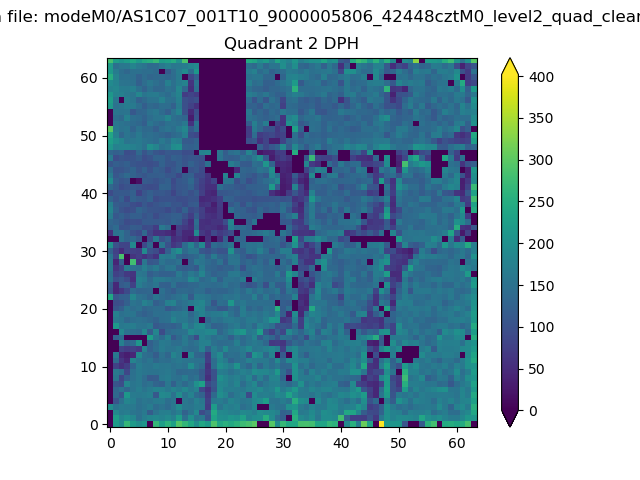
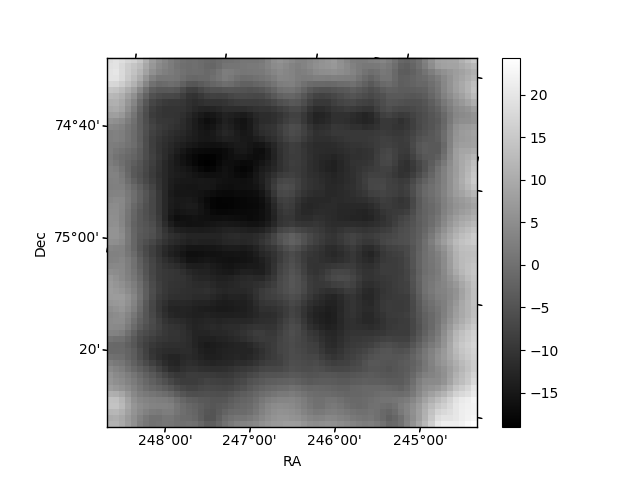
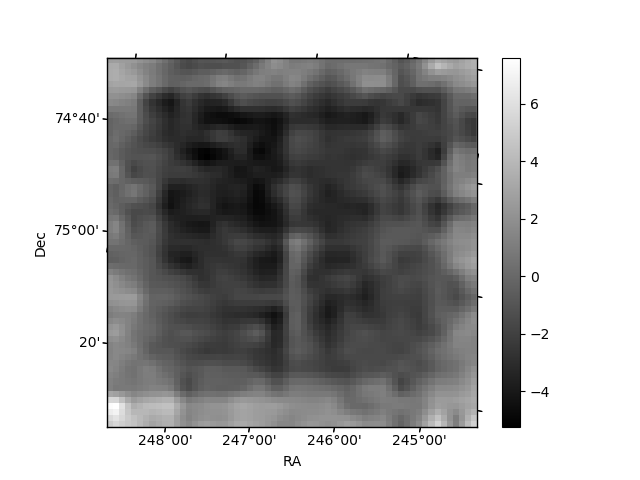
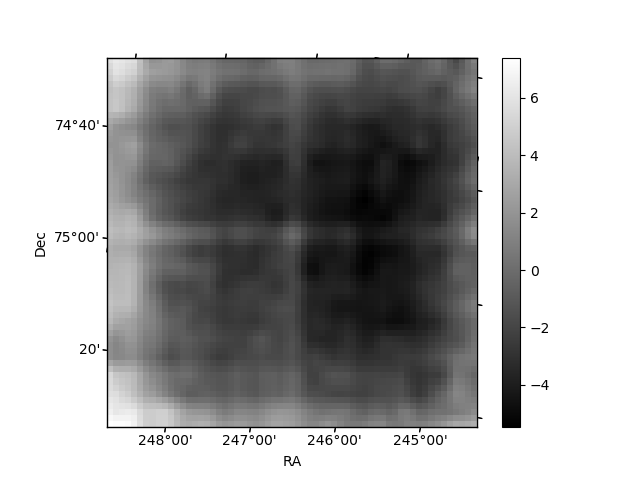
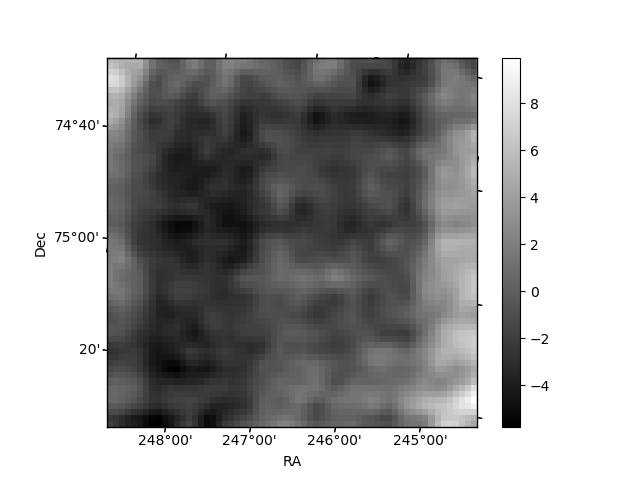
Histogram calculated using DETX and DETY for each event in the final _common_clean file
| Quadrant A |  |
 |
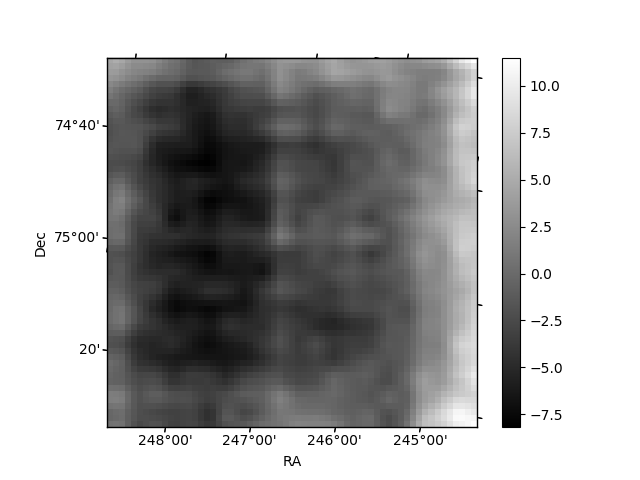
Quadrant B |
|---|---|---|---|
| Quadrant D | 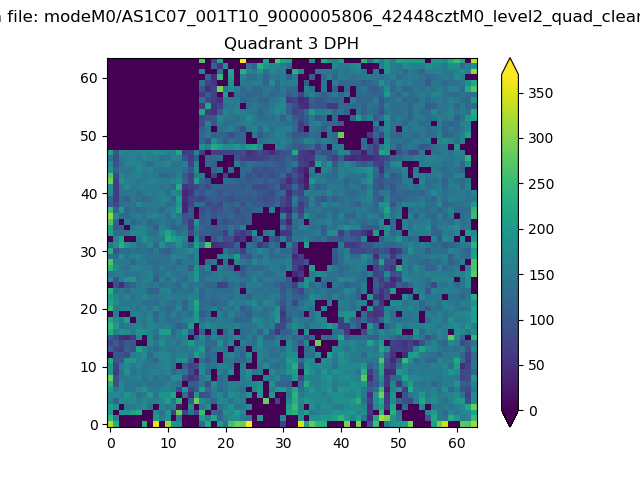 |
 |
Quadrant C |
| Plot type | Count rate plots | Images |
|---|---|---|
| Comparison with Poisson distribution Blue bars denote a histogram of data divided into 1 sec bins. Red curve is a Poisson curve with rate = median count rate of data. |
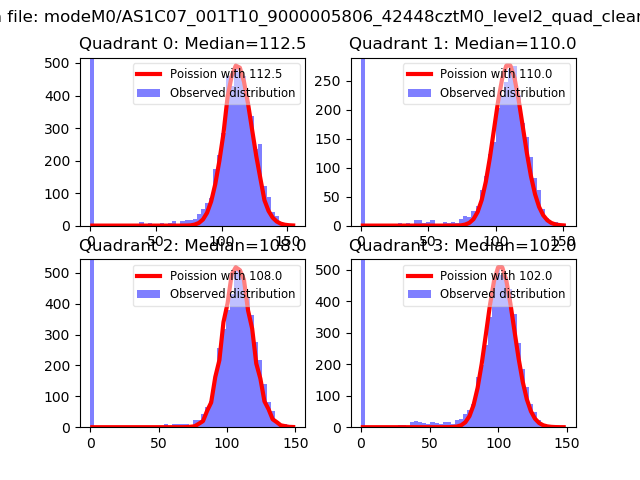 |
 |
| Quadrant-wise count rates Data is divided into 100 sec bins |
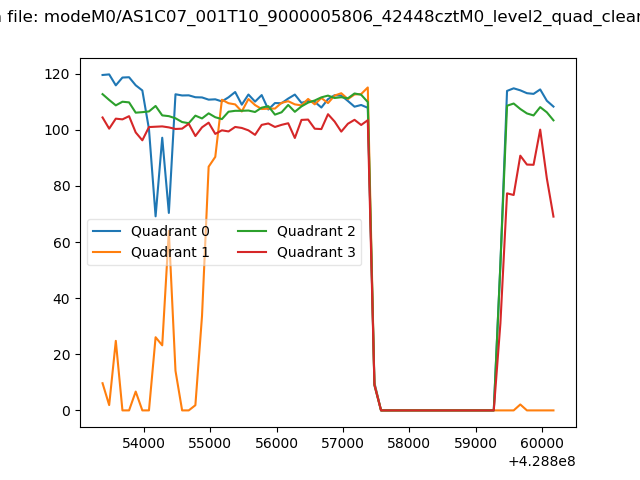 |
|
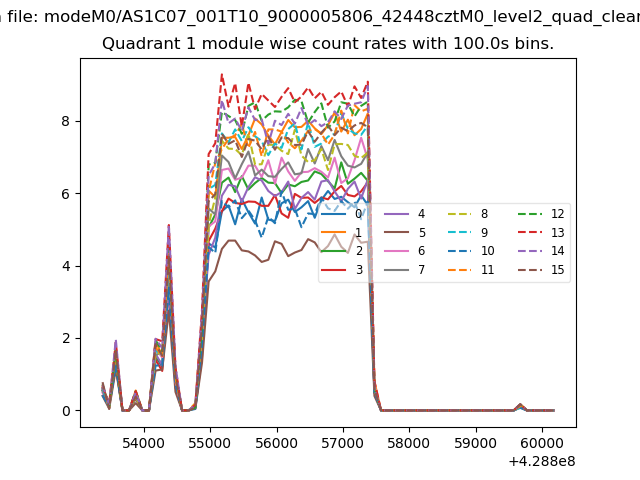
| Module-wise count rates for Quadrant A Data is divided into 100 sec bins |
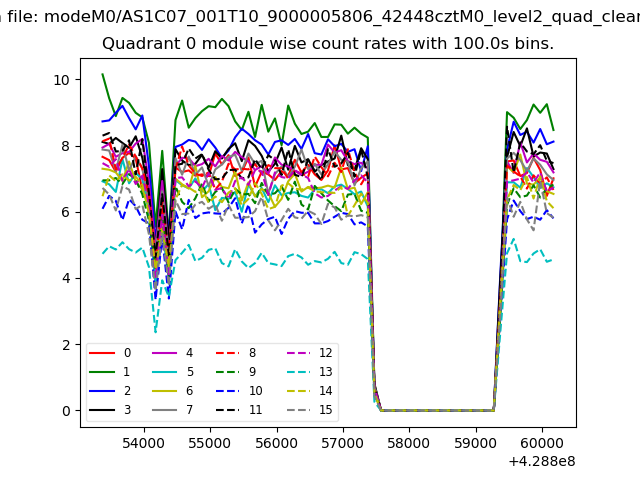 |
 |
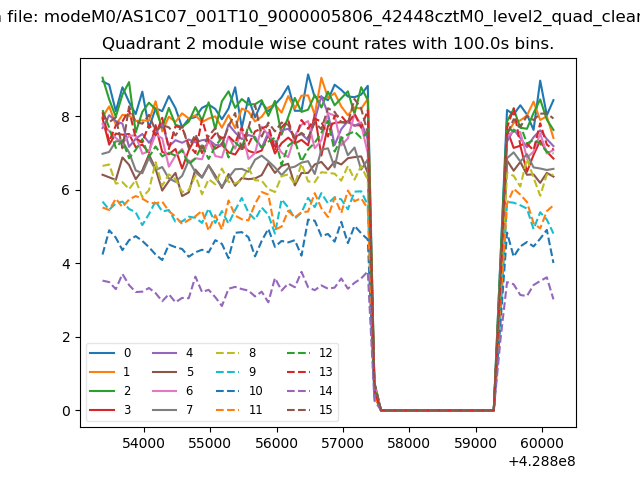
| Module-wise count rates for Quadrant B Data is divided into 100 sec bins |
 |
 |
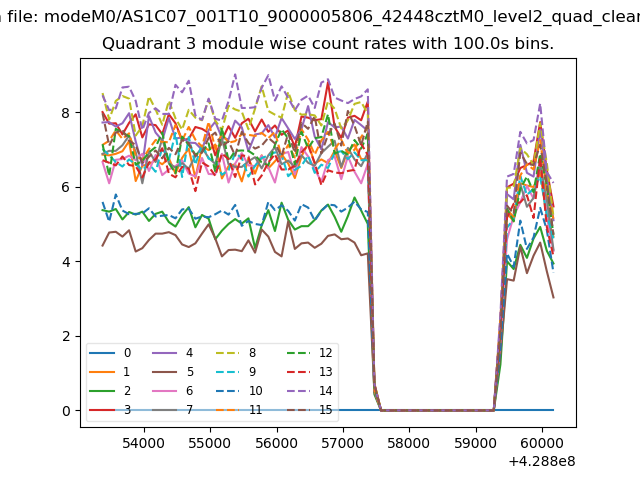
| Module-wise count rates for Quadrant C Data is divided into 100 sec bins |
 |
 |
| Module-wise count rates for Quadrant D Data is divided into 100 sec bins |
 |
 |
| Parameter | Plot |
|---|---|
| CZT HV Monitor | 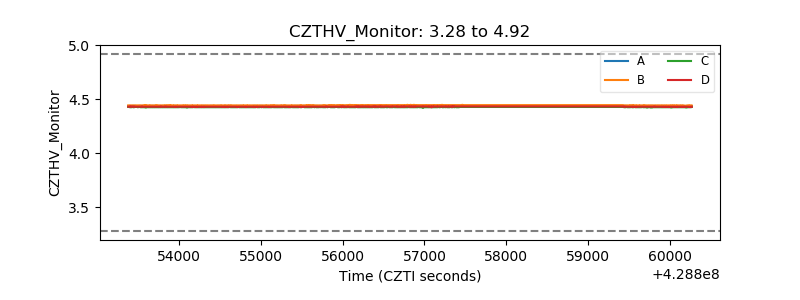 |
| D_VDD | 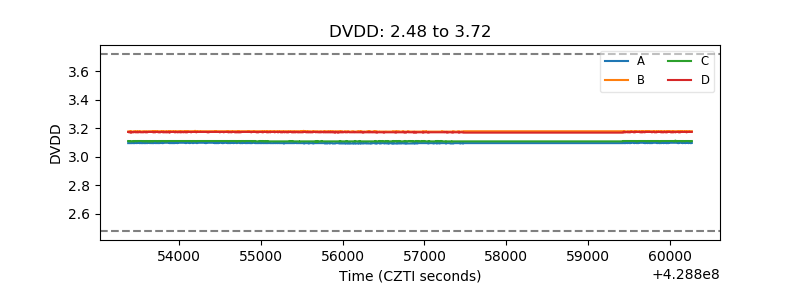 |
| Temperature 1 | 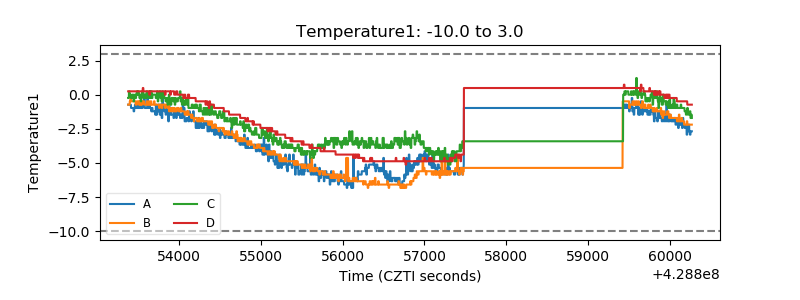 |
| Veto HV Monitor | 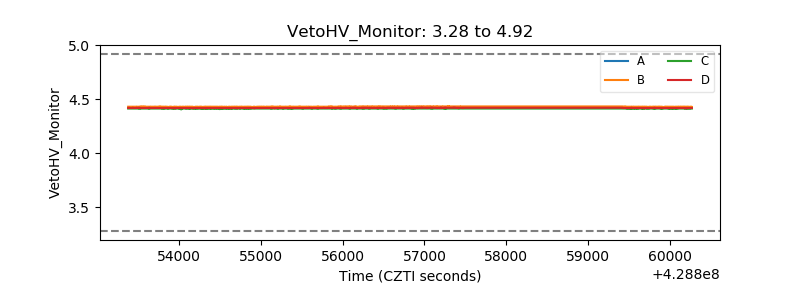 |
| Veto LLD | 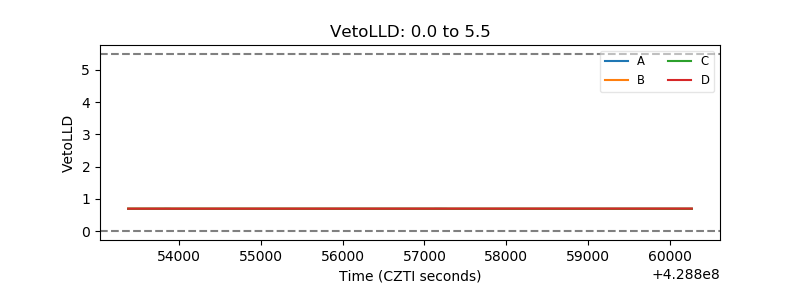 |
| Alpha Counter | 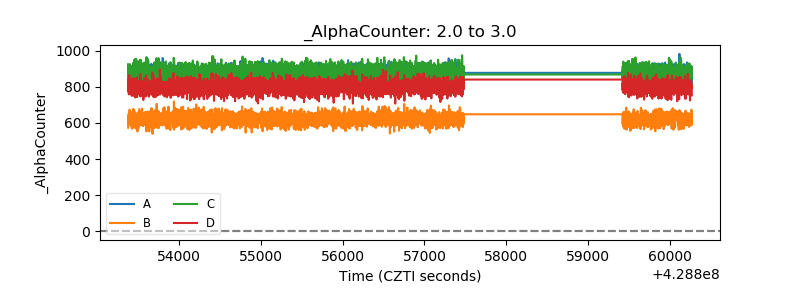 |
| _CPM_Rate | 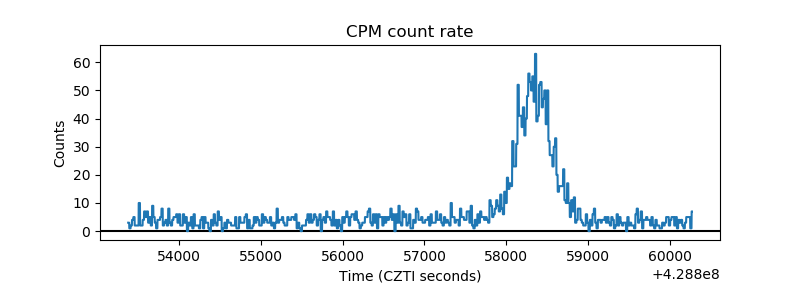 |
| CZT Counter | 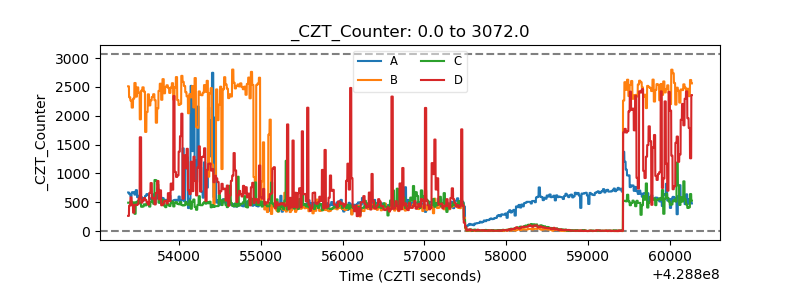 |
| +2.5 Volts monitor | 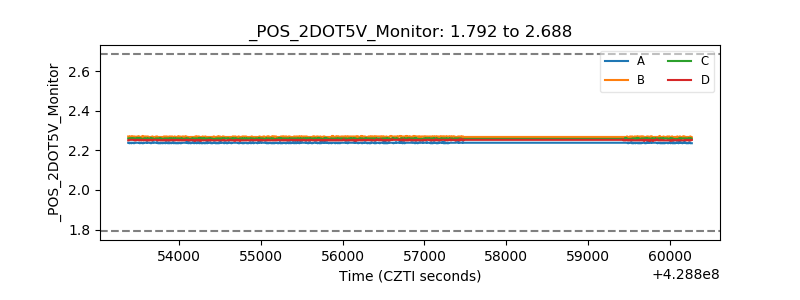 |
| +5 Volts monitor | 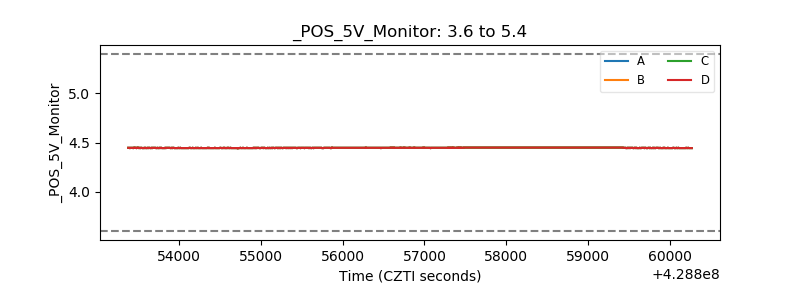 |
| _ROLL_ROT | 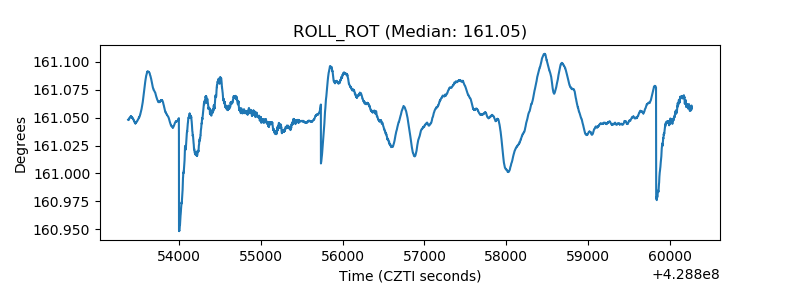 |
| _Roll_DEC | 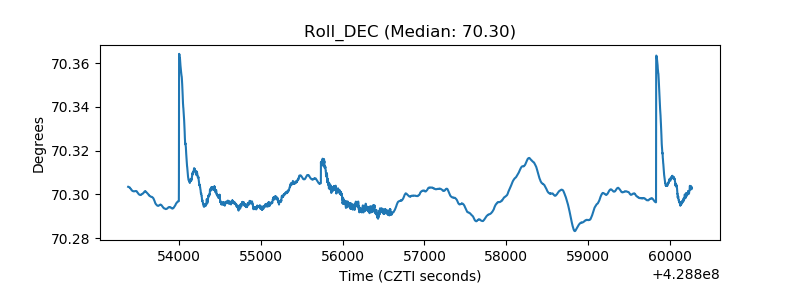 |
| _Roll_RA | 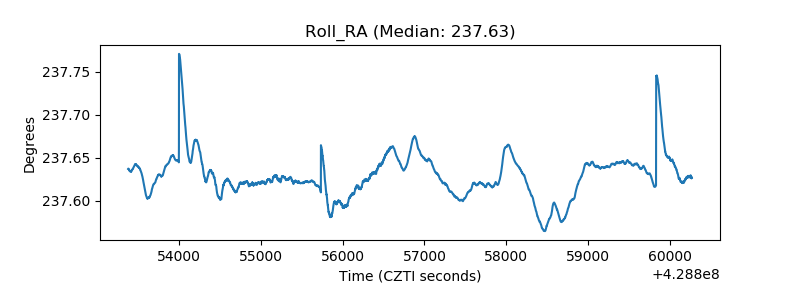 |
| Veto Counter | 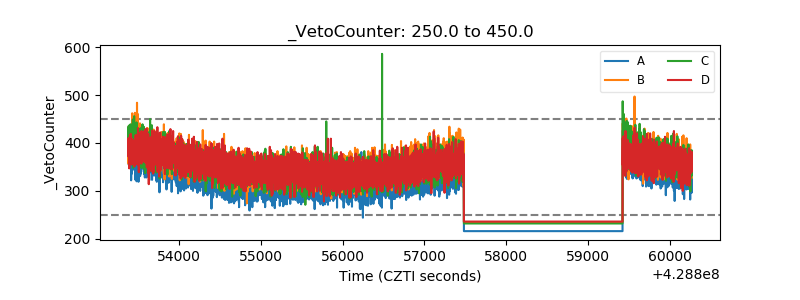 |