| Param | Original file | Final file |
|---|---|---|
| Filename | modeM0/AS1C07_001T10_9000005806_42449cztM0_level2.fits | modeM0/AS1C07_001T10_9000005806_42449cztM0_level2_quad_clean.evt |
| Size (bytes) | 521,487,360 | 78,923,520 |
| Size | 497.3 MB | 75.3 MB |
| Events in quadrant A | 2,842,991 | 592,634 |
| Events in quadrant B | 6,249,289 | 398,239 |
| Events in quadrant C | 2,613,288 | 573,517 |
| Events in quadrant D | 7,175,269 | 444,249 |
| Mode M9 | |||
|---|---|---|---|
| Quadrant | BADHDUFLAG | Total packets | Discarded packets |
| A | 0 | 15 | 0 |
| B | 0 | 15 | 0 |
| C | 0 | 15 | 0 |
| D | 0 | 15 | 0 |
| Mode SS | |||
|---|---|---|---|
| Quadrant | BADHDUFLAG | Total packets | Discarded packets |
| A | 0 | 112 | 0 |
| B | 0 | 112 | 0 |
| C | 0 | 112 | 0 |
| D | 0 | 112 | 0 |
| Mode M0 | |||
|---|---|---|---|
| Quadrant | BADHDUFLAG | Total packets | Discarded packets |
| A | 0 | 11797 | 1 |
| B | 0 | 22494 | 1 |
| C | 0 | 11340 | 1 |
| D | 0 | 25139 | 1 |
| Quadrant | Total seconds | Saturated seconds | Saturation percentage |
|---|---|---|---|
| A | 5437 | 9 | 0.165532% |
| B | 5437 | 1826 | 33.584697% |
| C | 5437 | 5 | 0.091962% |
| D | 5438 | 1180 | 21.699154% |
Noise dominated data is calculated using 1-second bins in cleaned event files. If a bin has >2000 counts, and if more than 50% of those come from <1% of pixels, then it is considered to be noise-dominated and hence unusable.
| Quadrant | # 1 sec bins | Bins with >0 counts | Bins with >2000 counts | High rate bins dominated by noise | Noise dominated (total time) | Noise dominated (detector-on time) | Marked lightcurve |
|---|---|---|---|---|---|---|---|
| A | 7019 | 5438 | 3 | 3 | 0.04% | 0.06% | 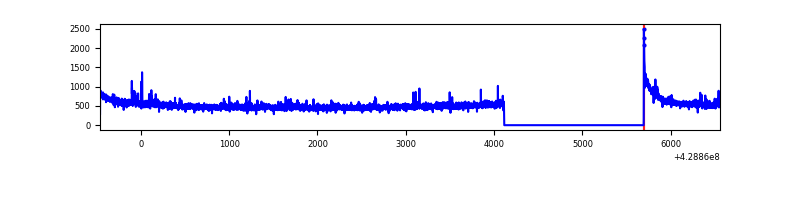 |
| B | 7019 | 5438 | 1523 | 1523 | 21.70% | 28.01% | 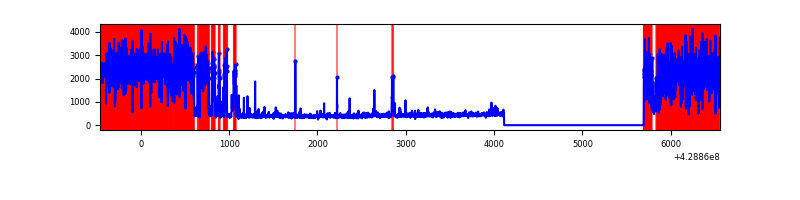 |
| C | 7019 | 5438 | 0 | 0 | 0.00% | 0.00% | 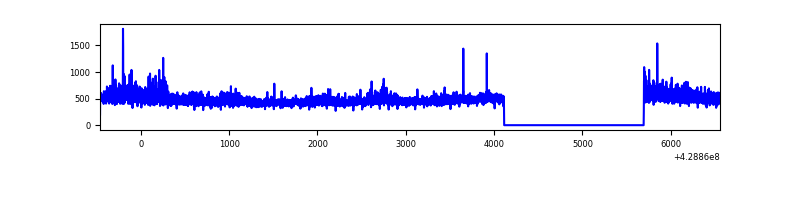 |
| D | 7020 | 5439 | 1195 | 1195 | 17.02% | 21.97% | 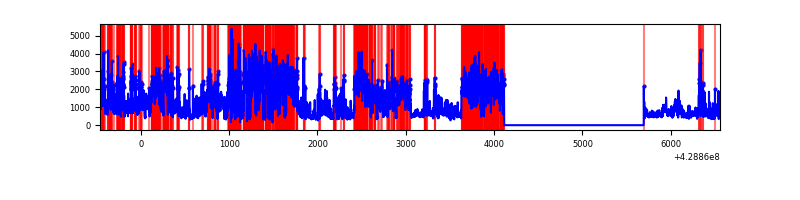 |
Top three noisy pixels from each quadrant. If the there are fewer than three noisy pixels in the level2.evt file, extra rows are filled as -1
| Pixel properties | Quadrant properties | ||||||
|---|---|---|---|---|---|---|---|
| Quadrant | DetID | PixID | Counts | Sigma | Mean | Median | Sigma |
| A | 10 | 83 | 573953 | 4938.24 | 566 | 552 | 116.1 |
| A | 12 | 189 | 48917 | 416.53 | 566 | 552 | 116.1 |
| A | 14 | 223 | 11179 | 91.52 | 566 | 552 | 116.1 |
| B | 0 | 186 | 4118510 | 45204.88 | 469 | 456 | 91.1 |
| B | 3 | 112 | 129799 | 1419.83 | 469 | 456 | 91.1 |
| B | 5 | 255 | 73123 | 797.68 | 469 | 456 | 91.1 |
| C | 15 | 214 | 227092 | 1752.37 | 554 | 557 | 129.3 |
| C | 10 | 34 | 201413 | 1553.73 | 554 | 557 | 129.3 |
| C | 15 | 111 | 10380 | 75.99 | 554 | 557 | 129.3 |
| D | 1 | 52 | 4257641 | 33666.53 | 513 | 497 | 126.5 |
| D | 2 | 16 | 360827 | 2849.58 | 513 | 497 | 126.5 |
| D | 13 | 171 | 279978 | 2210.2 | 513 | 497 | 126.5 |
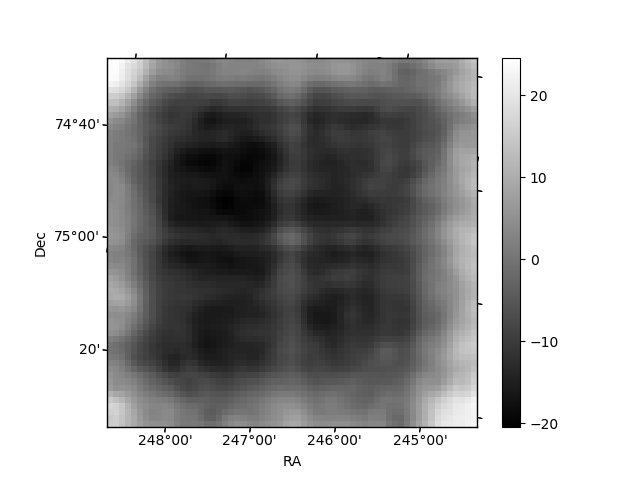
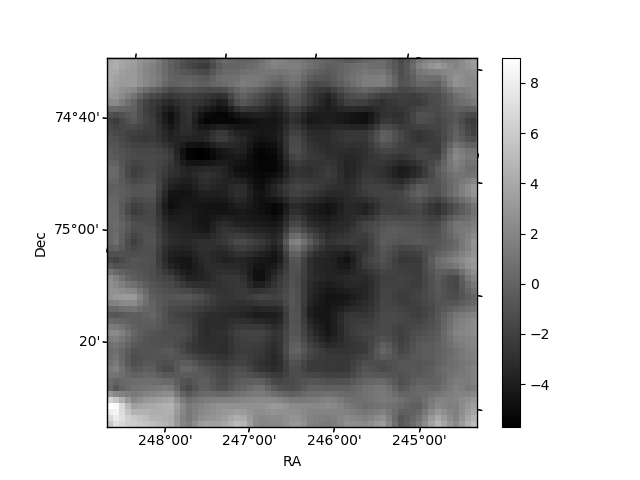
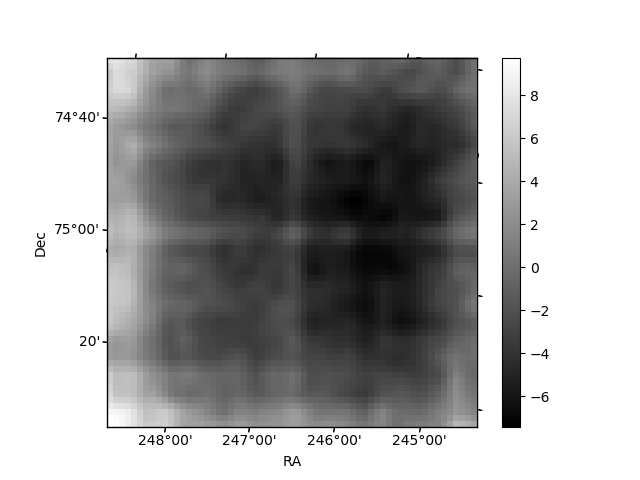
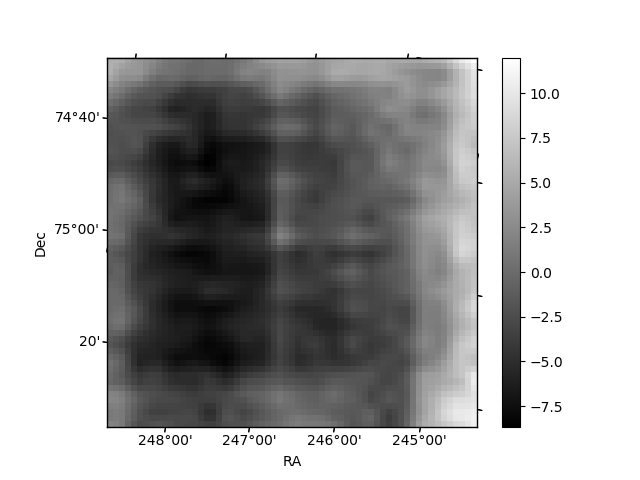
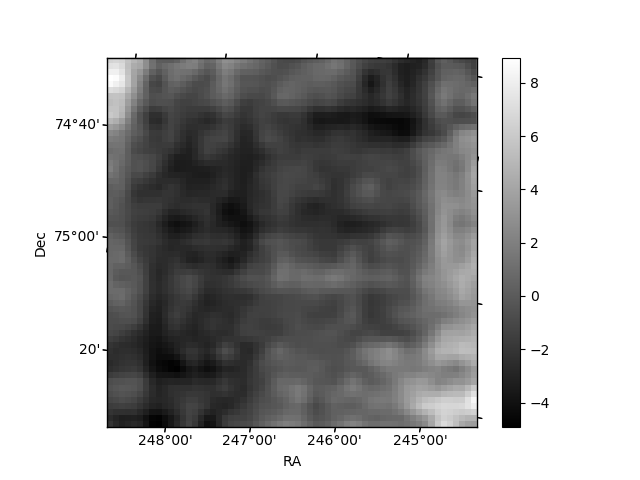
Histogram calculated using DETX and DETY for each event in the final _common_clean file
| Quadrant A | 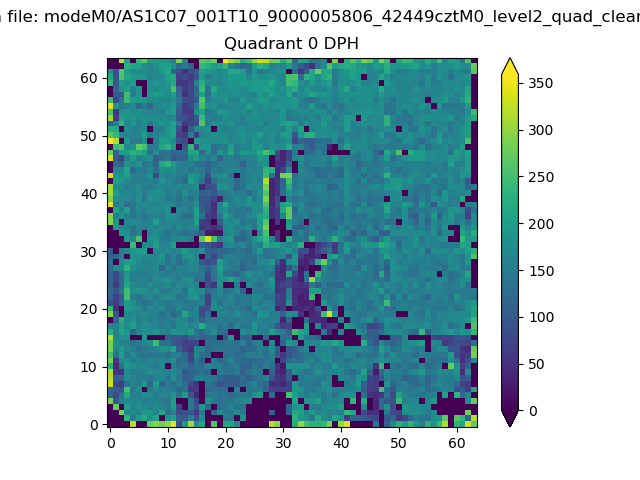 |
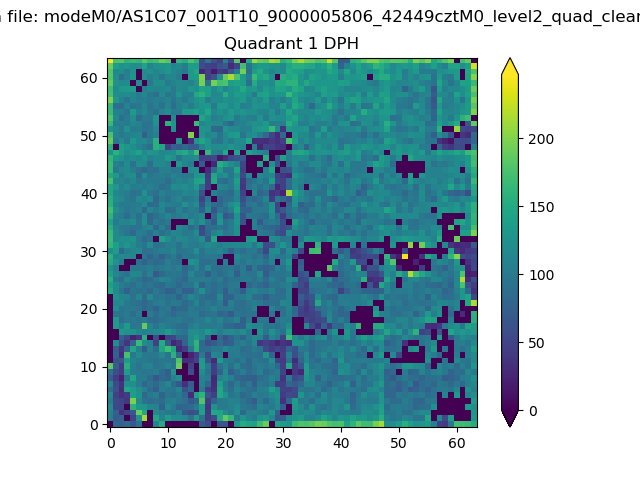 |
Quadrant B |
|---|---|---|---|
| Quadrant D | 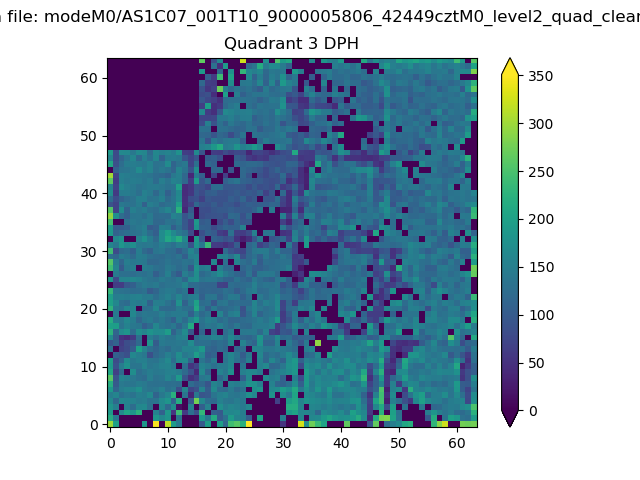 |
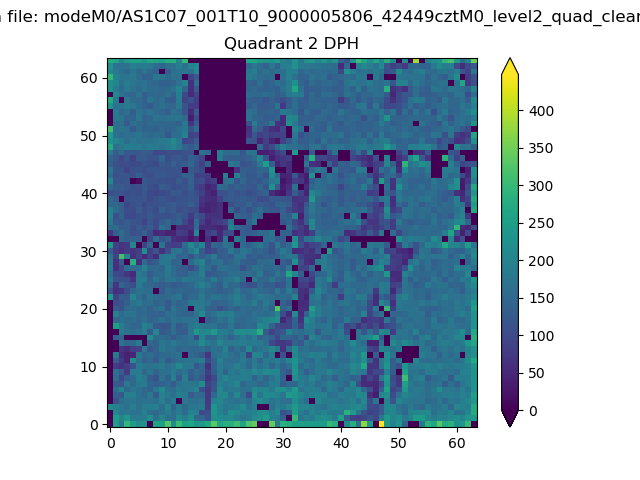 |
Quadrant C |
| Plot type | Count rate plots | Images |
|---|---|---|
| Comparison with Poisson distribution Blue bars denote a histogram of data divided into 1 sec bins. Red curve is a Poisson curve with rate = median count rate of data. |
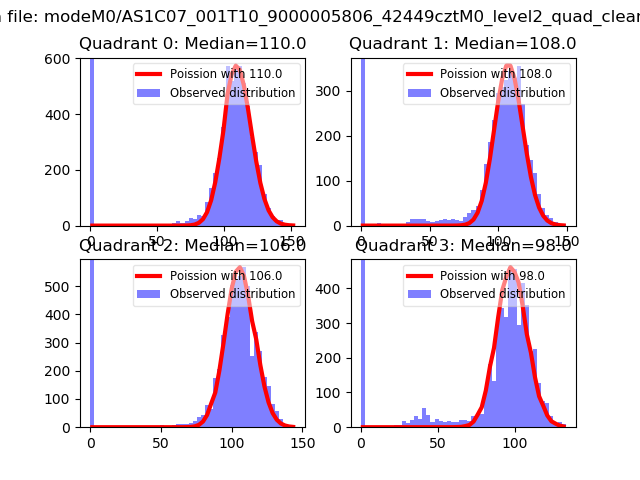 |
 |
| Quadrant-wise count rates Data is divided into 100 sec bins |
 |
|
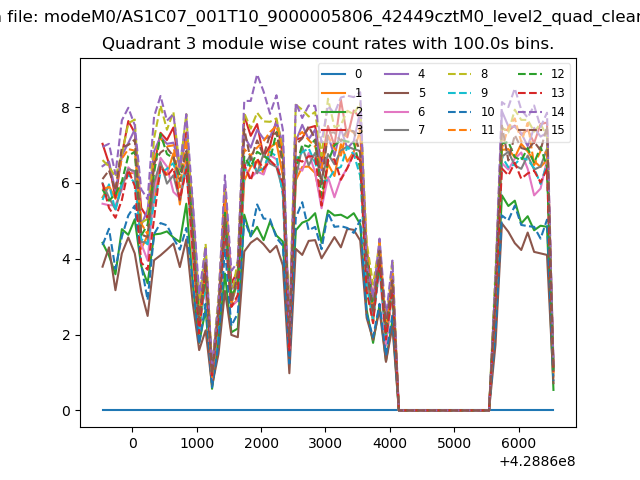
| Module-wise count rates for Quadrant A Data is divided into 100 sec bins |
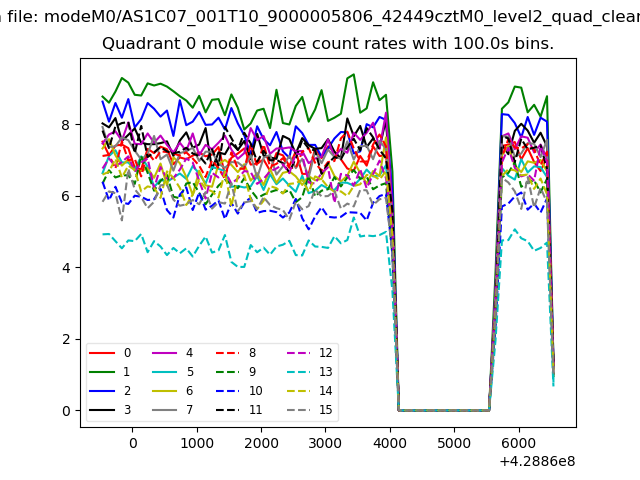 |
 |
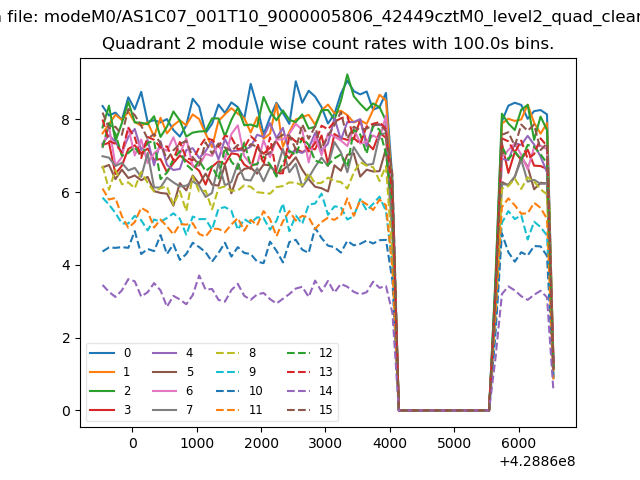
| Module-wise count rates for Quadrant B Data is divided into 100 sec bins |
 |
 |
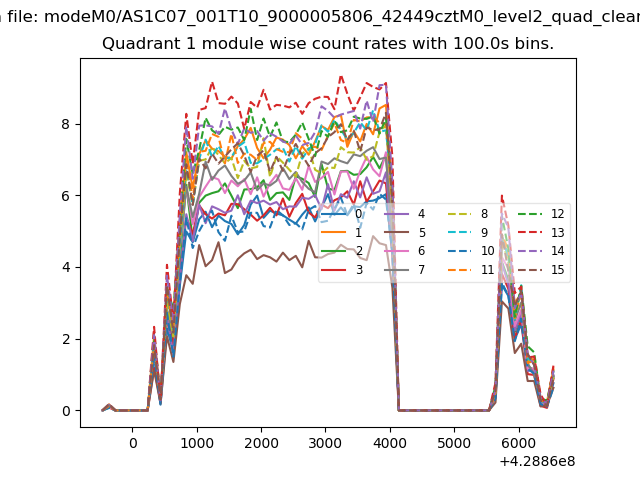
| Module-wise count rates for Quadrant C Data is divided into 100 sec bins |
 |
 |
| Module-wise count rates for Quadrant D Data is divided into 100 sec bins |
 |
 |
| Parameter | Plot |
|---|---|
| CZT HV Monitor | 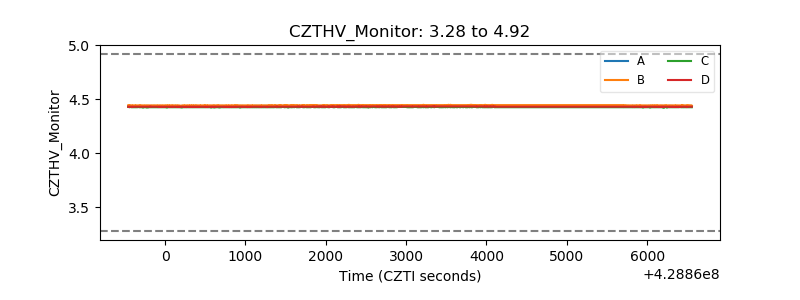 |
| D_VDD | 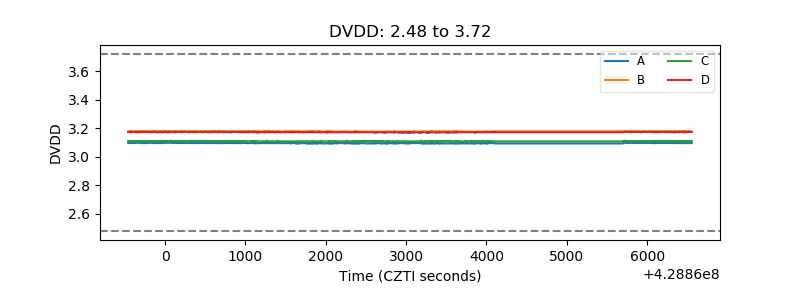 |
| Temperature 1 | 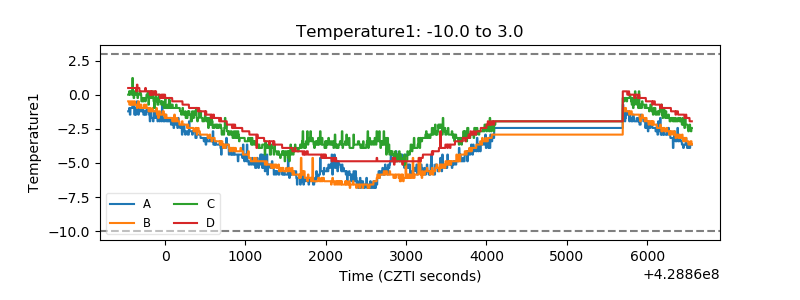 |
| Veto HV Monitor | 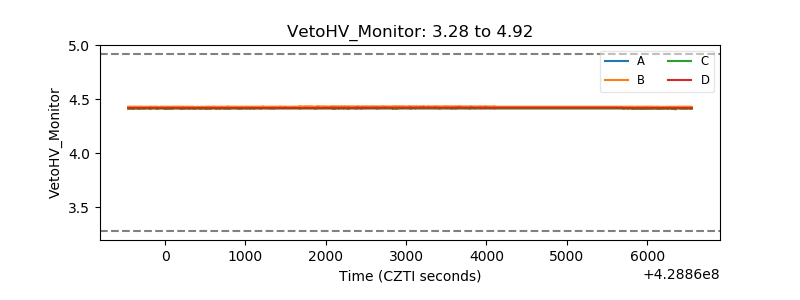 |
| Veto LLD | 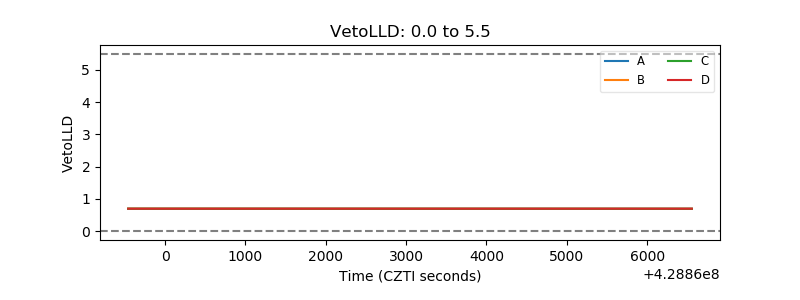 |
| Alpha Counter | 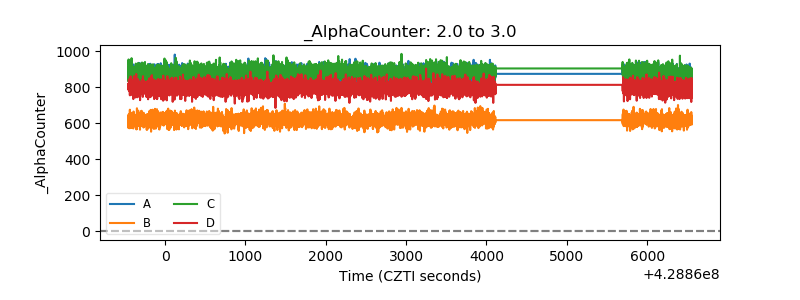 |
| _CPM_Rate | 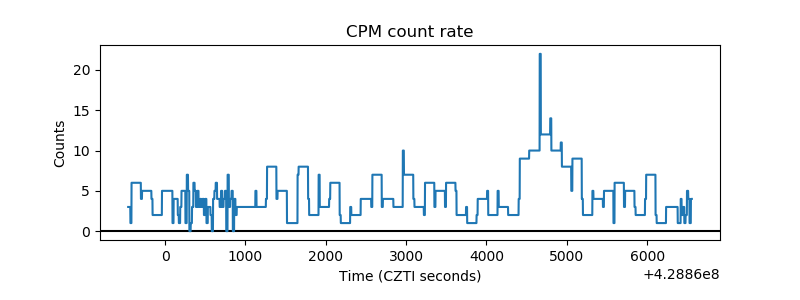 |
| CZT Counter | 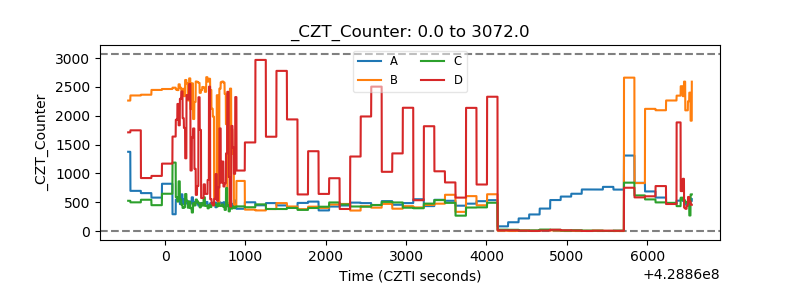 |
| +2.5 Volts monitor | 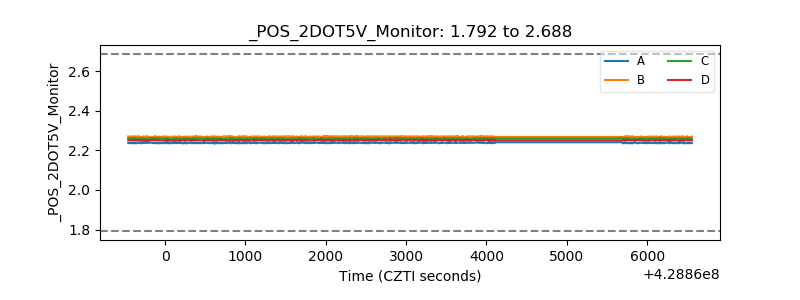 |
| +5 Volts monitor | 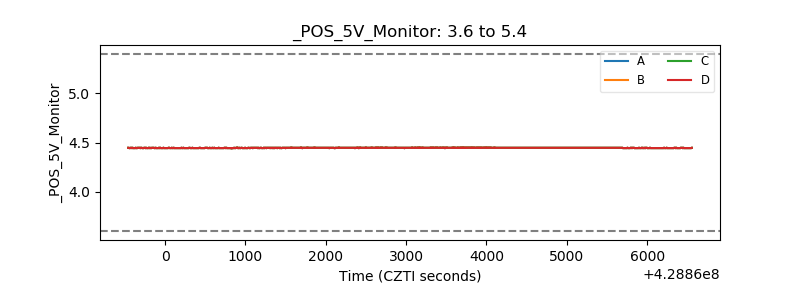 |
| _ROLL_ROT | 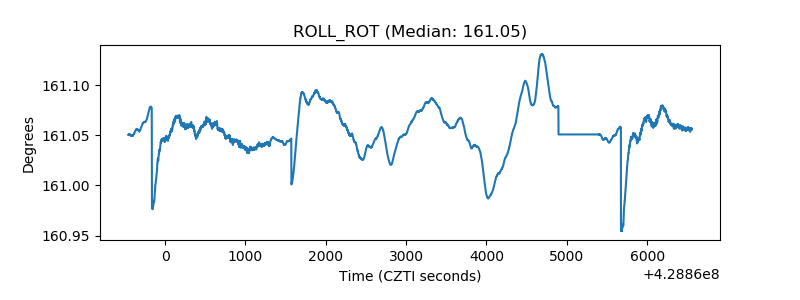 |
| _Roll_DEC | 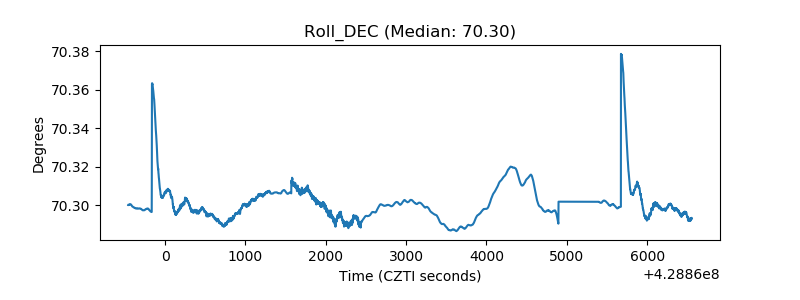 |
| _Roll_RA | 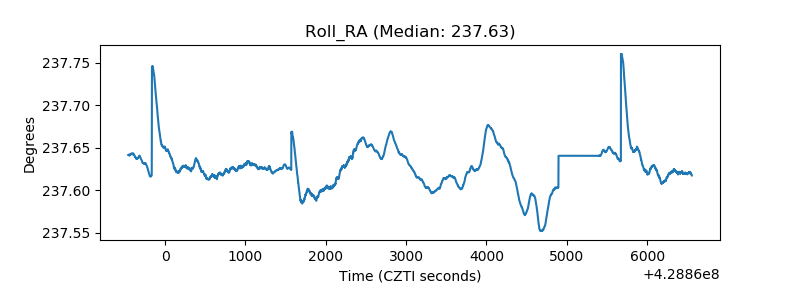 |
| Veto Counter | 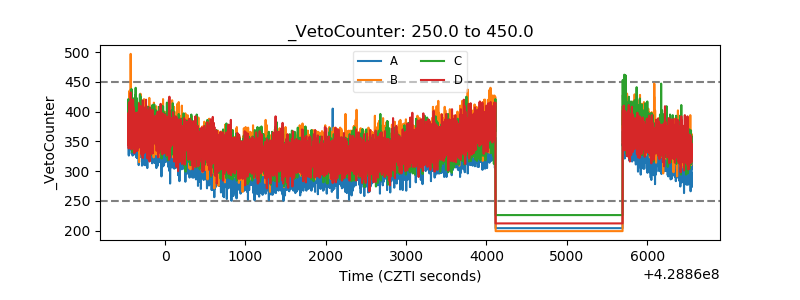 |