| Param | Original file | Final file |
|---|---|---|
| Filename | modeM0/AS1C07_001T10_9000005806_42450cztM0_level2.fits | modeM0/AS1C07_001T10_9000005806_42450cztM0_level2_quad_clean.evt |
| Size (bytes) | 450,011,520 | 88,076,160 |
| Size | 429.2 MB | 84.0 MB |
| Events in quadrant A | 3,214,323 | 622,914 |
| Events in quadrant B | 5,542,505 | 476,979 |
| Events in quadrant C | 2,849,468 | 611,077 |
| Events in quadrant D | 4,599,488 | 549,670 |
| Mode M9 | |||
|---|---|---|---|
| Quadrant | BADHDUFLAG | Total packets | Discarded packets |
| A | 0 | 16 | 0 |
| B | 0 | 17 | 0 |
| C | 0 | 17 | 0 |
| D | 0 | 17 | 0 |
| Mode SS | |||
|---|---|---|---|
| Quadrant | BADHDUFLAG | Total packets | Discarded packets |
| A | 0 | 118 | 0 |
| B | 0 | 118 | 0 |
| C | 0 | 118 | 0 |
| D | 0 | 118 | 0 |
| Mode M0 | |||
|---|---|---|---|
| Quadrant | BADHDUFLAG | Total packets | Discarded packets |
| A | 0 | 13143 | 2 |
| B | 0 | 20835 | 2 |
| C | 0 | 12306 | 2 |
| D | 0 | 17710 | 2 |
| Quadrant | Total seconds | Saturated seconds | Saturation percentage |
|---|---|---|---|
| A | 5810 | 53 | 0.912220% |
| B | 5809 | 1441 | 24.806335% |
| C | 5809 | 5 | 0.086073% |
| D | 5809 | 312 | 5.370976% |
Noise dominated data is calculated using 1-second bins in cleaned event files. If a bin has >2000 counts, and if more than 50% of those come from <1% of pixels, then it is considered to be noise-dominated and hence unusable.
| Quadrant | # 1 sec bins | Bins with >0 counts | Bins with >2000 counts | High rate bins dominated by noise | Noise dominated (total time) | Noise dominated (detector-on time) | Marked lightcurve |
|---|---|---|---|---|---|---|---|
| A | 7153 | 5811 | 24 | 24 | 0.34% | 0.41% | 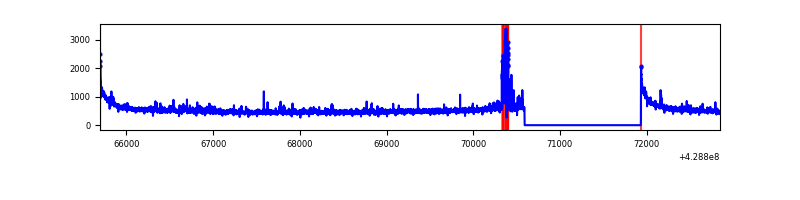 |
| B | 7152 | 5810 | 1115 | 1115 | 15.59% | 19.19% | 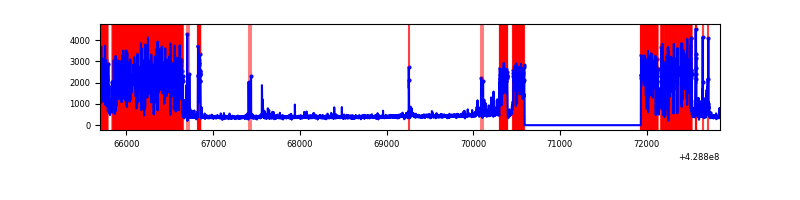 |
| C | 7152 | 5810 | 2 | 2 | 0.03% | 0.03% | 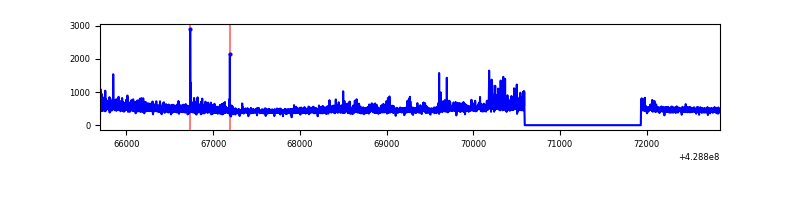 |
| D | 7152 | 5810 | 291 | 291 | 4.07% | 5.01% | 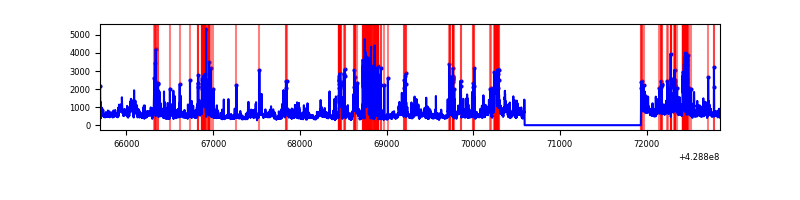 |
Top three noisy pixels from each quadrant. If the there are fewer than three noisy pixels in the level2.evt file, extra rows are filled as -1
| Pixel properties | Quadrant properties | ||||||
|---|---|---|---|---|---|---|---|
| Quadrant | DetID | PixID | Counts | Sigma | Mean | Median | Sigma |
| A | 10 | 83 | 654941 | 5209.55 | 607 | 592 | 125.6 |
| A | 13 | 248 | 97371 | 770.5 | 607 | 592 | 125.6 |
| A | 12 | 189 | 96780 | 765.79 | 607 | 592 | 125.6 |
| B | 0 | 186 | 3224178 | 31346.63 | 534 | 518 | 102.8 |
| B | 5 | 255 | 86191 | 833.08 | 534 | 518 | 102.8 |
| B | 3 | 112 | 54137 | 521.39 | 534 | 518 | 102.8 |
| C | 15 | 214 | 245062 | 1750.04 | 596 | 598 | 139.7 |
| C | 10 | 34 | 232968 | 1663.46 | 596 | 598 | 139.7 |
| C | 14 | 254 | 29041 | 203.61 | 596 | 598 | 139.7 |
| D | 1 | 52 | 1423150 | 9970.02 | 586 | 569 | 142.7 |
| D | 13 | 171 | 214877 | 1501.96 | 586 | 569 | 142.7 |
| D | 10 | 199 | 184441 | 1288.65 | 586 | 569 | 142.7 |
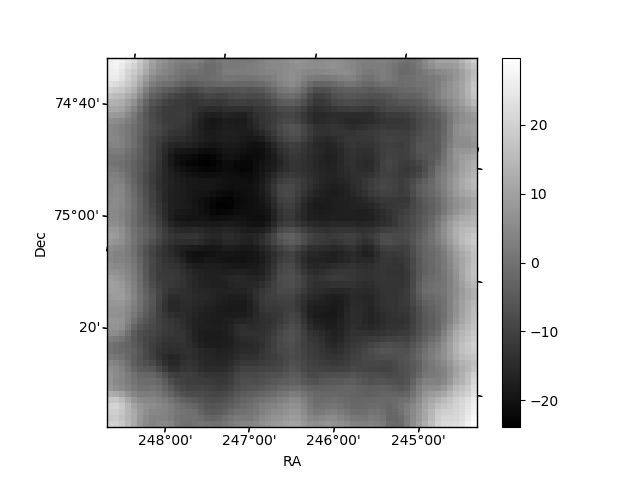
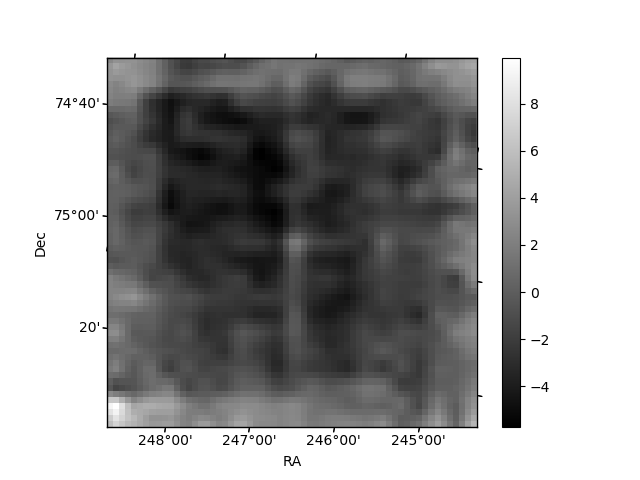
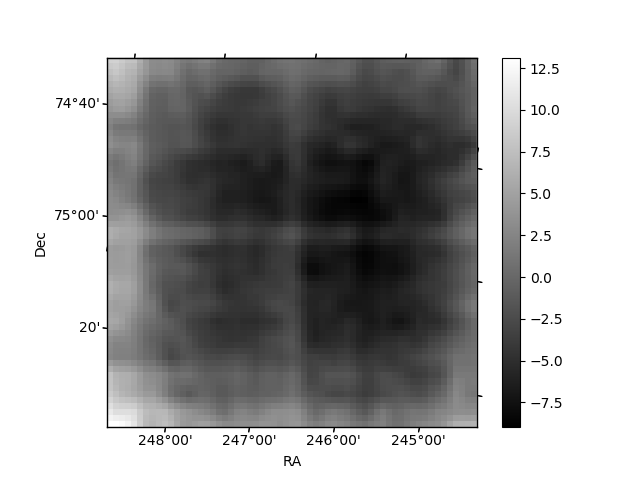
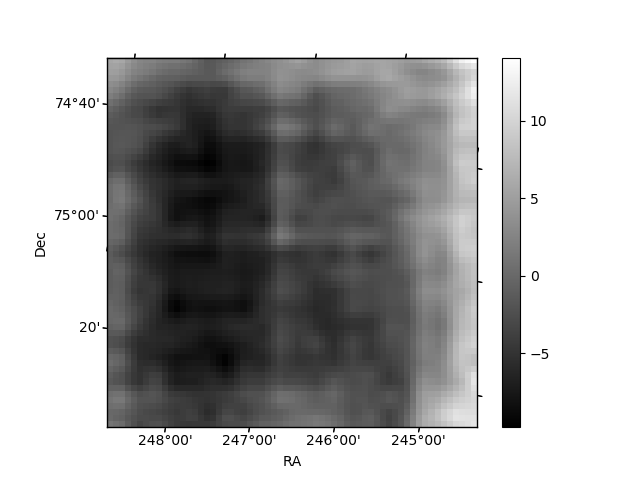
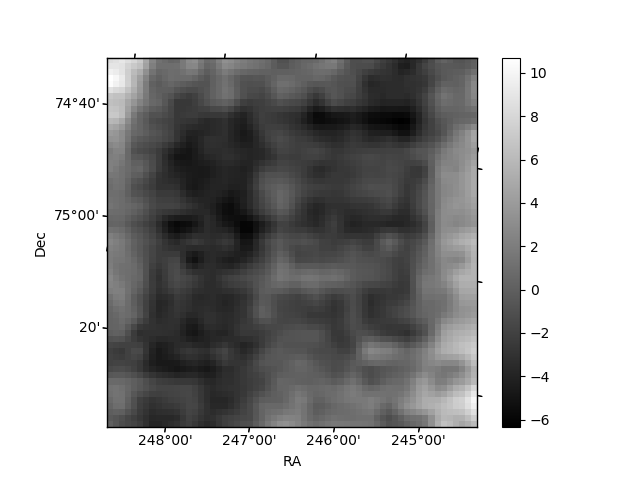
Histogram calculated using DETX and DETY for each event in the final _common_clean file
| Quadrant A | 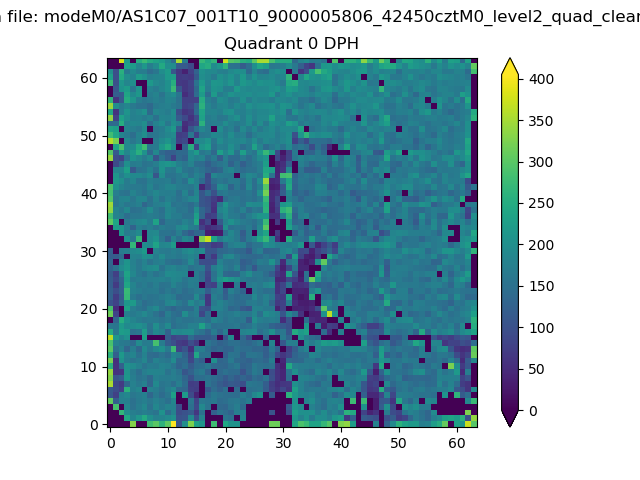 |
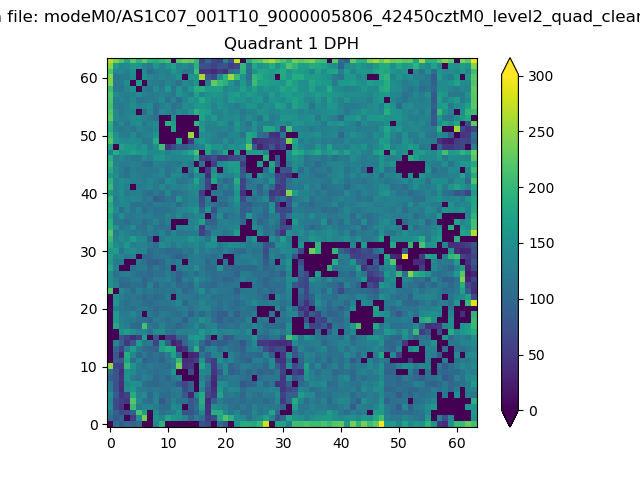 |
Quadrant B |
|---|---|---|---|
| Quadrant D | 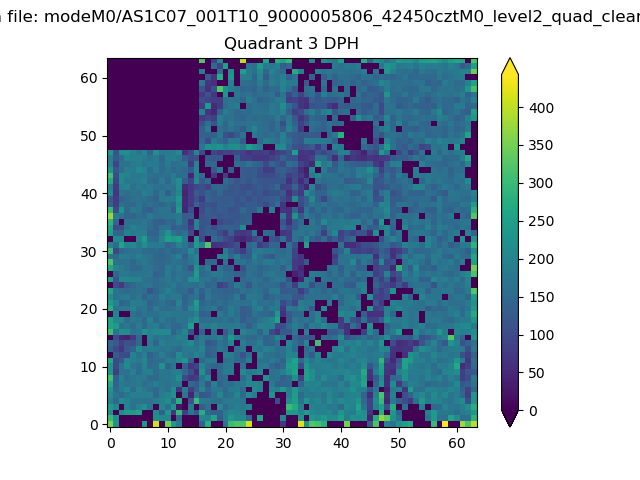 |
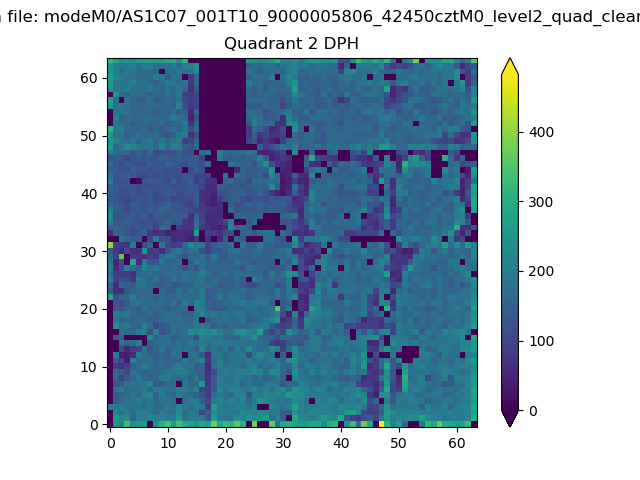 |
Quadrant C |
| Plot type | Count rate plots | Images |
|---|---|---|
| Comparison with Poisson distribution Blue bars denote a histogram of data divided into 1 sec bins. Red curve is a Poisson curve with rate = median count rate of data. |
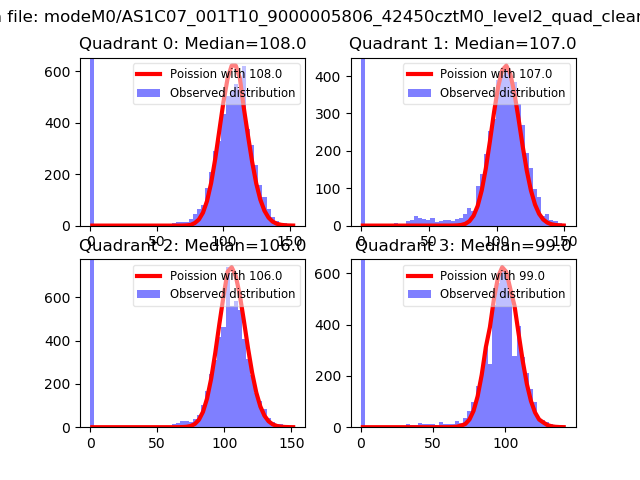 |
 |
| Quadrant-wise count rates Data is divided into 100 sec bins |
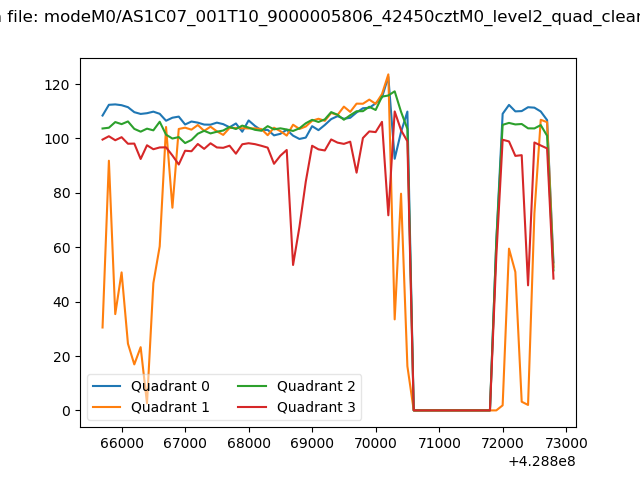 |
|
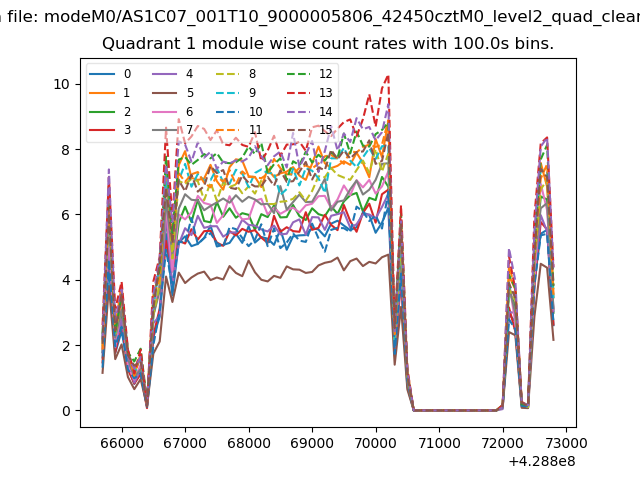
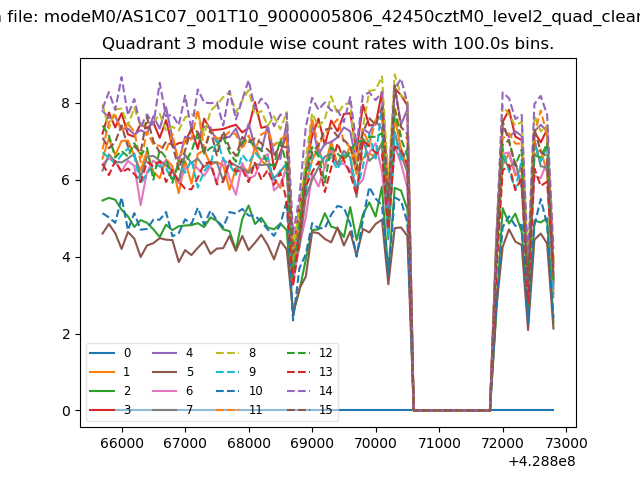
| Module-wise count rates for Quadrant A Data is divided into 100 sec bins |
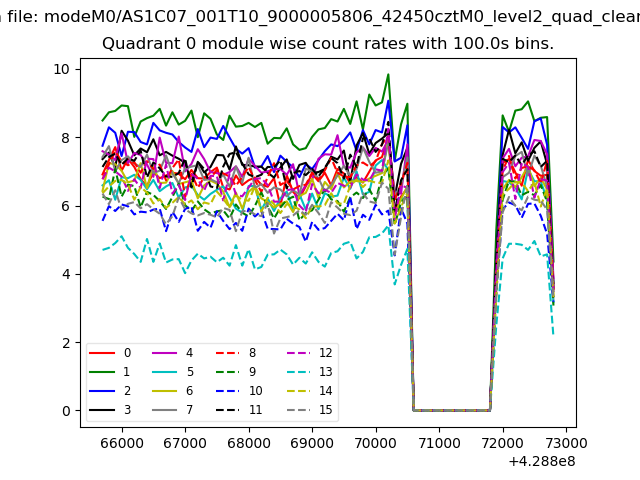 |
 |
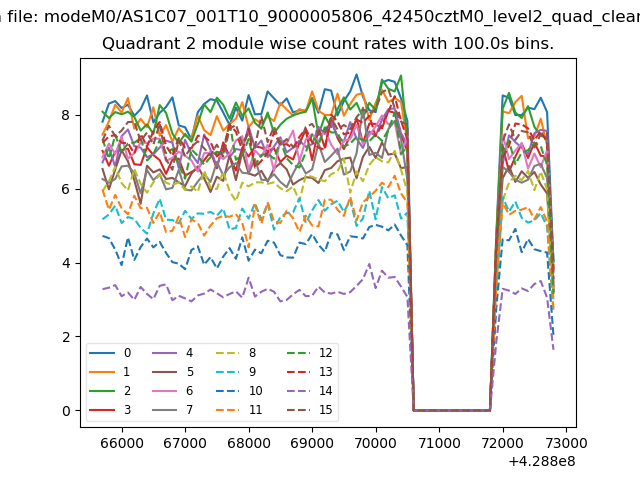
| Module-wise count rates for Quadrant B Data is divided into 100 sec bins |
 |
 |
| Module-wise count rates for Quadrant C Data is divided into 100 sec bins |
 |
 |
| Module-wise count rates for Quadrant D Data is divided into 100 sec bins |
 |
 |
| Parameter | Plot |
|---|---|
| CZT HV Monitor | 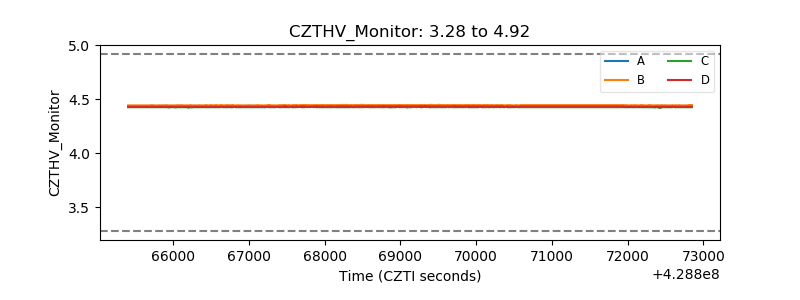 |
| D_VDD | 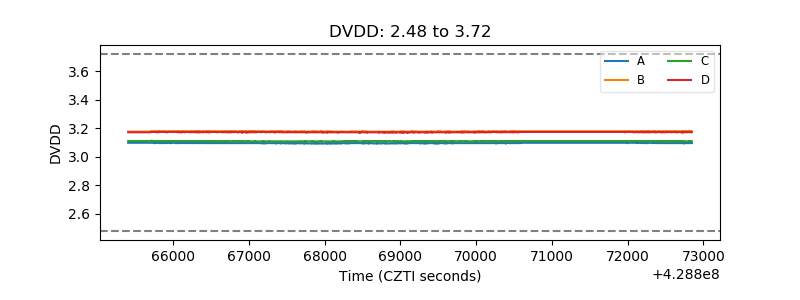 |
| Temperature 1 | 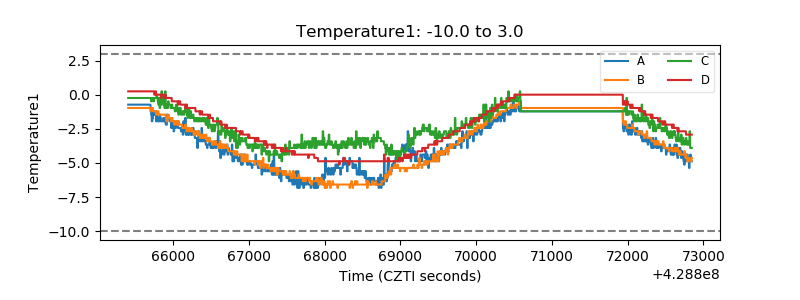 |
| Veto HV Monitor | 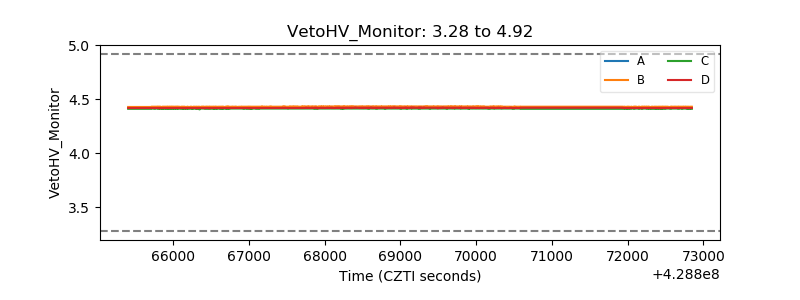 |
| Veto LLD | 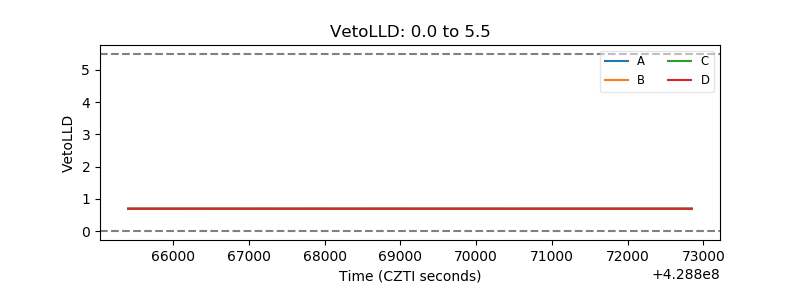 |
| Alpha Counter | 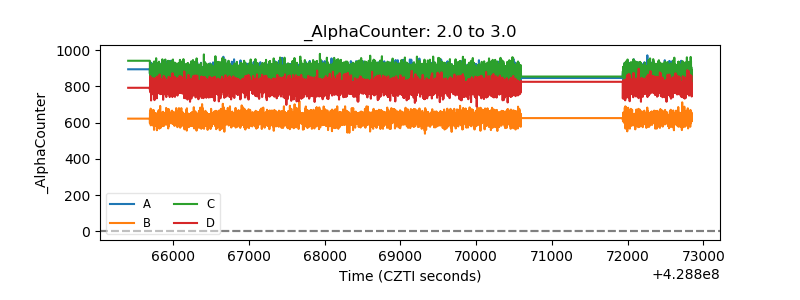 |
| _CPM_Rate | 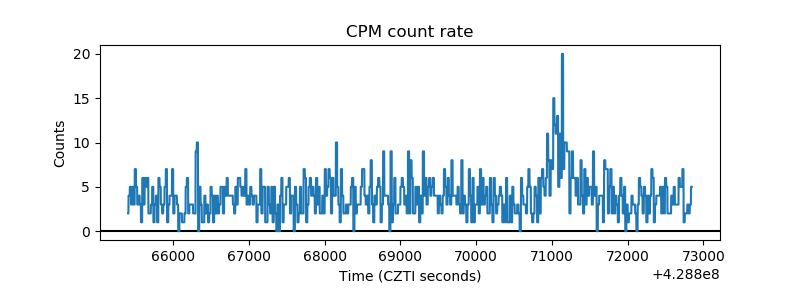 |
| CZT Counter | 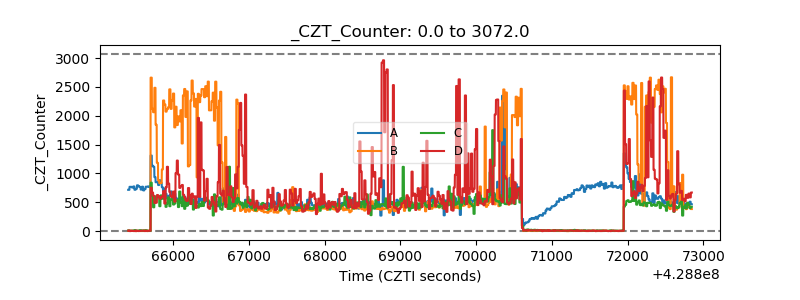 |
| +2.5 Volts monitor | 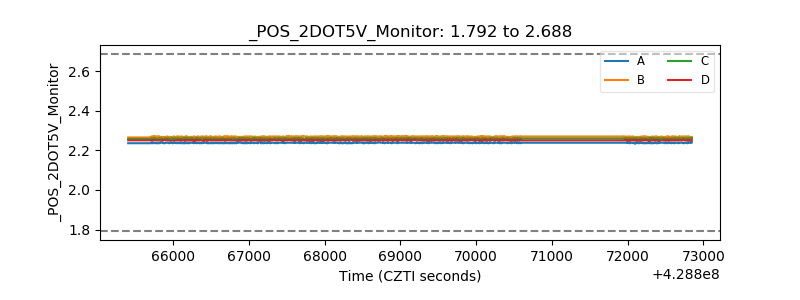 |
| +5 Volts monitor | 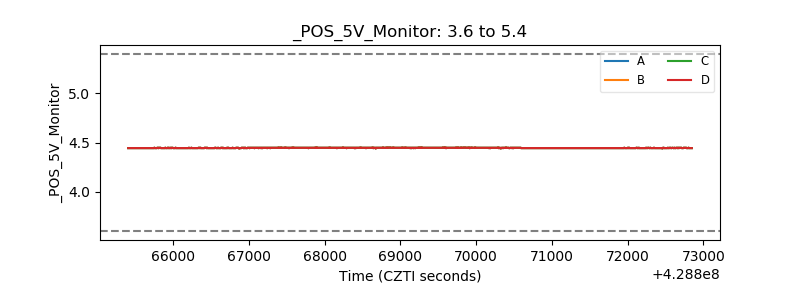 |
| _ROLL_ROT |  |
| _Roll_DEC | 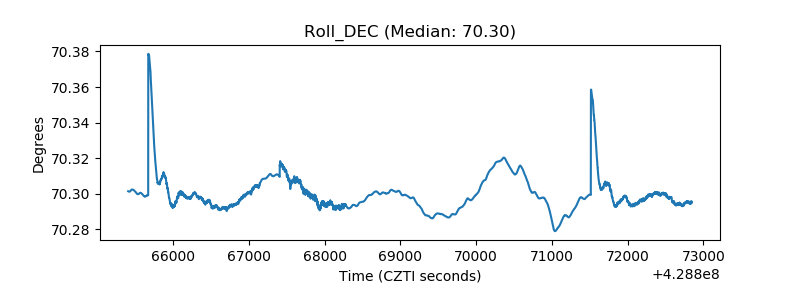 |
| _Roll_RA | 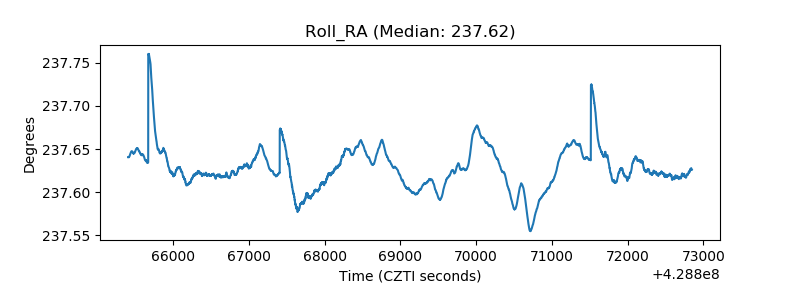 |
| Veto Counter | 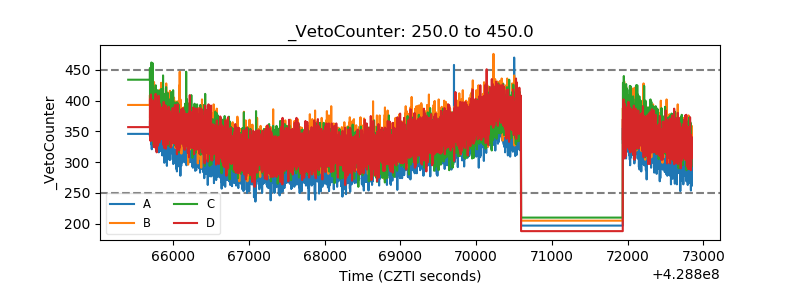 |