| Param | Original file | Final file |
|---|---|---|
| Filename | modeM0/AS1C07_001T10_9000005806_42451cztM0_level2.fits | modeM0/AS1C07_001T10_9000005806_42451cztM0_level2_quad_clean.evt |
| Size (bytes) | 450,849,600 | 88,237,440 |
| Size | 430.0 MB | 84.1 MB |
| Events in quadrant A | 3,180,263 | 627,619 |
| Events in quadrant B | 4,936,440 | 504,640 |
| Events in quadrant C | 2,904,874 | 614,651 |
| Events in quadrant D | 5,210,509 | 514,378 |
| Mode M9 | |||
|---|---|---|---|
| Quadrant | BADHDUFLAG | Total packets | Discarded packets |
| A | 0 | 17 | 0 |
| B | 0 | 18 | 0 |
| C | 0 | 18 | 0 |
| D | 0 | 18 | 0 |
| Mode SS | |||
|---|---|---|---|
| Quadrant | BADHDUFLAG | Total packets | Discarded packets |
| A | 0 | 120 | 0 |
| B | 0 | 120 | 0 |
| C | 0 | 120 | 0 |
| D | 0 | 120 | 0 |
| Mode M0 | |||
|---|---|---|---|
| Quadrant | BADHDUFLAG | Total packets | Discarded packets |
| A | 0 | 13219 | 3 |
| B | 0 | 19146 | 2 |
| C | 0 | 12690 | 2 |
| D | 0 | 19643 | 2 |
| Quadrant | Total seconds | Saturated seconds | Saturation percentage |
|---|---|---|---|
| A | 5870 | 20 | 0.340716% |
| B | 5870 | 1189 | 20.255537% |
| C | 5870 | 33 | 0.562181% |
| D | 5870 | 728 | 12.402044% |
Noise dominated data is calculated using 1-second bins in cleaned event files. If a bin has >2000 counts, and if more than 50% of those come from <1% of pixels, then it is considered to be noise-dominated and hence unusable.
| Quadrant | # 1 sec bins | Bins with >0 counts | Bins with >2000 counts | High rate bins dominated by noise | Noise dominated (total time) | Noise dominated (detector-on time) | Marked lightcurve |
|---|---|---|---|---|---|---|---|
| A | 7153 | 5871 | 9 | 9 | 0.13% | 0.15% | 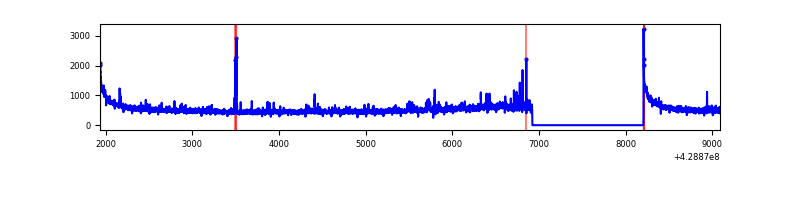 |
| B | 7153 | 5871 | 881 | 881 | 12.32% | 15.01% | 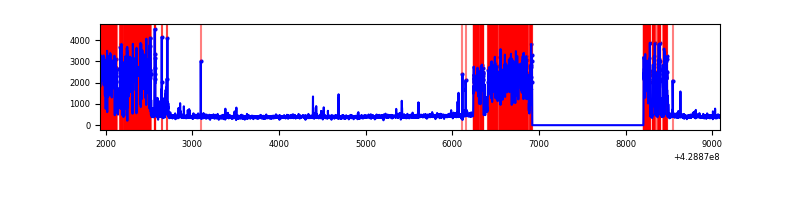 |
| C | 7153 | 5871 | 22 | 22 | 0.31% | 0.37% | 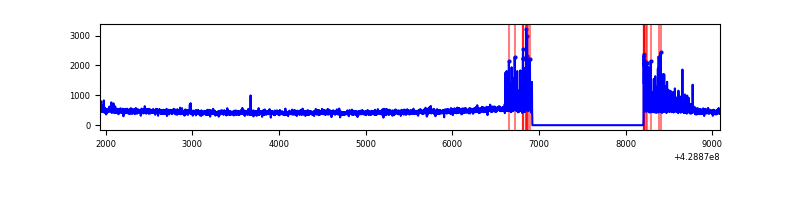 |
| D | 7153 | 5871 | 655 | 655 | 9.16% | 11.16% | 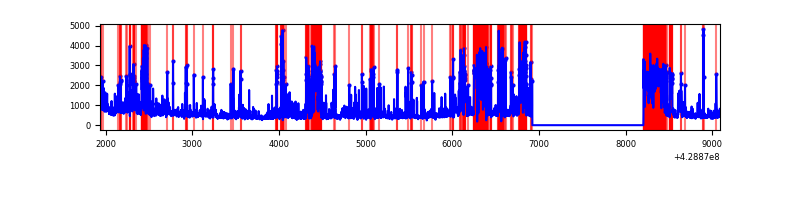 |
Top three noisy pixels from each quadrant. If the there are fewer than three noisy pixels in the level2.evt file, extra rows are filled as -1
| Pixel properties | Quadrant properties | ||||||
|---|---|---|---|---|---|---|---|
| Quadrant | DetID | PixID | Counts | Sigma | Mean | Median | Sigma |
| A | 10 | 83 | 627137 | 4971.31 | 615 | 602 | 126.0 |
| A | 12 | 189 | 103618 | 817.39 | 615 | 602 | 126.0 |
| A | 13 | 248 | 44039 | 344.66 | 615 | 602 | 126.0 |
| B | 0 | 186 | 2583850 | 23952.06 | 549 | 533 | 107.9 |
| B | 5 | 255 | 62215 | 571.9 | 549 | 533 | 107.9 |
| B | 3 | 112 | 44456 | 407.25 | 549 | 533 | 107.9 |
| C | 10 | 34 | 244889 | 1722.65 | 603 | 607 | 141.8 |
| C | 15 | 214 | 243294 | 1711.4 | 603 | 607 | 141.8 |
| C | 14 | 254 | 40512 | 281.41 | 603 | 607 | 141.8 |
| D | 1 | 52 | 1248874 | 8867.53 | 578 | 561 | 140.8 |
| D | 13 | 249 | 670958 | 4762.24 | 578 | 561 | 140.8 |
| D | 2 | 16 | 329441 | 2336.24 | 578 | 561 | 140.8 |
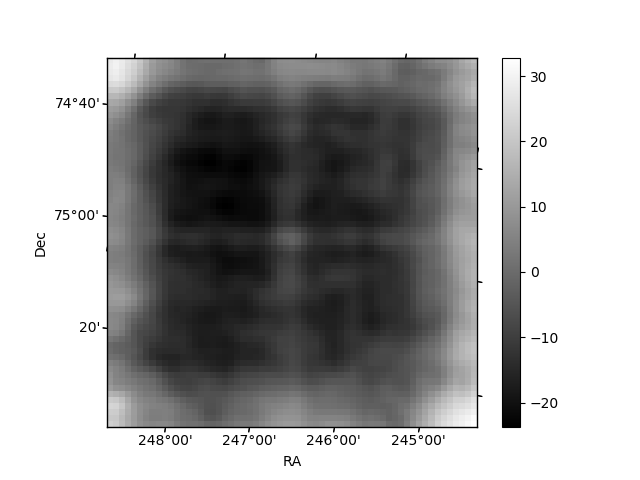
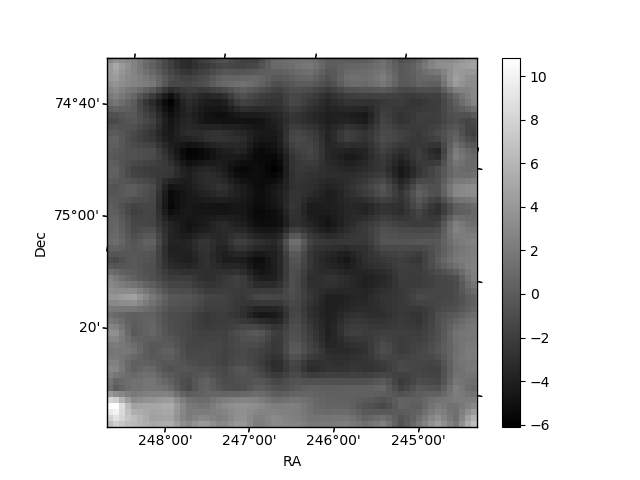
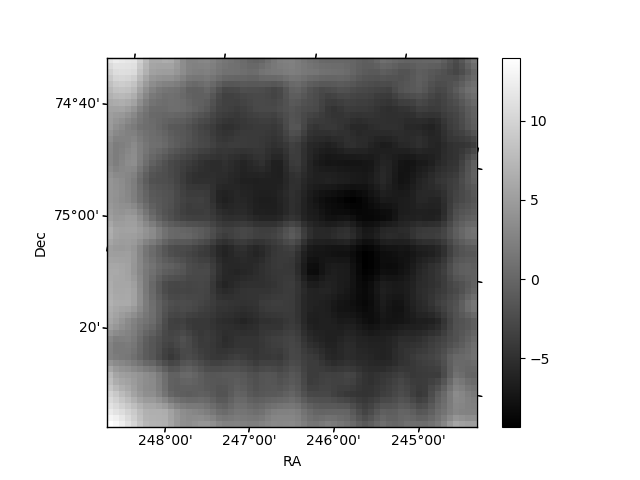
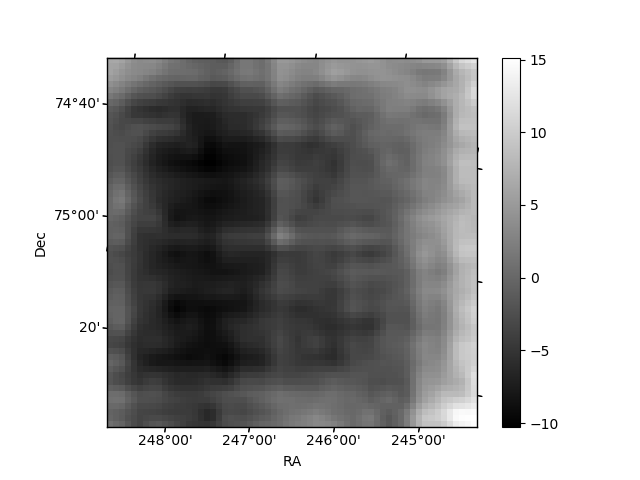
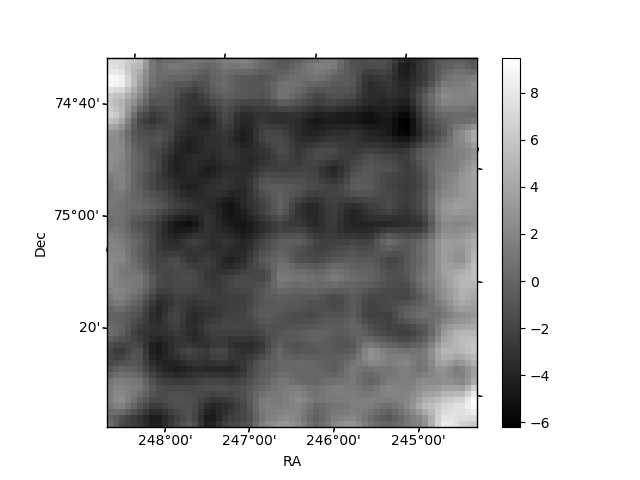
Histogram calculated using DETX and DETY for each event in the final _common_clean file
| Quadrant A | 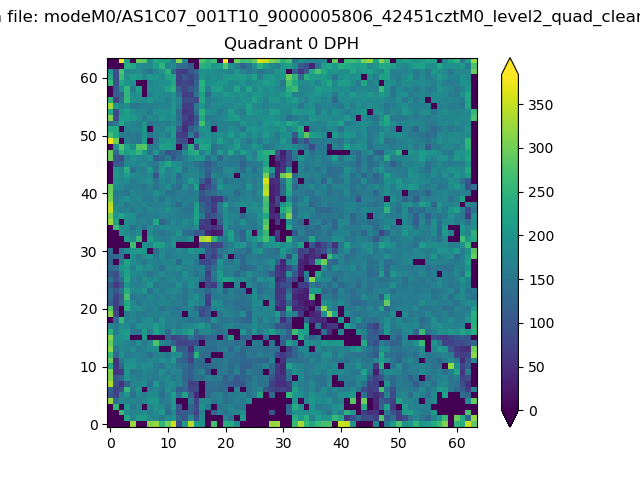 |
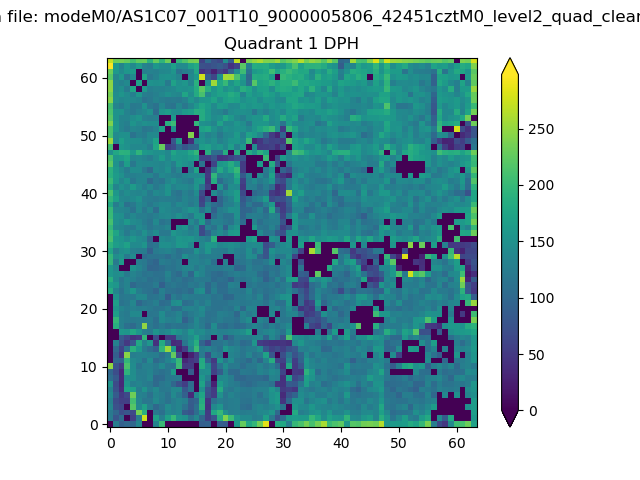 |
Quadrant B |
|---|---|---|---|
| Quadrant D | 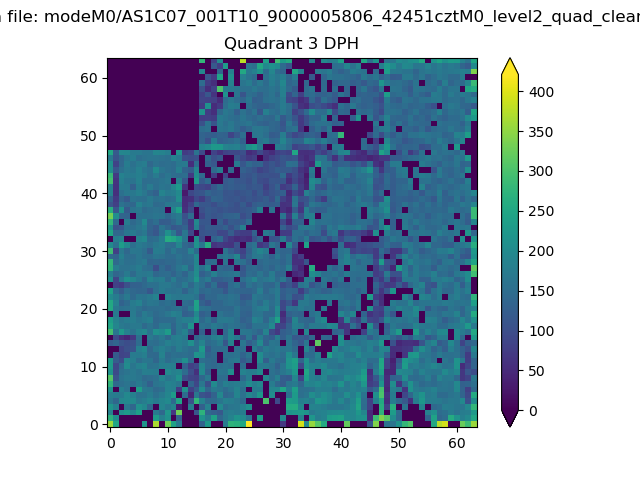 |
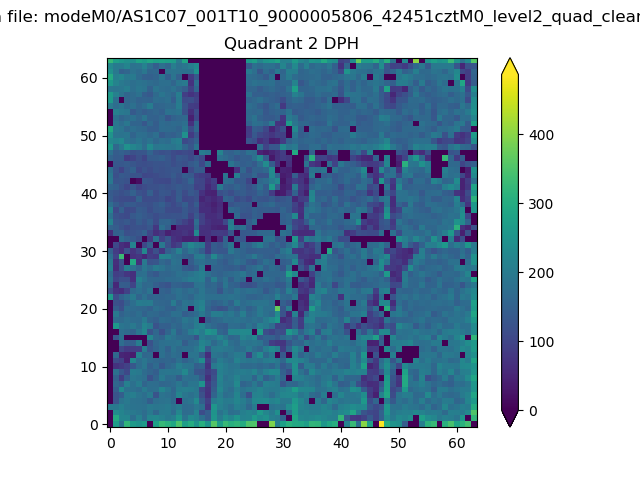 |
Quadrant C |
| Plot type | Count rate plots | Images |
|---|---|---|
| Comparison with Poisson distribution Blue bars denote a histogram of data divided into 1 sec bins. Red curve is a Poisson curve with rate = median count rate of data. |
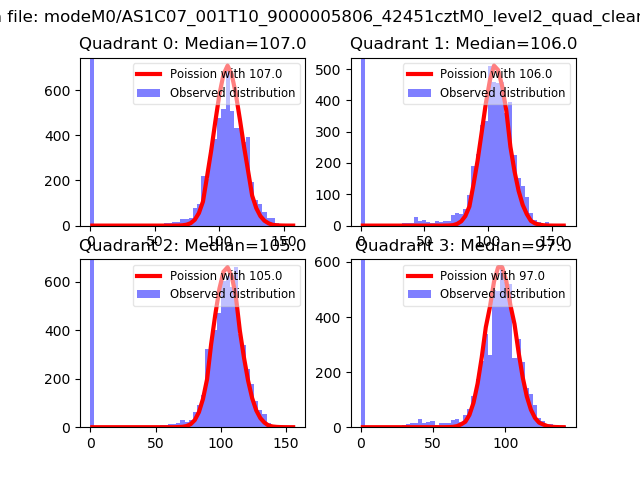 |
 |
| Quadrant-wise count rates Data is divided into 100 sec bins |
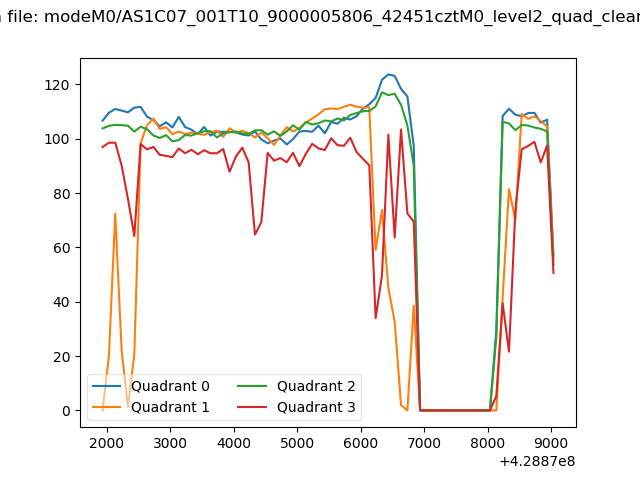 |
|
| Module-wise count rates for Quadrant A Data is divided into 100 sec bins |
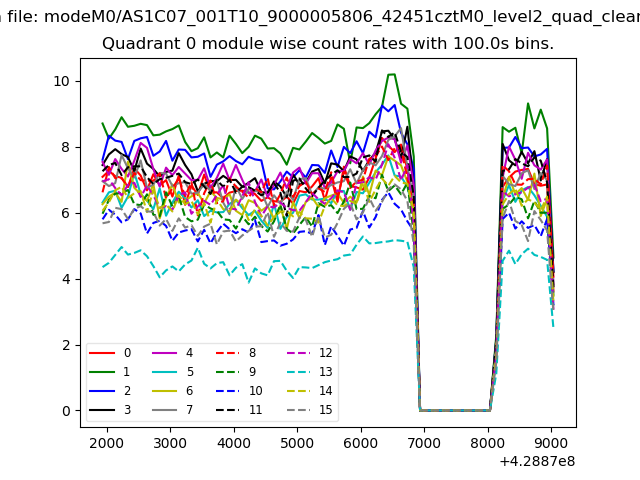 |
 |
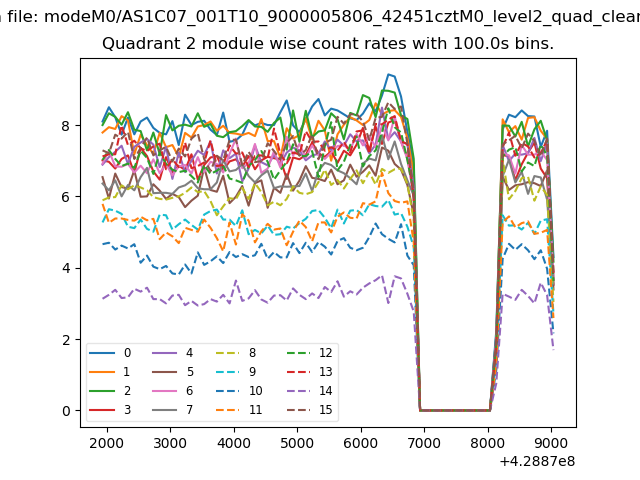
| Module-wise count rates for Quadrant B Data is divided into 100 sec bins |
 |
 |
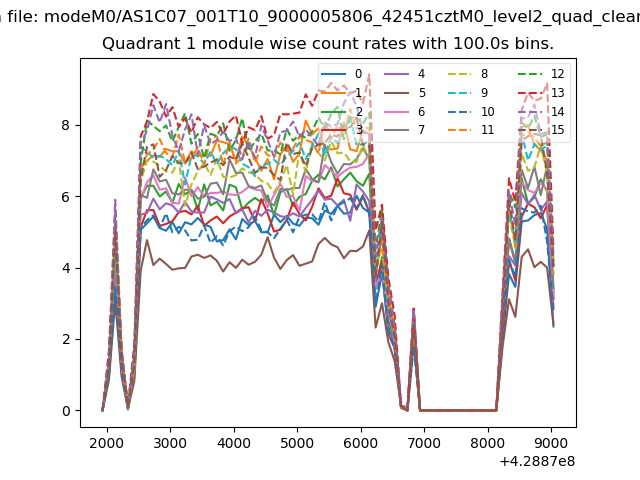
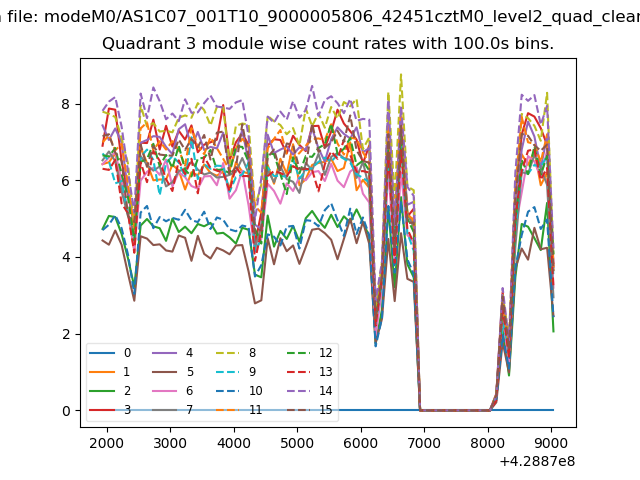
| Module-wise count rates for Quadrant C Data is divided into 100 sec bins |
 |
 |
| Module-wise count rates for Quadrant D Data is divided into 100 sec bins |
 |
 |
| Parameter | Plot |
|---|---|
| CZT HV Monitor | 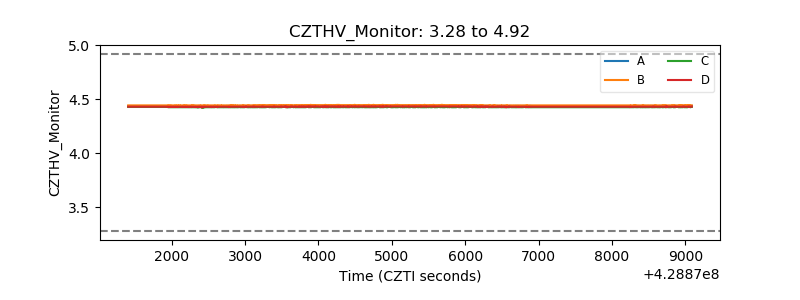 |
| D_VDD | 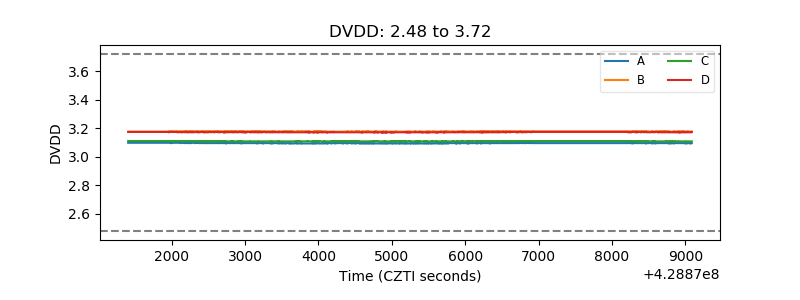 |
| Temperature 1 | 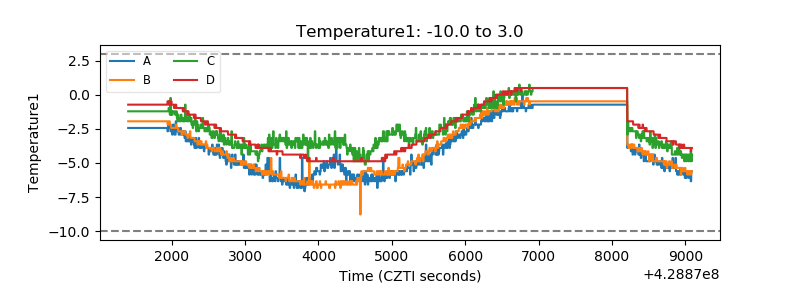 |
| Veto HV Monitor |  |
| Veto LLD | 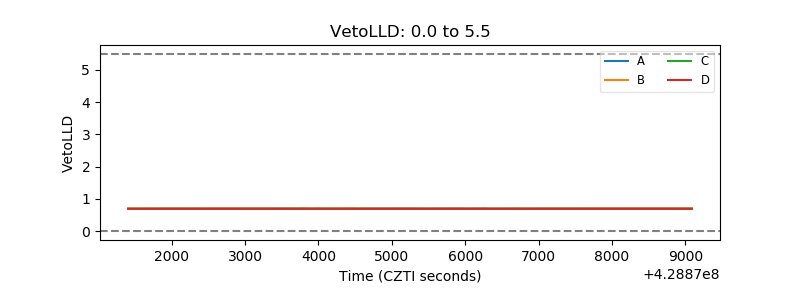 |
| Alpha Counter | 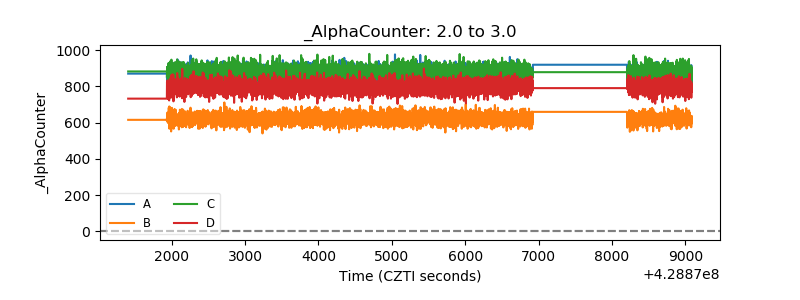 |
| _CPM_Rate | 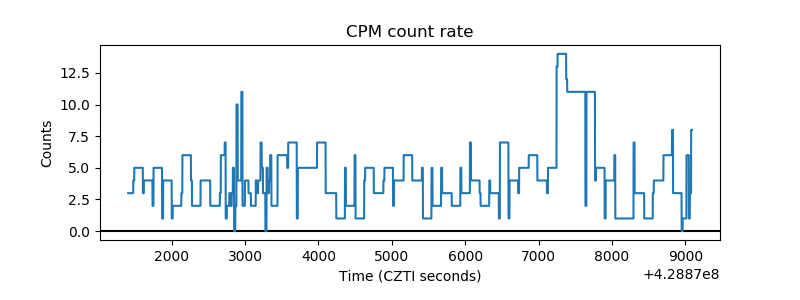 |
| CZT Counter | 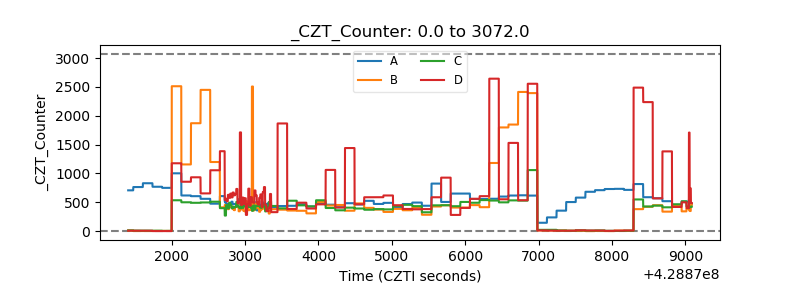 |
| +2.5 Volts monitor | 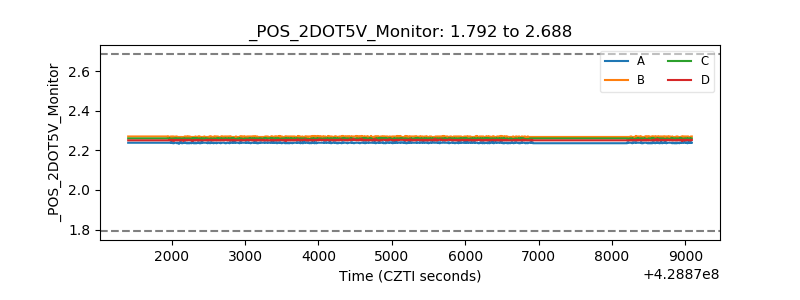 |
| +5 Volts monitor |  |
| _ROLL_ROT | 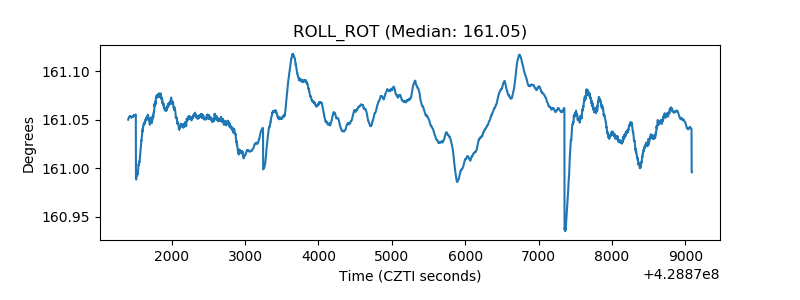 |
| _Roll_DEC | 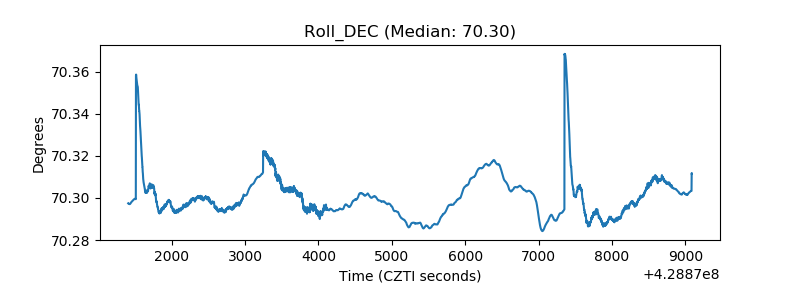 |
| _Roll_RA | 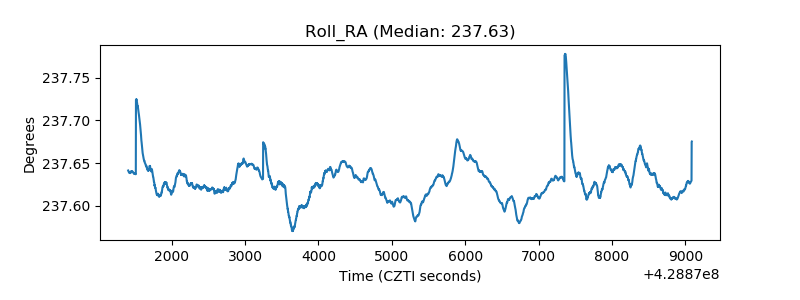 |
| Veto Counter | 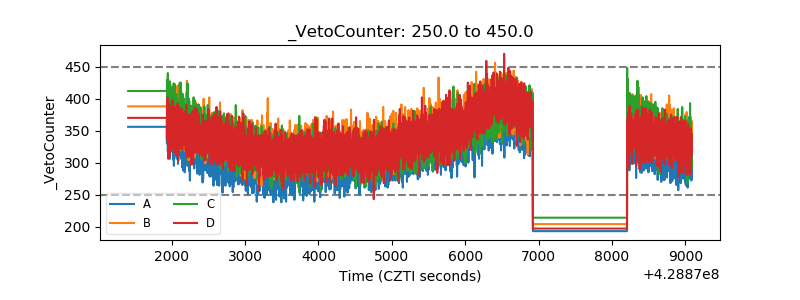 |