| Param | Original file | Final file |
|---|---|---|
| Filename | modeM0/AS1C07_001T10_9000005806_42454cztM0_level2.fits | modeM0/AS1C07_001T10_9000005806_42454cztM0_level2_quad_clean.evt |
| Size (bytes) | 1,185,713,280 | 226,416,960 |
| Size | 1.1 GB | 215.9 MB |
| Events in quadrant A | 8,155,391 | 1,609,456 |
| Events in quadrant B | 12,950,442 | 1,277,499 |
| Events in quadrant C | 7,761,914 | 1,587,975 |
| Events in quadrant D | 13,832,027 | 1,318,032 |
| Mode M9 | |||
|---|---|---|---|
| Quadrant | BADHDUFLAG | Total packets | Discarded packets |
| A | 0 | 50 | 0 |
| B | 0 | 51 | 0 |
| C | 0 | 51 | 0 |
| D | 0 | 51 | 0 |
| Mode SS | |||
|---|---|---|---|
| Quadrant | BADHDUFLAG | Total packets | Discarded packets |
| A | 0 | 316 | 0 |
| B | 0 | 316 | 0 |
| C | 0 | 316 | 0 |
| D | 0 | 316 | 0 |
| Mode M0 | |||
|---|---|---|---|
| Quadrant | BADHDUFLAG | Total packets | Discarded packets |
| A | 0 | 34127 | 4 |
| B | 0 | 50364 | 4 |
| C | 0 | 33432 | 5 |
| D | 0 | 51965 | 4 |
| Quadrant | Total seconds | Saturated seconds | Saturation percentage |
|---|---|---|---|
| A | 15381 | 71 | 0.461608% |
| B | 15381 | 3233 | 21.019440% |
| C | 15380 | 71 | 0.461638% |
| D | 15380 | 1967 | 12.789337% |
Noise dominated data is calculated using 1-second bins in cleaned event files. If a bin has >2000 counts, and if more than 50% of those come from <1% of pixels, then it is considered to be noise-dominated and hence unusable.
| Quadrant | # 1 sec bins | Bins with >0 counts | Bins with >2000 counts | High rate bins dominated by noise | Noise dominated (total time) | Noise dominated (detector-on time) | Marked lightcurve |
|---|---|---|---|---|---|---|---|
| A | 19711 | 15384 | 35 | 35 | 0.18% | 0.23% | 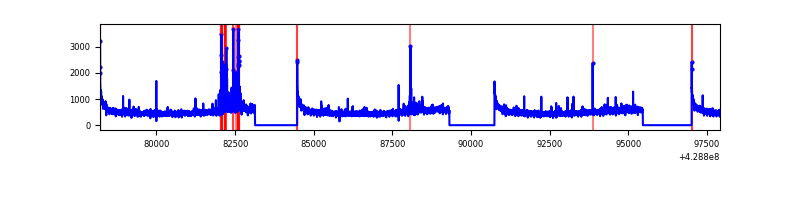 |
| B | 19711 | 15382 | 2579 | 2579 | 13.08% | 16.77% | 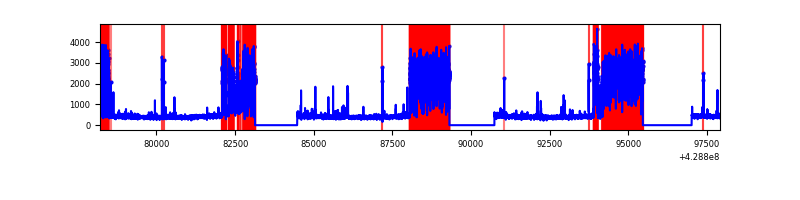 |
| C | 19710 | 15383 | 65 | 65 | 0.33% | 0.42% | 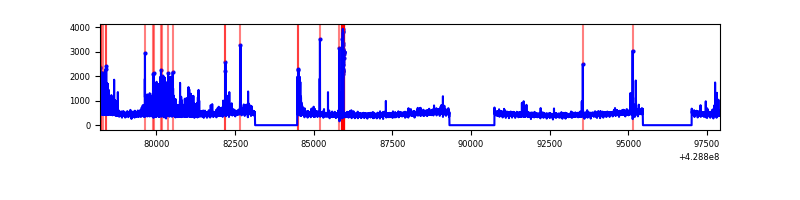 |
| D | 19710 | 15383 | 1885 | 1885 | 9.56% | 12.25% | 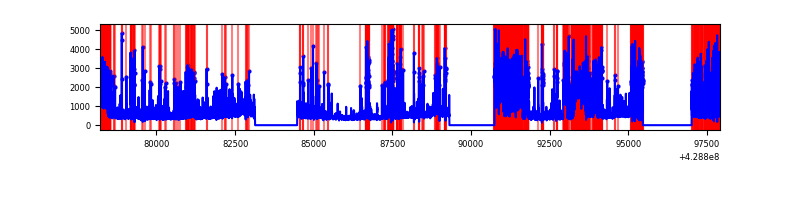 |
Top three noisy pixels from each quadrant. If the there are fewer than three noisy pixels in the level2.evt file, extra rows are filled as -1
| Pixel properties | Quadrant properties | ||||||
|---|---|---|---|---|---|---|---|
| Quadrant | DetID | PixID | Counts | Sigma | Mean | Median | Sigma |
| A | 10 | 83 | 1477834 | 4396.43 | 1634 | 1598 | 335.8 |
| A | 14 | 223 | 194152 | 573.45 | 1634 | 1598 | 335.8 |
| A | 12 | 189 | 83165 | 242.92 | 1634 | 1598 | 335.8 |
| B | 0 | 186 | 7089213 | 26313.98 | 1402 | 1361 | 269.4 |
| B | 3 | 112 | 102071 | 373.89 | 1402 | 1361 | 269.4 |
| B | 5 | 172 | 89660 | 327.81 | 1402 | 1361 | 269.4 |
| C | 10 | 34 | 676046 | 1824.36 | 1590 | 1599 | 369.7 |
| C | 15 | 214 | 631570 | 1704.05 | 1590 | 1599 | 369.7 |
| C | 15 | 111 | 150447 | 402.63 | 1590 | 1599 | 369.7 |
| D | 1 | 52 | 4372865 | 11731.29 | 1532 | 1492 | 372.6 |
| D | 13 | 249 | 828604 | 2219.69 | 1532 | 1492 | 372.6 |
| D | 2 | 16 | 672519 | 1800.81 | 1532 | 1492 | 372.6 |
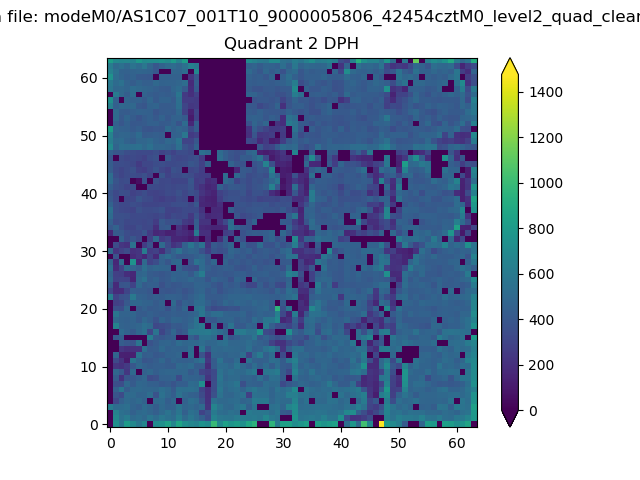
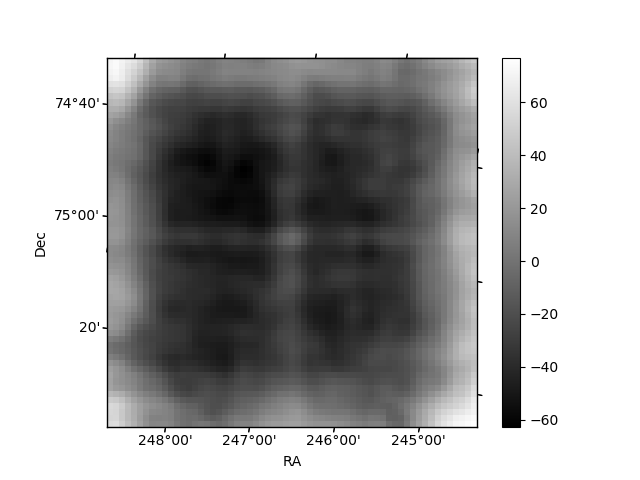
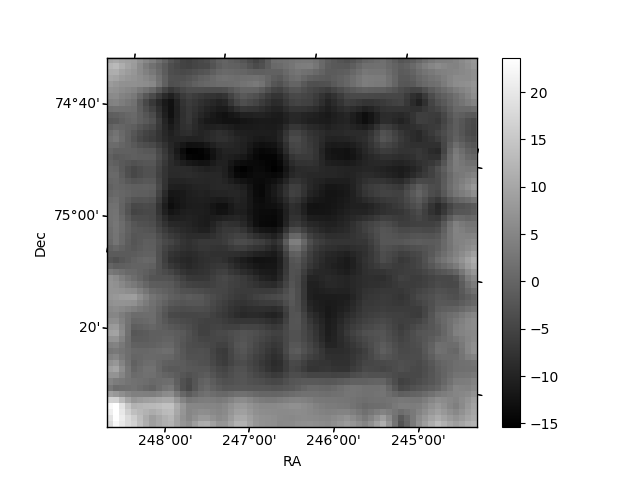
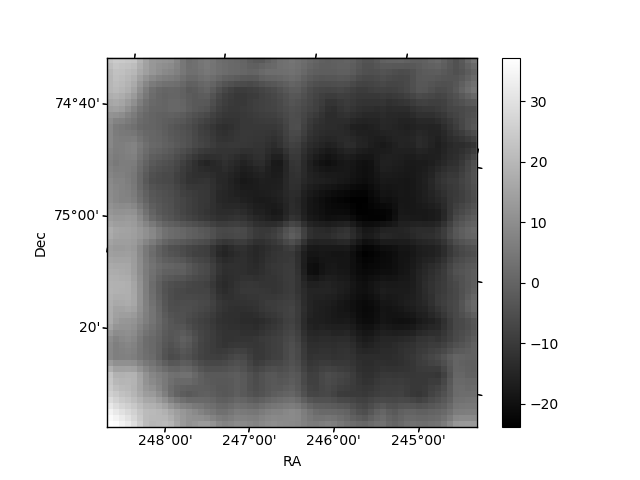
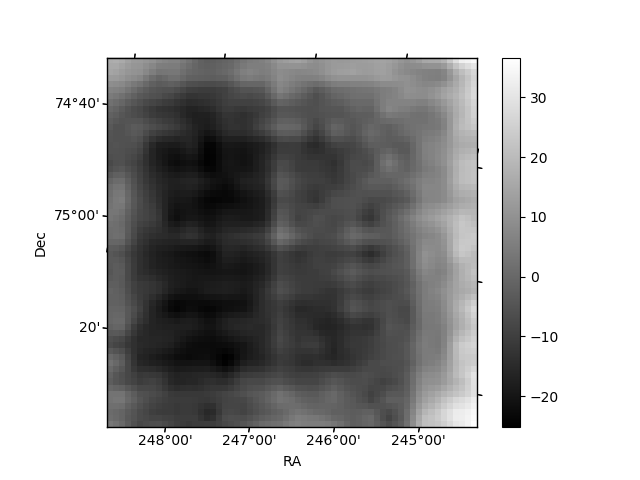
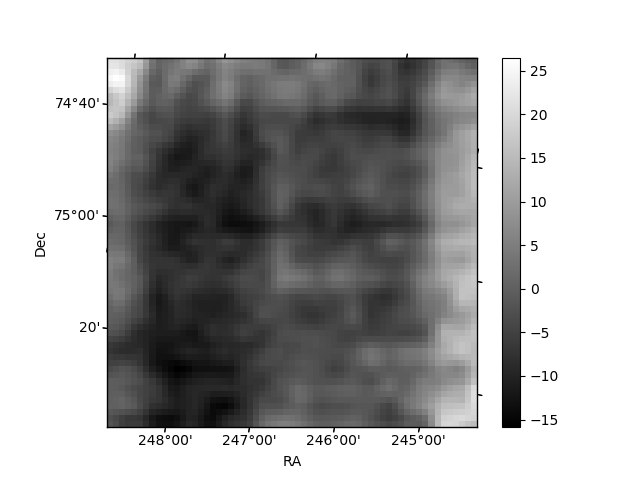
Histogram calculated using DETX and DETY for each event in the final _common_clean file
| Quadrant A | 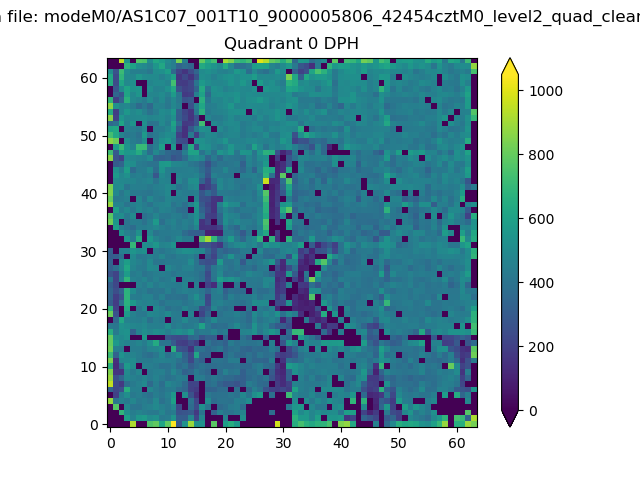 |
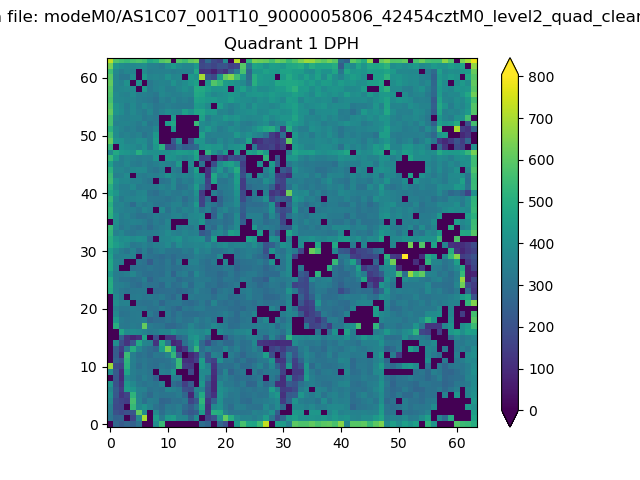 |
Quadrant B |
|---|---|---|---|
| Quadrant D | 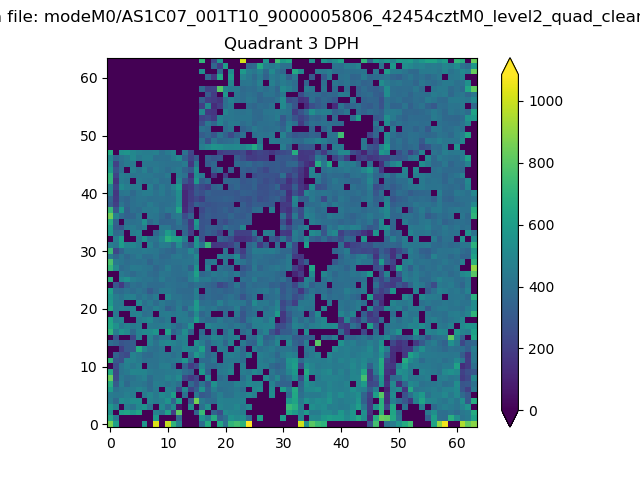 |
 |
Quadrant C |
| Plot type | Count rate plots | Images |
|---|---|---|
| Comparison with Poisson distribution Blue bars denote a histogram of data divided into 1 sec bins. Red curve is a Poisson curve with rate = median count rate of data. |
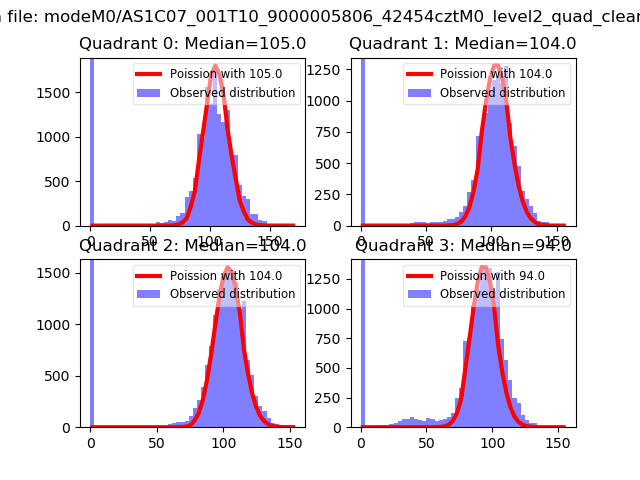 |
 |
| Quadrant-wise count rates Data is divided into 100 sec bins |
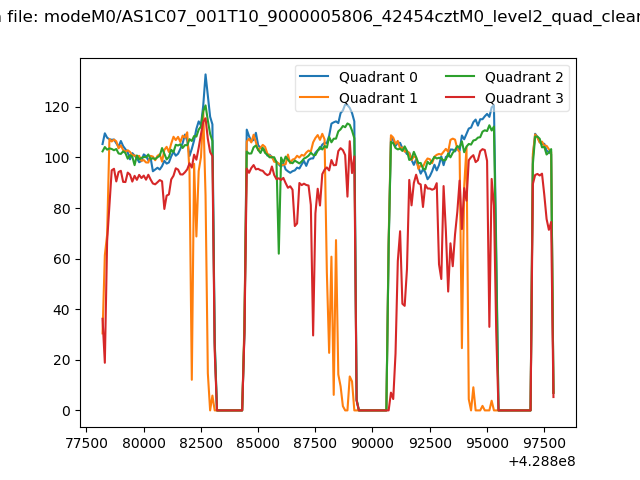 |
|
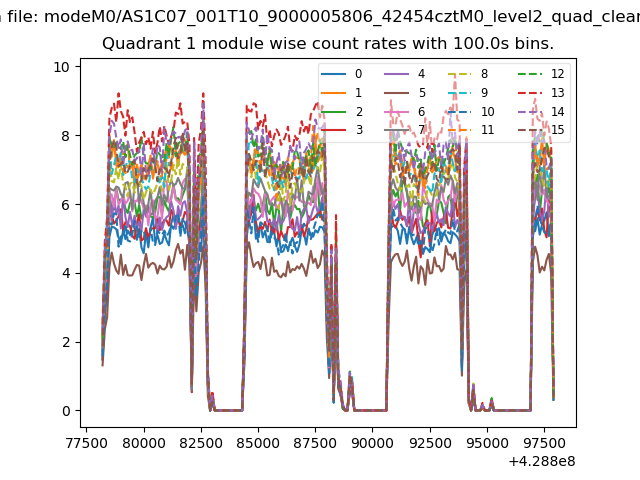
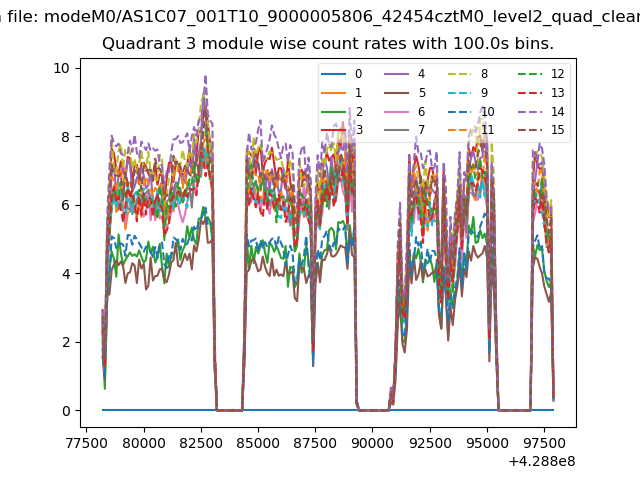
| Module-wise count rates for Quadrant A Data is divided into 100 sec bins |
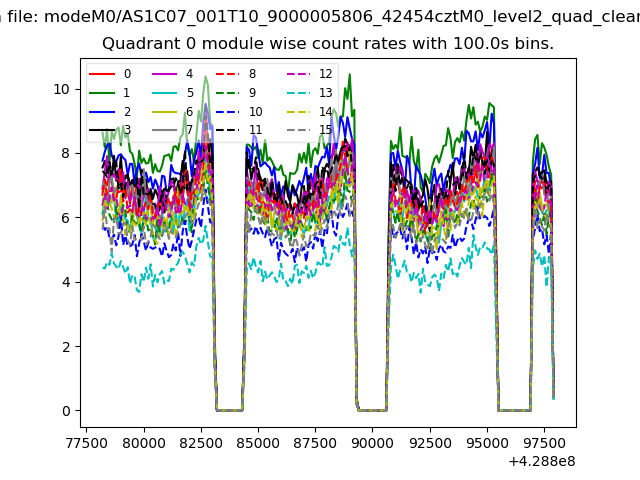 |
 |
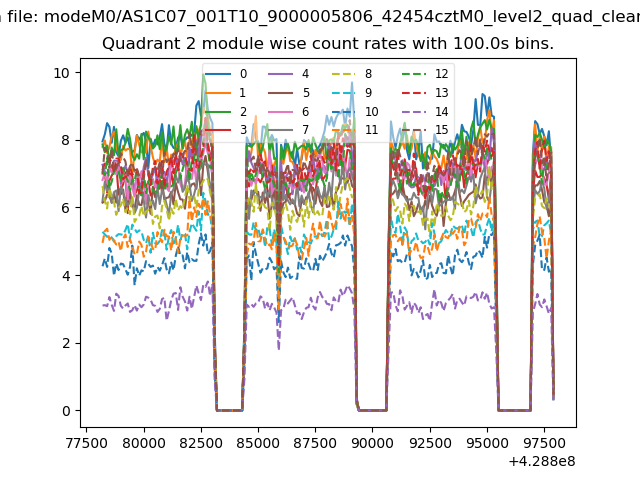
| Module-wise count rates for Quadrant B Data is divided into 100 sec bins |
 |
 |
| Module-wise count rates for Quadrant C Data is divided into 100 sec bins |
 |
 |
| Module-wise count rates for Quadrant D Data is divided into 100 sec bins |
 |
 |
| Parameter | Plot |
|---|---|
| CZT HV Monitor | 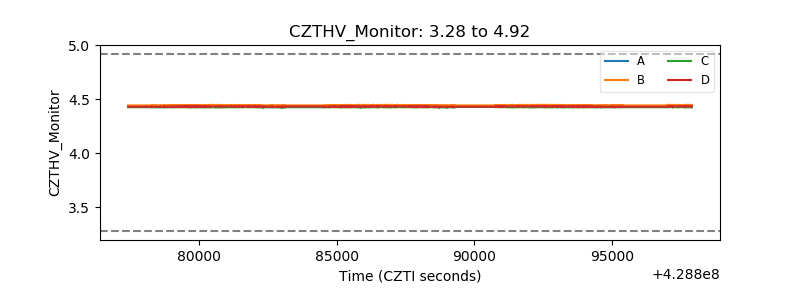 |
| D_VDD | 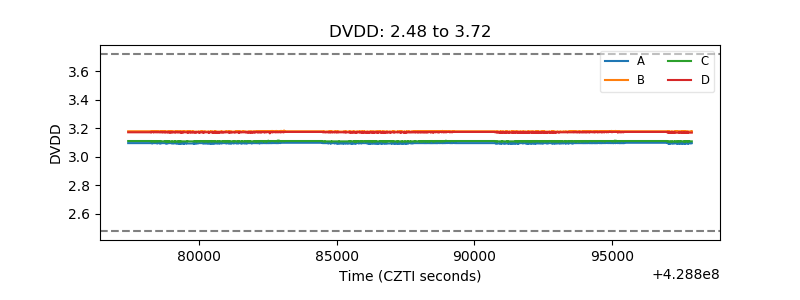 |
| Temperature 1 | 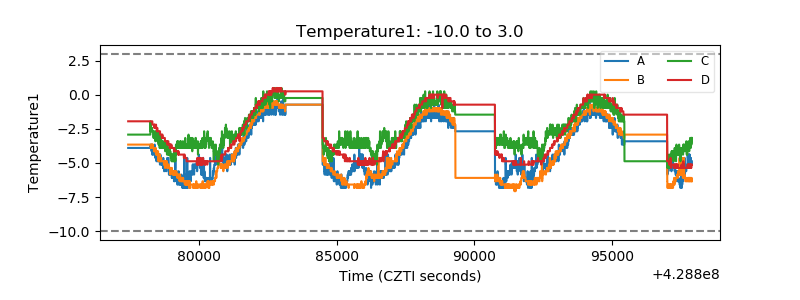 |
| Veto HV Monitor | 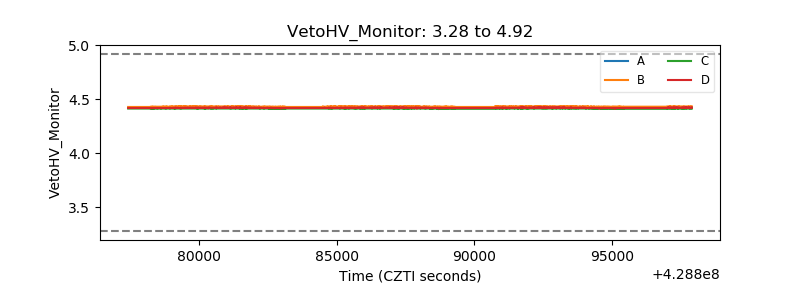 |
| Veto LLD | 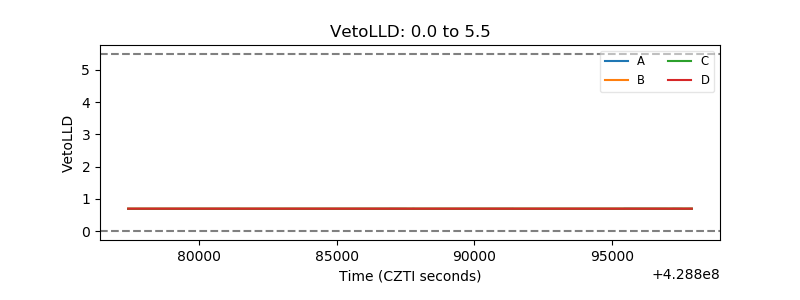 |
| Alpha Counter | 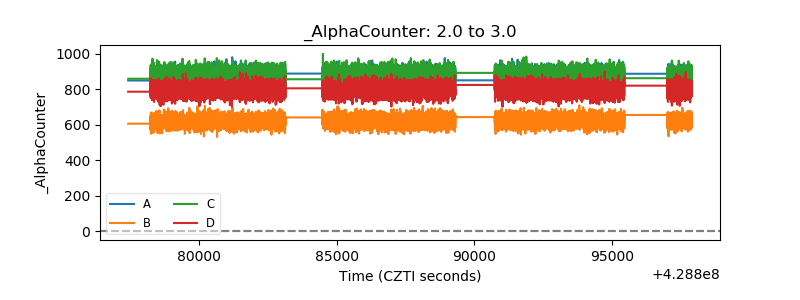 |
| _CPM_Rate | 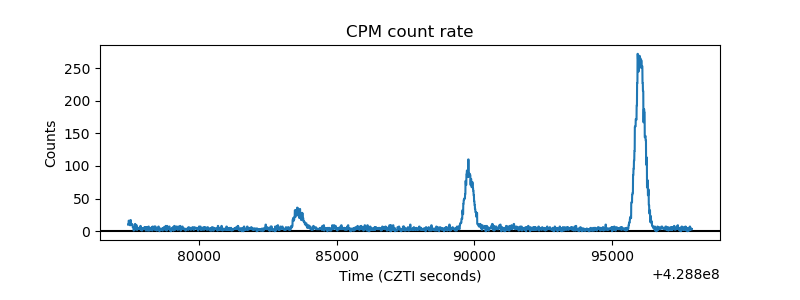 |
| CZT Counter | 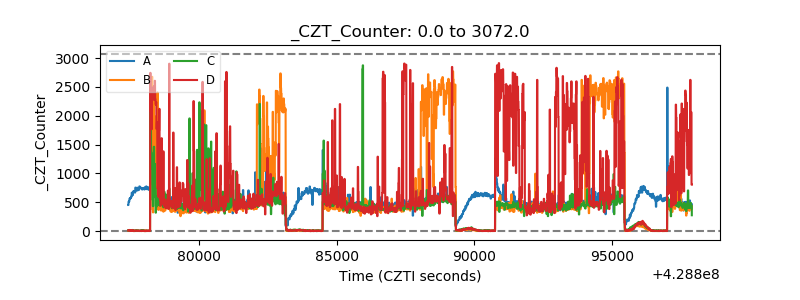 |
| +2.5 Volts monitor |  |
| +5 Volts monitor |  |
| _ROLL_ROT | 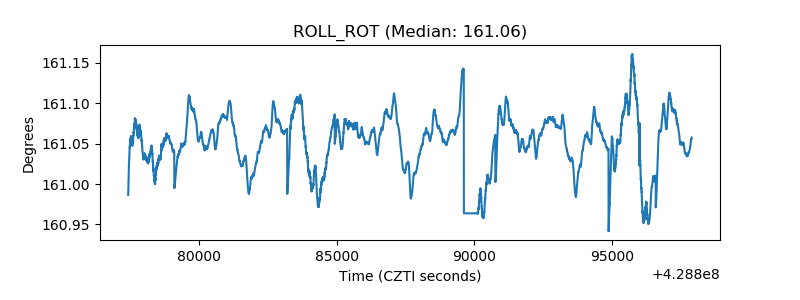 |
| _Roll_DEC | 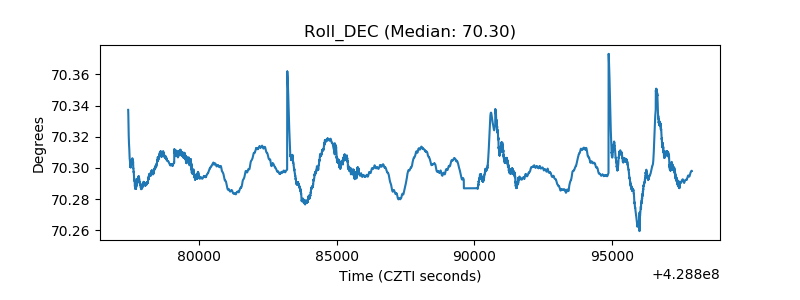 |
| _Roll_RA | 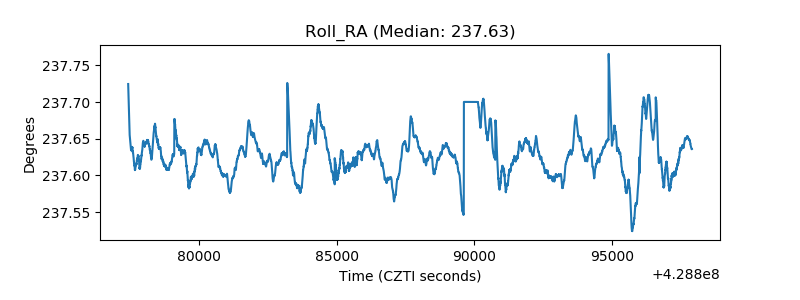 |
| Veto Counter | 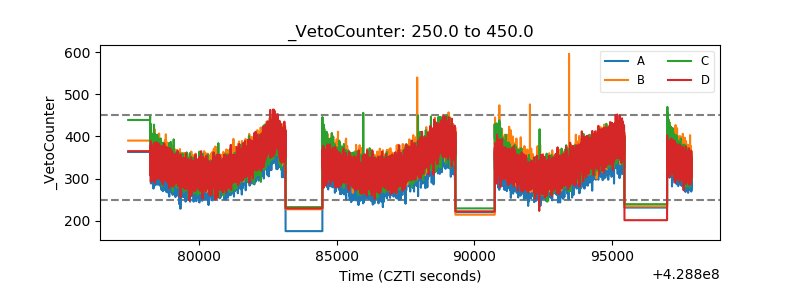 |