| Param | Original file | Final file |
|---|---|---|
| Filename | modeM0/AS1C07_001T10_9000005806_42457cztM0_level2.fits | modeM0/AS1C07_001T10_9000005806_42457cztM0_level2_quad_clean.evt |
| Size (bytes) | 403,067,520 | 81,538,560 |
| Size | 384.4 MB | 77.8 MB |
| Events in quadrant A | 2,862,017 | 594,271 |
| Events in quadrant B | 5,982,894 | 392,825 |
| Events in quadrant C | 2,509,166 | 575,970 |
| Events in quadrant D | 3,151,975 | 533,959 |
| Mode M9 | |||
|---|---|---|---|
| Quadrant | BADHDUFLAG | Total packets | Discarded packets |
| A | 0 | 22 | 0 |
| B | 0 | 23 | 0 |
| C | 0 | 23 | 0 |
| D | 0 | 23 | 0 |
| Mode SS | |||
|---|---|---|---|
| Quadrant | BADHDUFLAG | Total packets | Discarded packets |
| A | 0 | 108 | 0 |
| B | 0 | 108 | 0 |
| C | 0 | 108 | 0 |
| D | 0 | 108 | 0 |
| Mode M0 | |||
|---|---|---|---|
| Quadrant | BADHDUFLAG | Total packets | Discarded packets |
| A | 0 | 11666 | 2 |
| B | 0 | 21573 | 2 |
| C | 0 | 10979 | 2 |
| D | 0 | 13049 | 2 |
| Quadrant | Total seconds | Saturated seconds | Saturation percentage |
|---|---|---|---|
| A | 5311 | 12 | 0.225946% |
| B | 5311 | 1848 | 34.795707% |
| C | 5311 | 14 | 0.263604% |
| D | 5311 | 101 | 1.901713% |
Noise dominated data is calculated using 1-second bins in cleaned event files. If a bin has >2000 counts, and if more than 50% of those come from <1% of pixels, then it is considered to be noise-dominated and hence unusable.
| Quadrant | # 1 sec bins | Bins with >0 counts | Bins with >2000 counts | High rate bins dominated by noise | Noise dominated (total time) | Noise dominated (detector-on time) | Marked lightcurve |
|---|---|---|---|---|---|---|---|
| A | 7104 | 5312 | 2 | 2 | 0.03% | 0.04% | 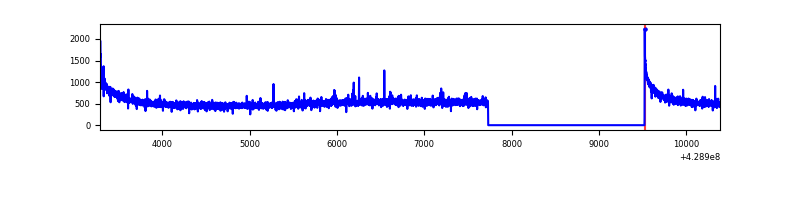 |
| B | 7104 | 5312 | 1656 | 1656 | 23.31% | 31.17% | 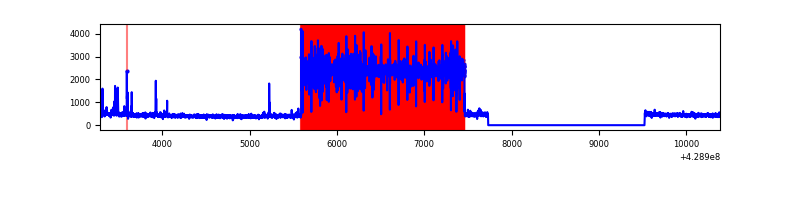 |
| C | 7104 | 5312 | 6 | 6 | 0.08% | 0.11% | 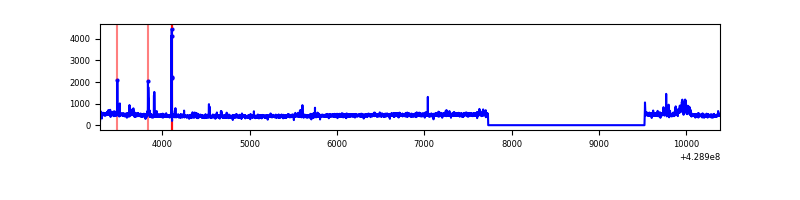 |
| D | 7104 | 5312 | 82 | 82 | 1.15% | 1.54% | 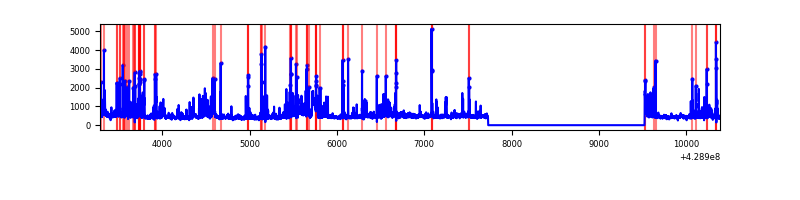 |
Top three noisy pixels from each quadrant. If the there are fewer than three noisy pixels in the level2.evt file, extra rows are filled as -1
| Pixel properties | Quadrant properties | ||||||
|---|---|---|---|---|---|---|---|
| Quadrant | DetID | PixID | Counts | Sigma | Mean | Median | Sigma |
| A | 10 | 83 | 568278 | 4817.48 | 577 | 565 | 117.8 |
| A | 12 | 189 | 28452 | 236.64 | 577 | 565 | 117.8 |
| A | 2 | 79 | 12374 | 100.21 | 577 | 565 | 117.8 |
| B | 0 | 186 | 4203469 | 49699.33 | 434 | 422 | 84.6 |
| B | 5 | 255 | 40816 | 477.64 | 434 | 422 | 84.6 |
| B | 5 | 172 | 16496 | 190.06 | 434 | 422 | 84.6 |
| C | 15 | 214 | 224318 | 1744.22 | 554 | 557 | 128.3 |
| C | 14 | 254 | 61096 | 471.9 | 554 | 557 | 128.3 |
| C | 3 | 233 | 60539 | 467.56 | 554 | 557 | 128.3 |
| D | 2 | 16 | 173701 | 1269.49 | 557 | 541 | 136.4 |
| D | 1 | 52 | 147272 | 1075.73 | 557 | 541 | 136.4 |
| D | 12 | 6 | 119103 | 869.22 | 557 | 541 | 136.4 |
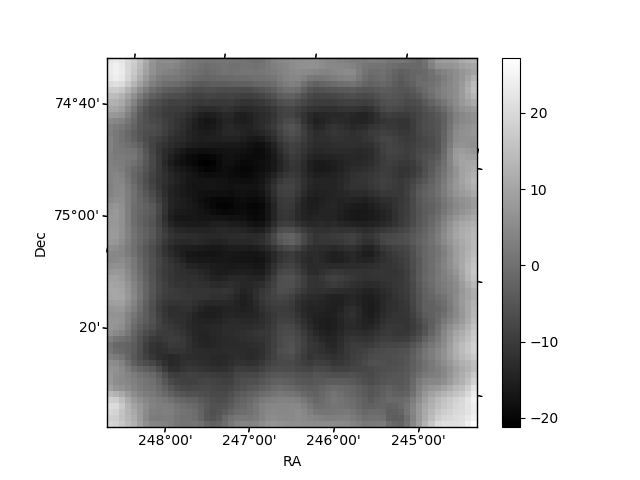
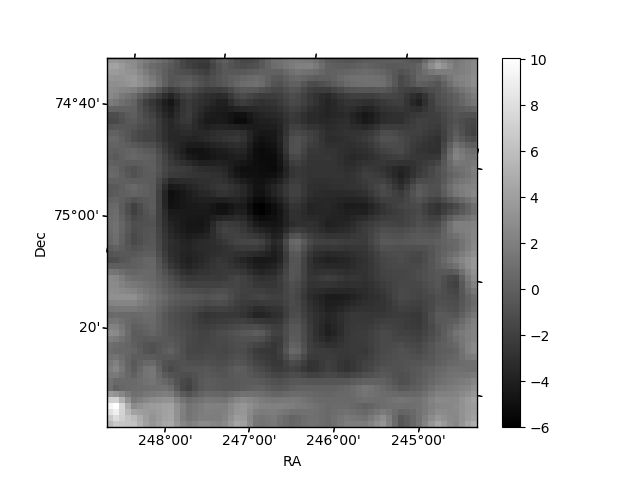
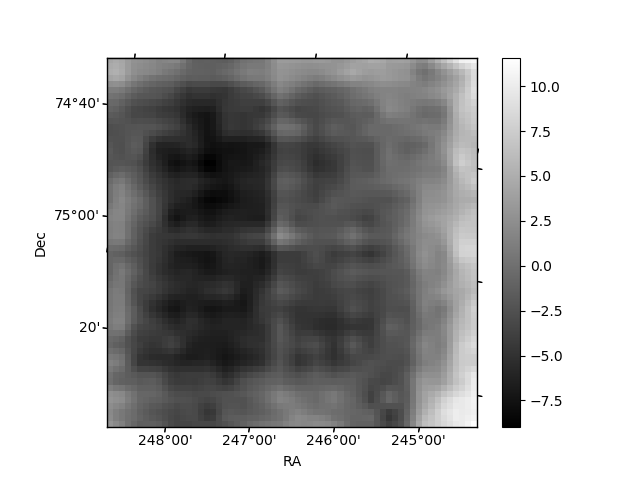
Histogram calculated using DETX and DETY for each event in the final _common_clean file
| Quadrant A | 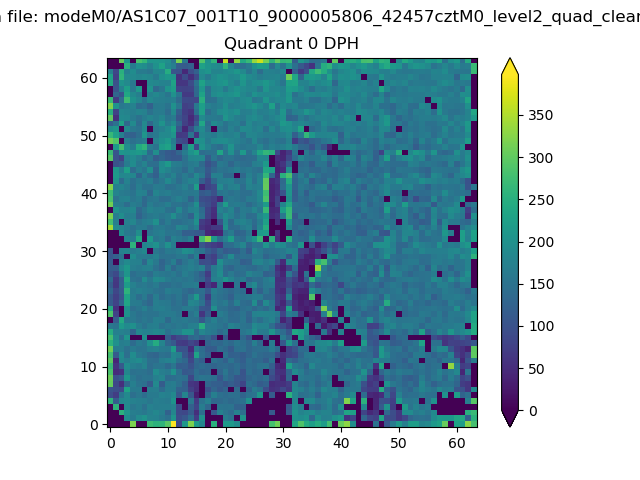 |
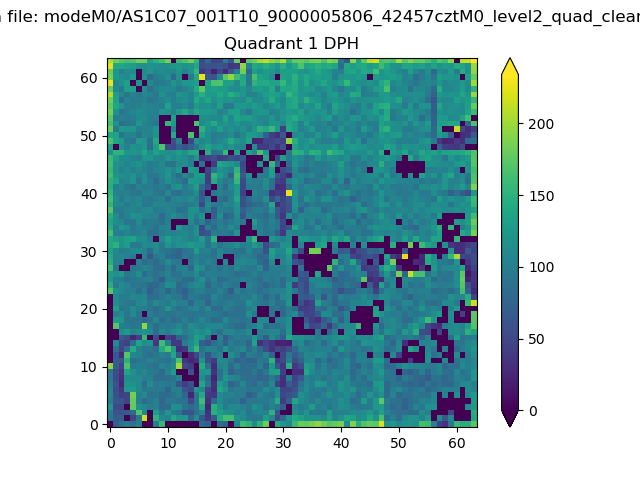 |
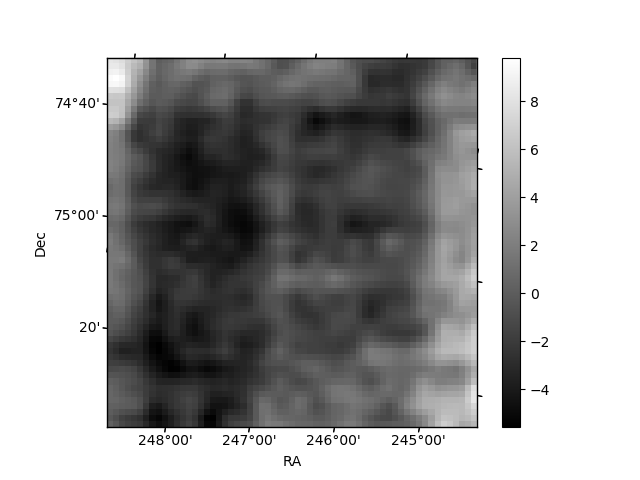
Quadrant B |
|---|---|---|---|
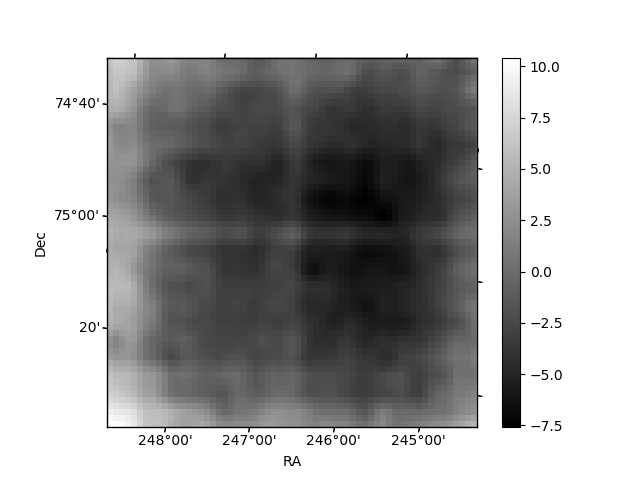
| Quadrant D | 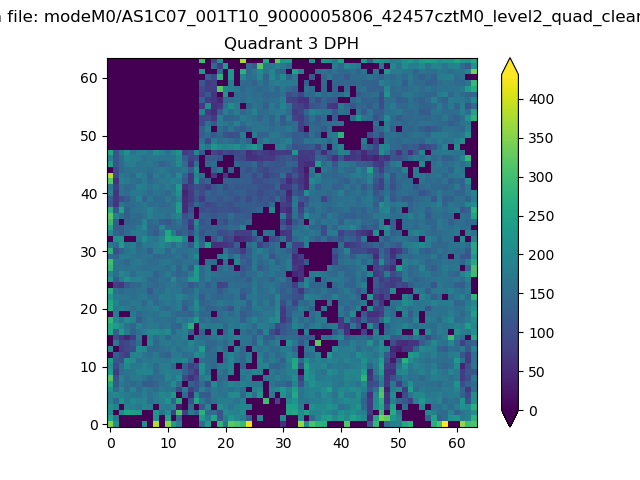 |
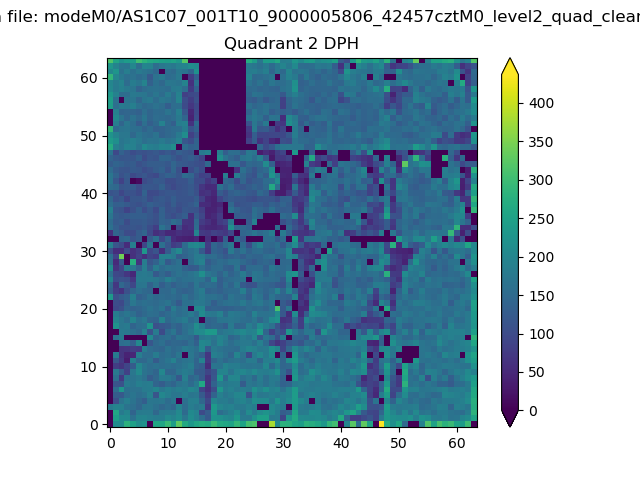 |
Quadrant C |
| Plot type | Count rate plots | Images |
|---|---|---|
| Comparison with Poisson distribution Blue bars denote a histogram of data divided into 1 sec bins. Red curve is a Poisson curve with rate = median count rate of data. |
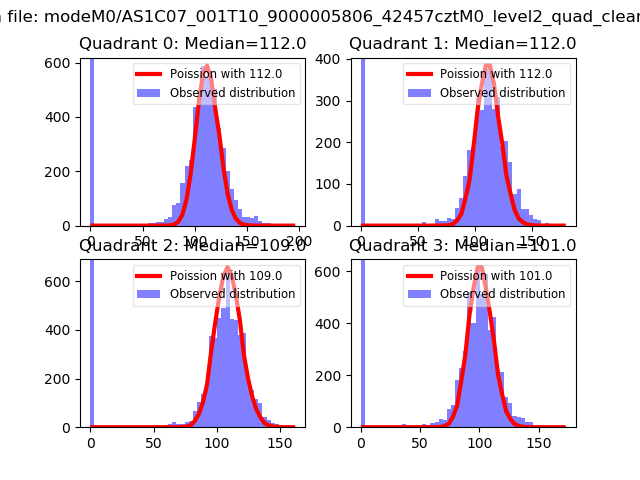 |
 |
| Quadrant-wise count rates Data is divided into 100 sec bins |
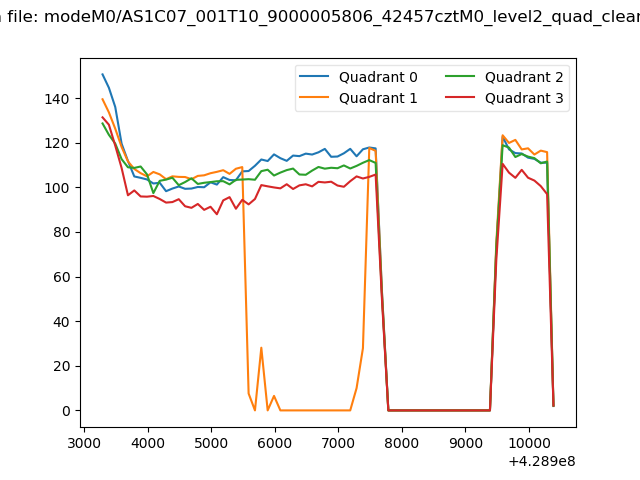 |
|
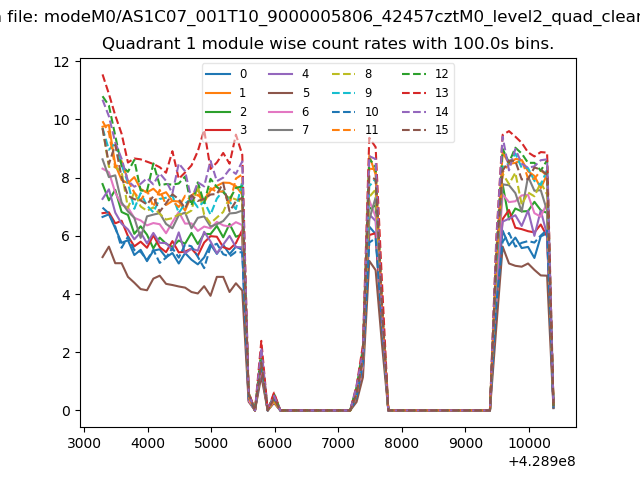
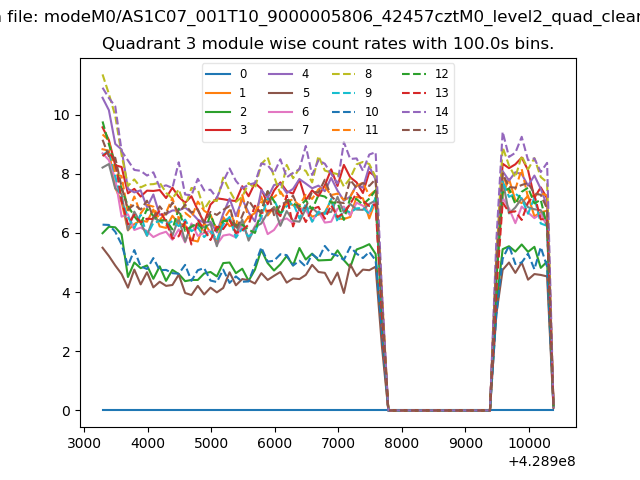
| Module-wise count rates for Quadrant A Data is divided into 100 sec bins |
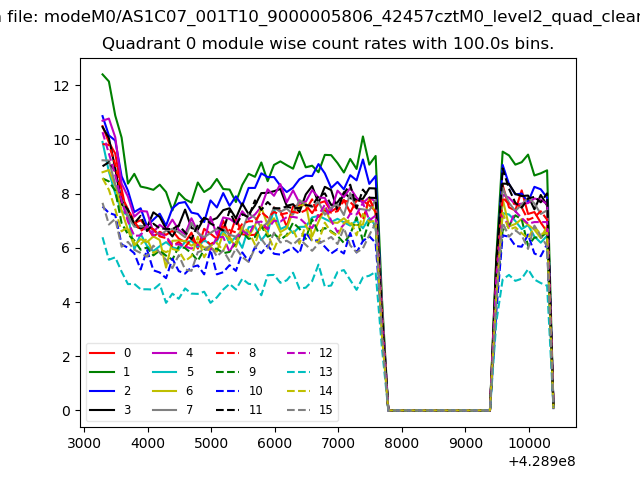 |
 |
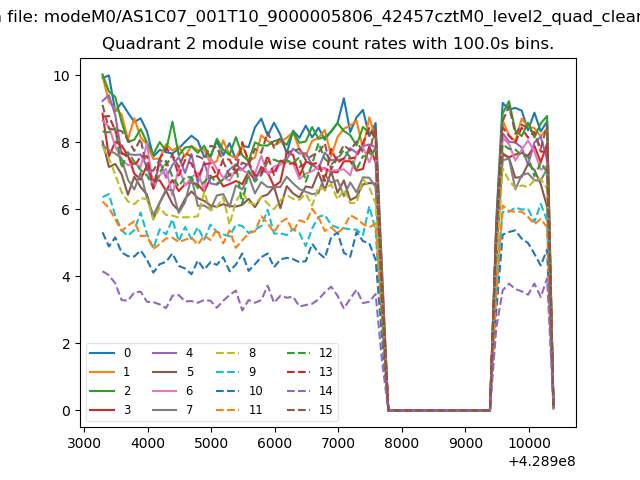
| Module-wise count rates for Quadrant B Data is divided into 100 sec bins |
 |
 |
| Module-wise count rates for Quadrant C Data is divided into 100 sec bins |
 |
 |
| Module-wise count rates for Quadrant D Data is divided into 100 sec bins |
 |
 |
| Parameter | Plot |
|---|---|
| CZT HV Monitor | 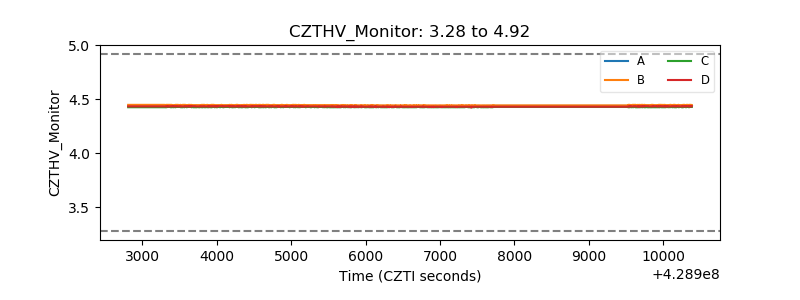 |
| D_VDD | 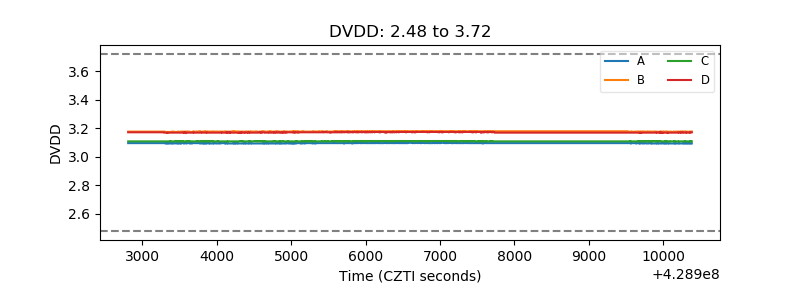 |
| Temperature 1 | 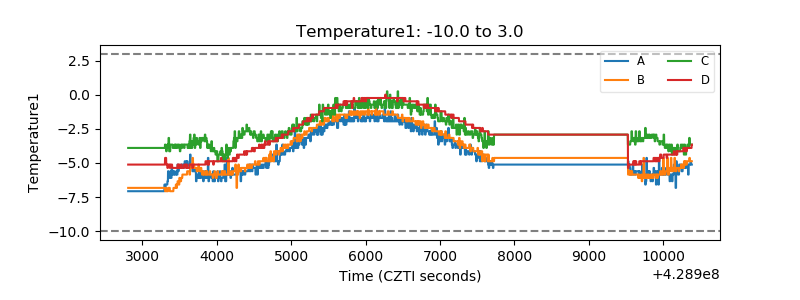 |
| Veto HV Monitor | 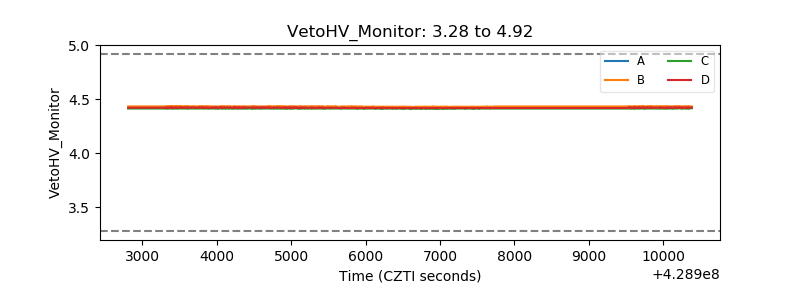 |
| Veto LLD | 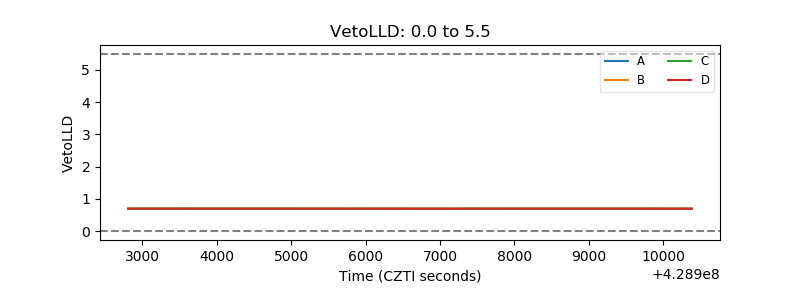 |
| Alpha Counter | 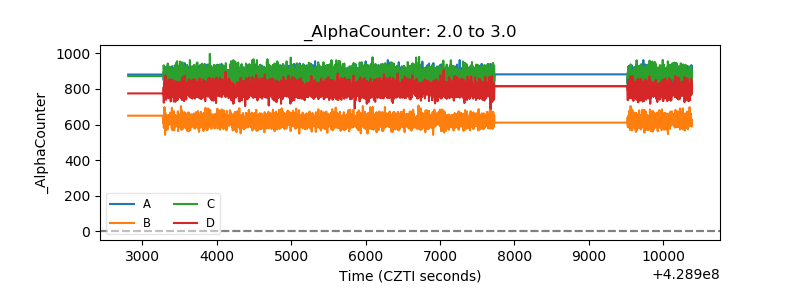 |
| _CPM_Rate | 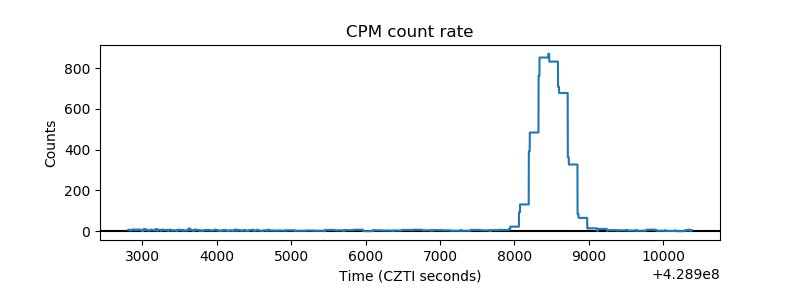 |
| CZT Counter | 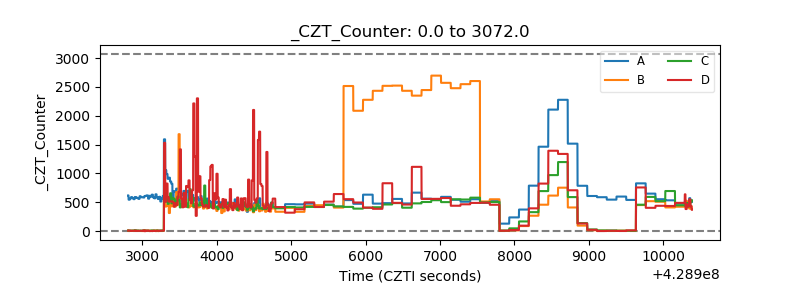 |
| +2.5 Volts monitor | 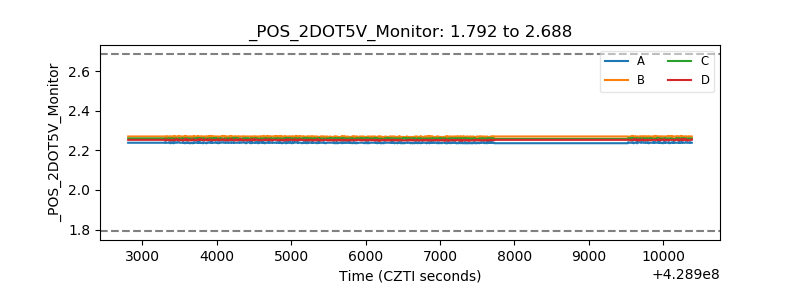 |
| +5 Volts monitor | 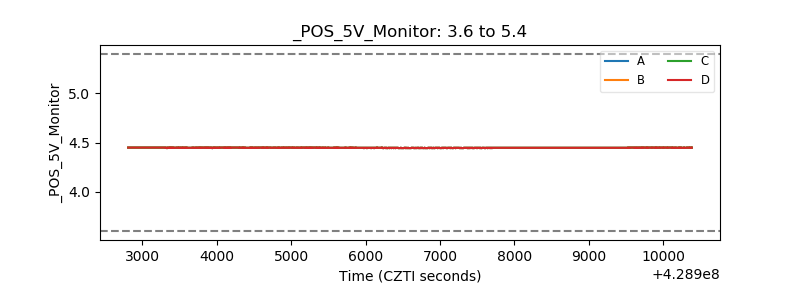 |
| _ROLL_ROT | 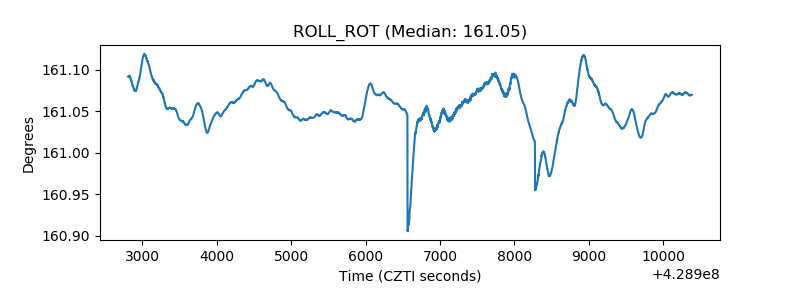 |
| _Roll_DEC | 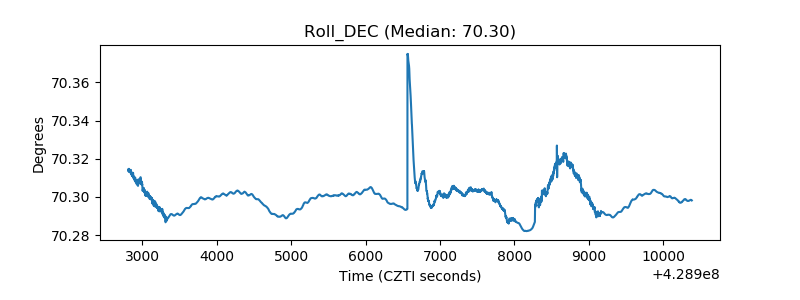 |
| _Roll_RA | 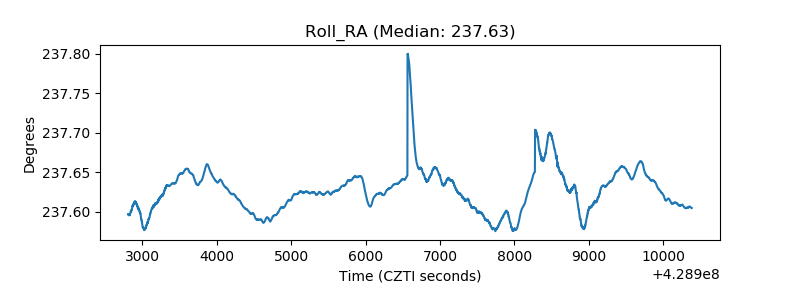 |
| Veto Counter | 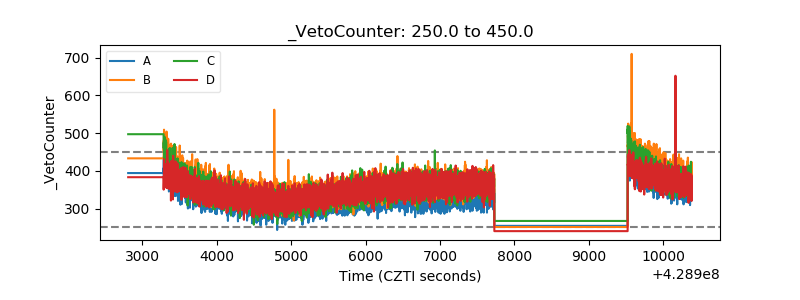 |