| Param | Original file | Final file |
|---|---|---|
| Filename | modeM0/AS1C07_001T10_9000005806_42458cztM0_level2.fits | modeM0/AS1C07_001T10_9000005806_42458cztM0_level2_quad_clean.evt |
| Size (bytes) | 325,546,560 | 88,001,280 |
| Size | 310.5 MB | 83.9 MB |
| Events in quadrant A | 2,888,305 | 599,598 |
| Events in quadrant B | 2,589,111 | 603,682 |
| Events in quadrant C | 2,477,985 | 578,594 |
| Events in quadrant D | 3,688,991 | 517,808 |
| Mode M9 | |||
|---|---|---|---|
| Quadrant | BADHDUFLAG | Total packets | Discarded packets |
| A | 0 | 28 | 0 |
| B | 0 | 29 | 0 |
| C | 0 | 29 | 0 |
| D | 0 | 29 | 0 |
| Mode SS | |||
|---|---|---|---|
| Quadrant | BADHDUFLAG | Total packets | Discarded packets |
| A | 0 | 106 | 0 |
| B | 0 | 106 | 0 |
| C | 0 | 106 | 0 |
| D | 0 | 106 | 0 |
| Mode M0 | |||
|---|---|---|---|
| Quadrant | BADHDUFLAG | Total packets | Discarded packets |
| A | 0 | 11612 | 2 |
| B | 0 | 11335 | 2 |
| C | 0 | 10719 | 2 |
| D | 0 | 14550 | 2 |
| Quadrant | Total seconds | Saturated seconds | Saturation percentage |
|---|---|---|---|
| A | 5212 | 16 | 0.306984% |
| B | 5212 | 47 | 0.901765% |
| C | 5212 | 3 | 0.057559% |
| D | 5212 | 308 | 5.909440% |
Noise dominated data is calculated using 1-second bins in cleaned event files. If a bin has >2000 counts, and if more than 50% of those come from <1% of pixels, then it is considered to be noise-dominated and hence unusable.
| Quadrant | # 1 sec bins | Bins with >0 counts | Bins with >2000 counts | High rate bins dominated by noise | Noise dominated (total time) | Noise dominated (detector-on time) | Marked lightcurve |
|---|---|---|---|---|---|---|---|
| A | 7124 | 5213 | 5 | 5 | 0.07% | 0.10% | 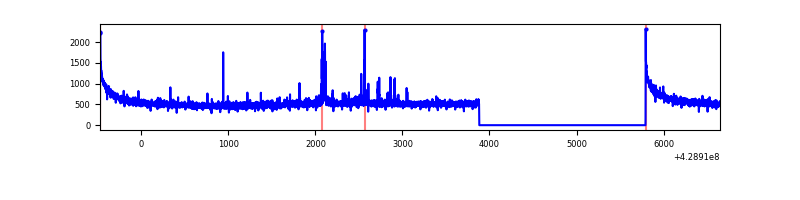 |
| B | 7124 | 5213 | 27 | 27 | 0.38% | 0.52% | 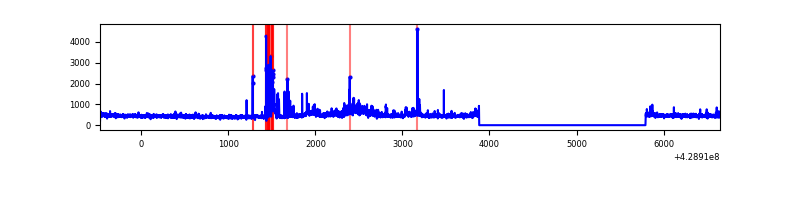 |
| C | 7124 | 5213 | 0 | 0 | 0.00% | 0.00% | 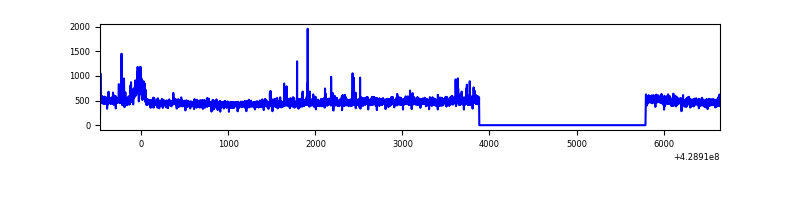 |
| D | 7124 | 5213 | 237 | 237 | 3.33% | 4.55% | 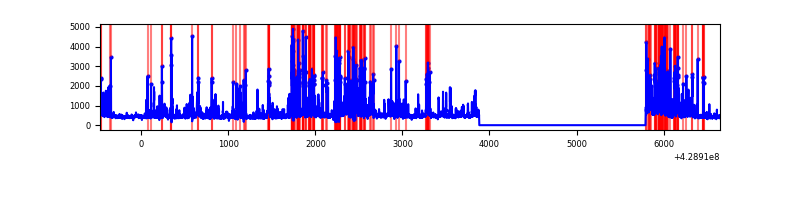 |
Top three noisy pixels from each quadrant. If the there are fewer than three noisy pixels in the level2.evt file, extra rows are filled as -1
| Pixel properties | Quadrant properties | ||||||
|---|---|---|---|---|---|---|---|
| Quadrant | DetID | PixID | Counts | Sigma | Mean | Median | Sigma |
| A | 10 | 83 | 564272 | 4789.3 | 575 | 564 | 117.7 |
| A | 13 | 248 | 63441 | 534.2 | 575 | 564 | 117.7 |
| A | 12 | 189 | 19488 | 160.78 | 575 | 564 | 117.7 |
| B | 0 | 186 | 267966 | 2472.1 | 566 | 553 | 108.2 |
| B | 3 | 112 | 18662 | 167.41 | 566 | 553 | 108.2 |
| B | 5 | 255 | 16203 | 144.68 | 566 | 553 | 108.2 |
| C | 15 | 214 | 222194 | 1723.41 | 551 | 553 | 128.6 |
| C | 3 | 233 | 59210 | 456.1 | 551 | 553 | 128.6 |
| C | 14 | 254 | 37770 | 289.39 | 551 | 553 | 128.6 |
| D | 1 | 52 | 309166 | 2327.01 | 545 | 530 | 132.6 |
| D | 1 | 47 | 299009 | 2250.43 | 545 | 530 | 132.6 |
| D | 2 | 16 | 229817 | 1728.75 | 545 | 530 | 132.6 |
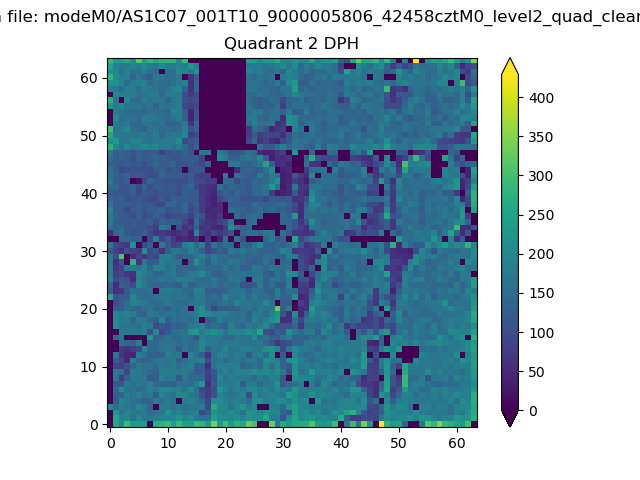
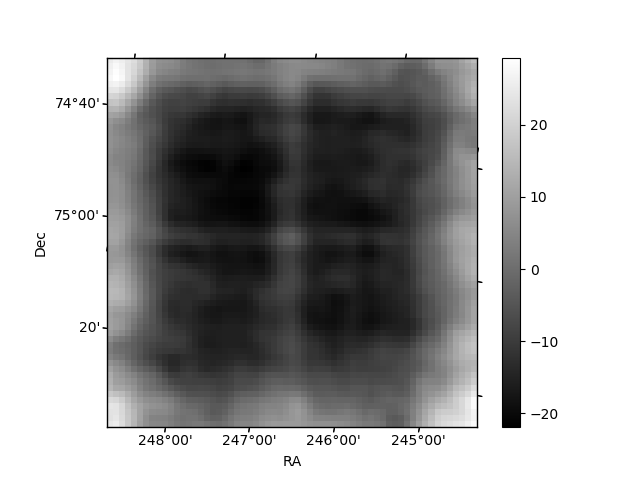
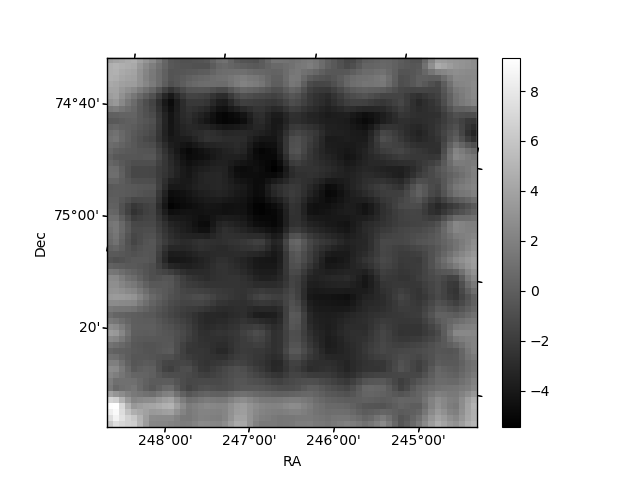
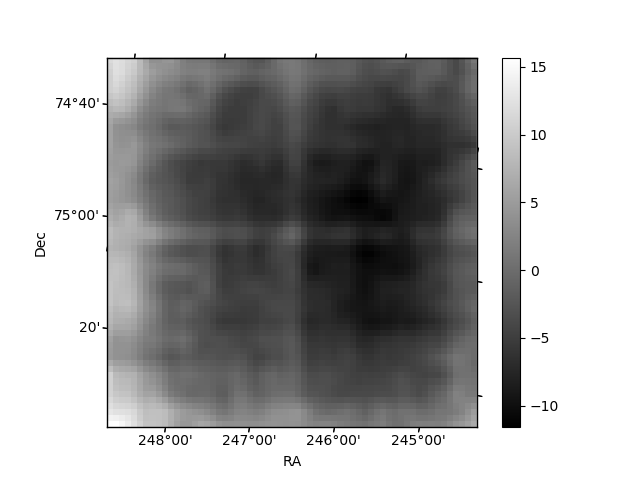
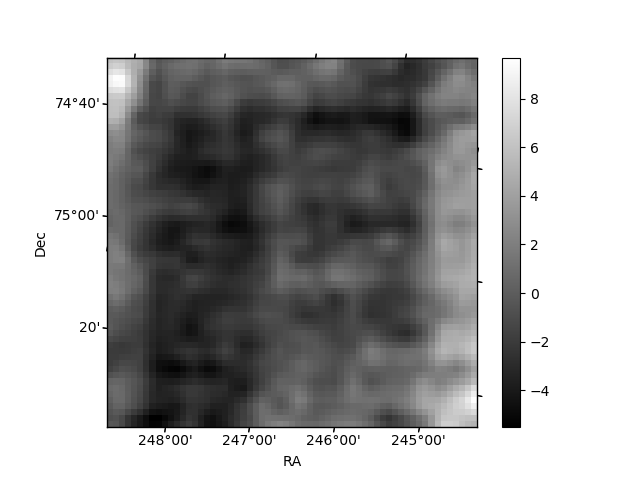
Histogram calculated using DETX and DETY for each event in the final _common_clean file
| Quadrant A | 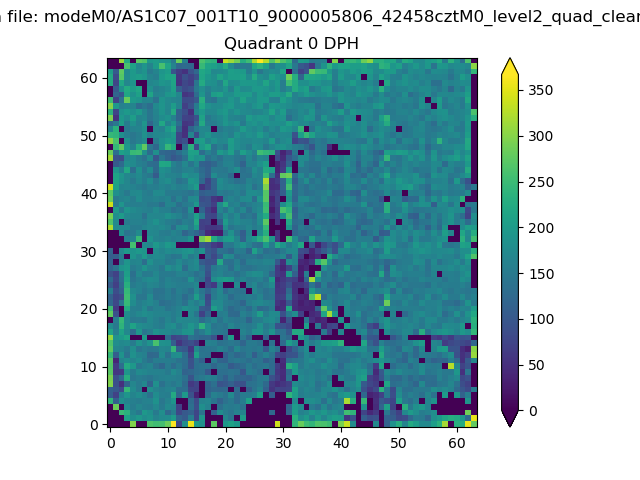 |
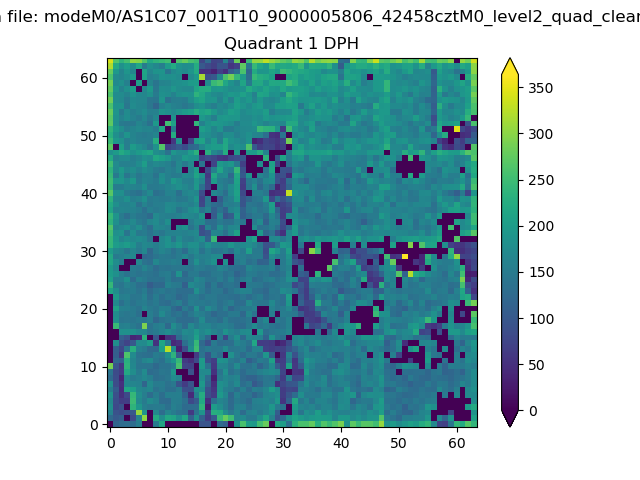 |
Quadrant B |
|---|---|---|---|
| Quadrant D | 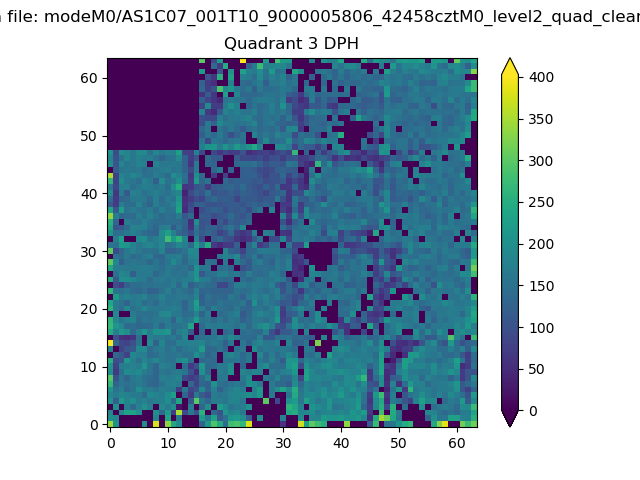 |
 |
Quadrant C |
| Plot type | Count rate plots | Images |
|---|---|---|
| Comparison with Poisson distribution Blue bars denote a histogram of data divided into 1 sec bins. Red curve is a Poisson curve with rate = median count rate of data. |
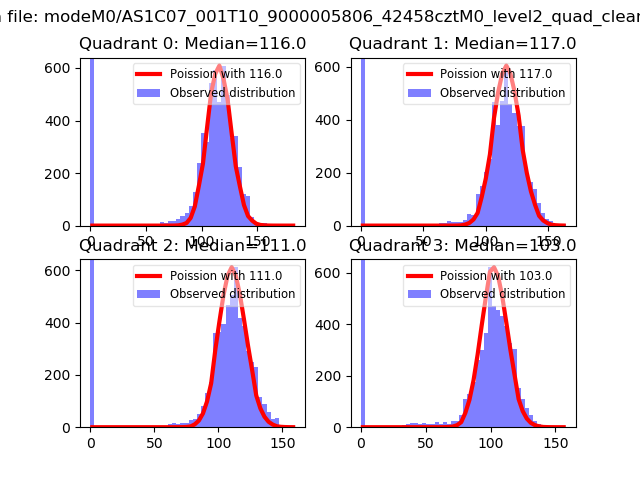 |
 |
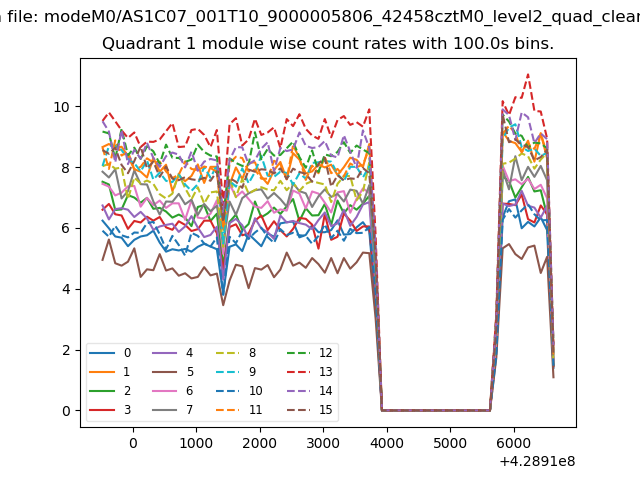
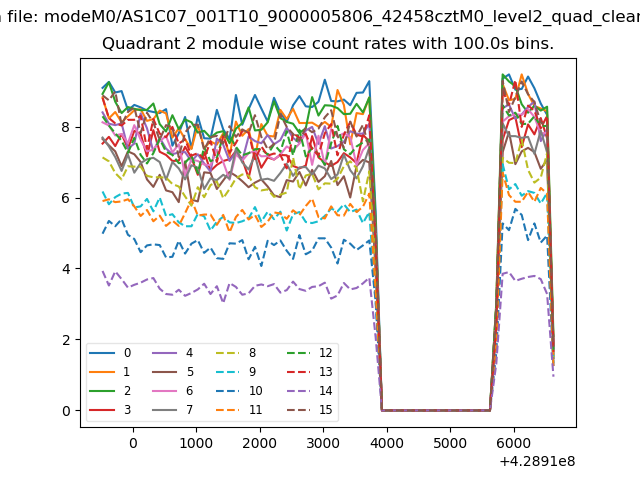
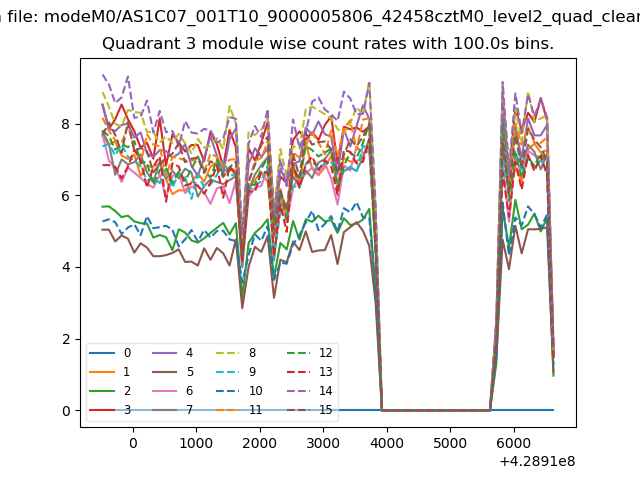
| Quadrant-wise count rates Data is divided into 100 sec bins |
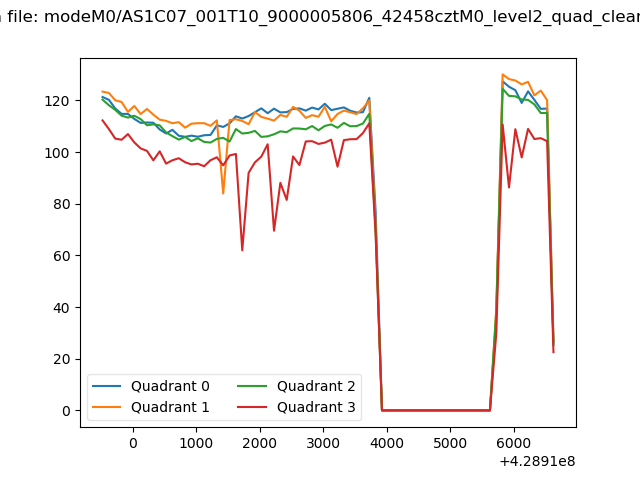 |
|
| Module-wise count rates for Quadrant A Data is divided into 100 sec bins |
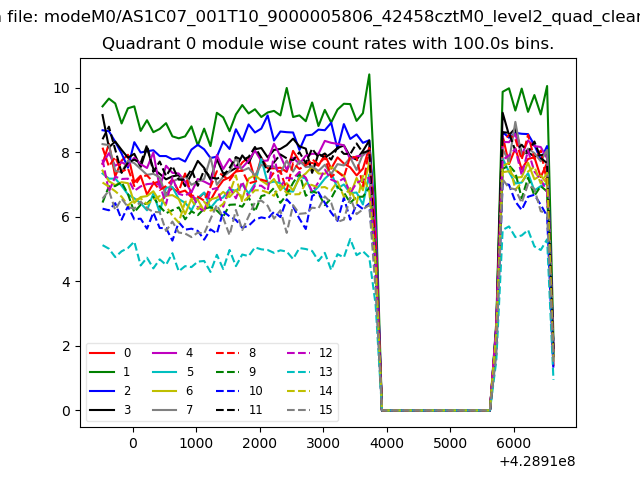 |
 |
| Module-wise count rates for Quadrant B Data is divided into 100 sec bins |
 |
 |
| Module-wise count rates for Quadrant C Data is divided into 100 sec bins |
 |
 |
| Module-wise count rates for Quadrant D Data is divided into 100 sec bins |
 |
 |
| Parameter | Plot |
|---|---|
| CZT HV Monitor | 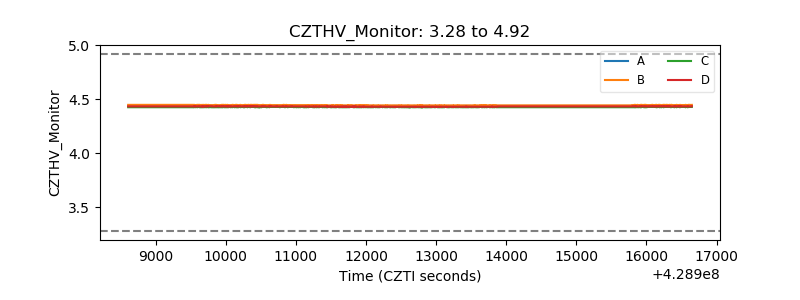 |
| D_VDD | 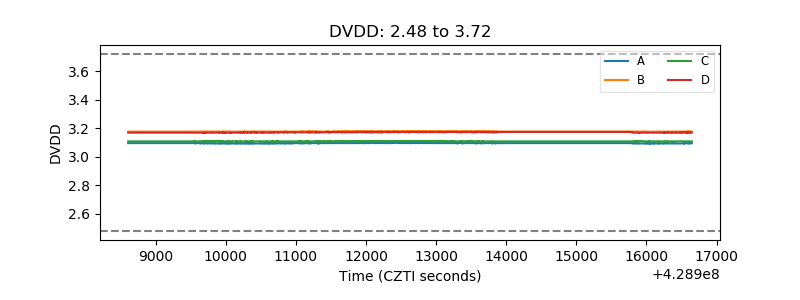 |
| Temperature 1 | 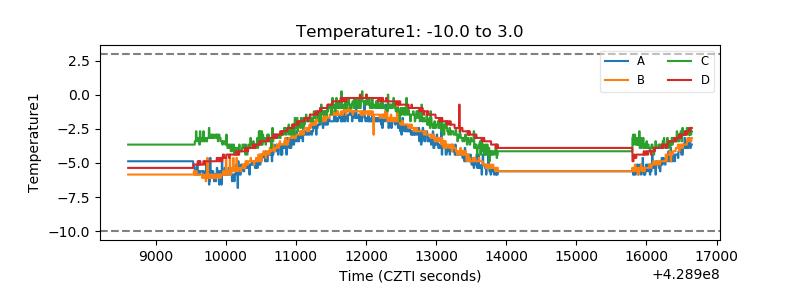 |
| Veto HV Monitor | 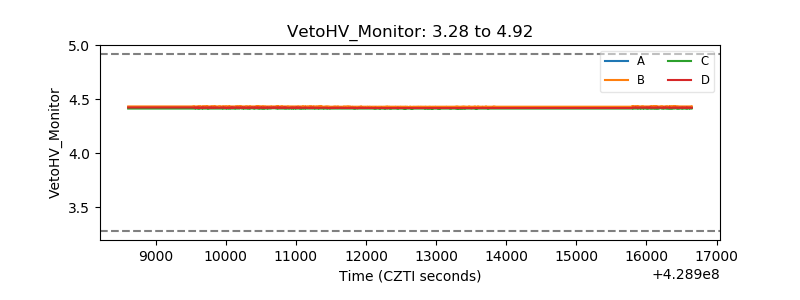 |
| Veto LLD | 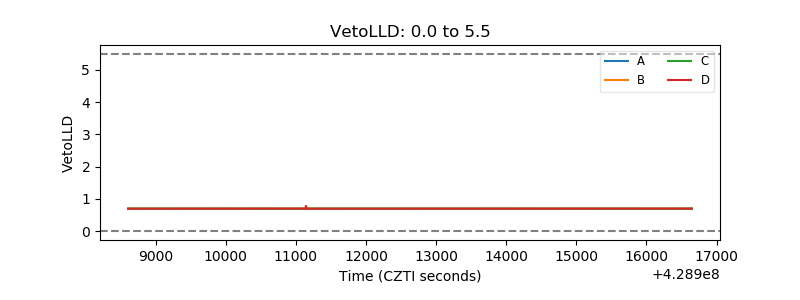 |
| Alpha Counter | 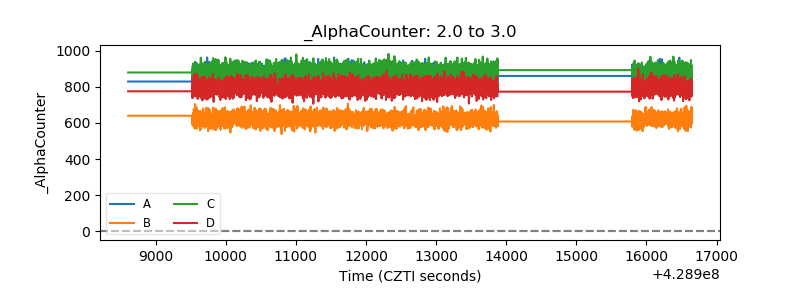 |
| _CPM_Rate | 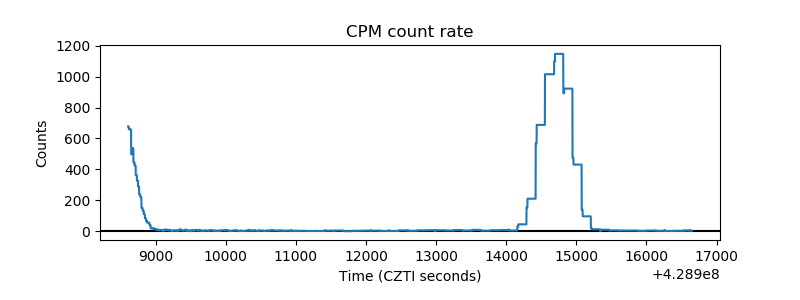 |
| CZT Counter | 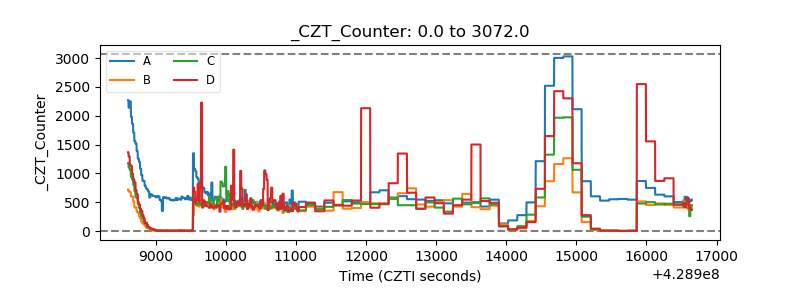 |
| +2.5 Volts monitor | 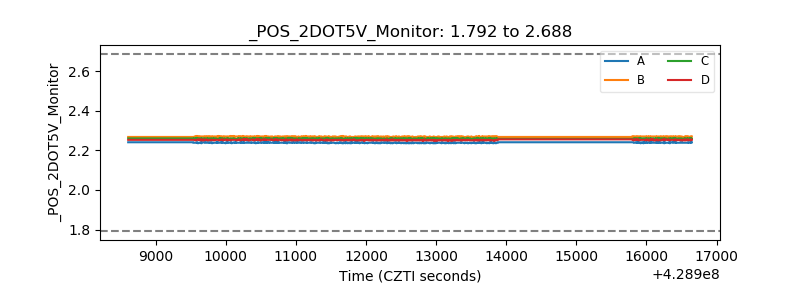 |
| +5 Volts monitor | 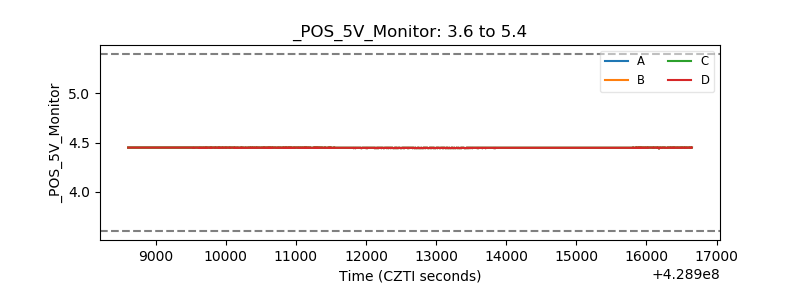 |
| _ROLL_ROT | 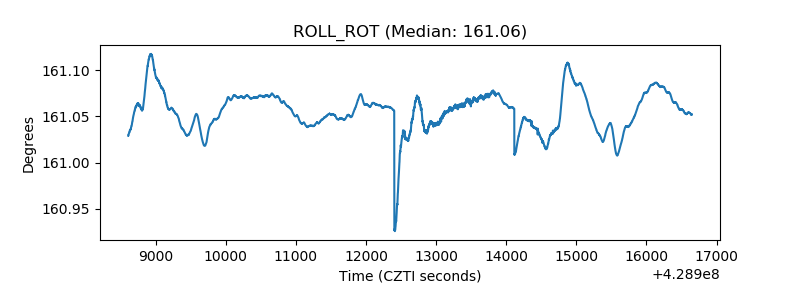 |
| _Roll_DEC | 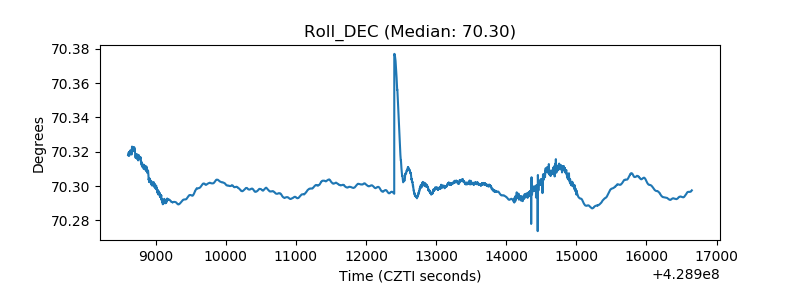 |
| _Roll_RA | 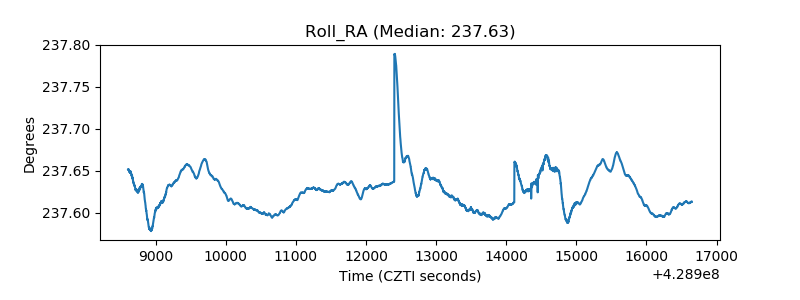 |
| Veto Counter | 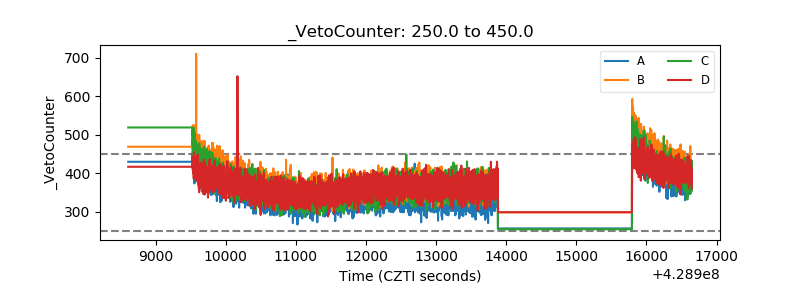 |