| Param | Original file | Final file |
|---|---|---|
| Filename | modeM0/AS1C07_001T10_9000005806_42459cztM0_level2.fits | modeM0/AS1C07_001T10_9000005806_42459cztM0_level2_quad_clean.evt |
| Size (bytes) | 340,246,080 | 87,048,000 |
| Size | 324.5 MB | 83.0 MB |
| Events in quadrant A | 2,813,535 | 603,512 |
| Events in quadrant B | 3,547,536 | 578,933 |
| Events in quadrant C | 2,464,738 | 573,498 |
| Events in quadrant D | 3,374,662 | 525,018 |
| Mode M9 | |||
|---|---|---|---|
| Quadrant | BADHDUFLAG | Total packets | Discarded packets |
| A | 0 | 28 | 0 |
| B | 0 | 29 | 0 |
| C | 0 | 29 | 0 |
| D | 0 | 29 | 0 |
| Mode SS | |||
|---|---|---|---|
| Quadrant | BADHDUFLAG | Total packets | Discarded packets |
| A | 0 | 104 | 0 |
| B | 0 | 104 | 0 |
| C | 0 | 104 | 0 |
| D | 0 | 104 | 0 |
| Mode M0 | |||
|---|---|---|---|
| Quadrant | BADHDUFLAG | Total packets | Discarded packets |
| A | 0 | 11232 | 2 |
| B | 0 | 13948 | 2 |
| C | 0 | 10500 | 2 |
| D | 0 | 13431 | 2 |
| Quadrant | Total seconds | Saturated seconds | Saturation percentage |
|---|---|---|---|
| A | 5062 | 10 | 0.197550% |
| B | 5062 | 320 | 6.321612% |
| C | 5062 | 25 | 0.493876% |
| D | 5061 | 203 | 4.011065% |
Noise dominated data is calculated using 1-second bins in cleaned event files. If a bin has >2000 counts, and if more than 50% of those come from <1% of pixels, then it is considered to be noise-dominated and hence unusable.
| Quadrant | # 1 sec bins | Bins with >0 counts | Bins with >2000 counts | High rate bins dominated by noise | Noise dominated (total time) | Noise dominated (detector-on time) | Marked lightcurve |
|---|---|---|---|---|---|---|---|
| A | 7095 | 5063 | 2 | 2 | 0.03% | 0.04% | 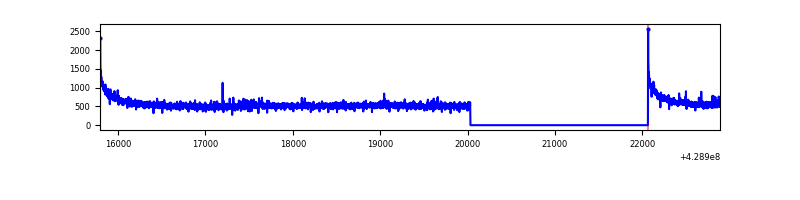 |
| B | 7095 | 5063 | 264 | 264 | 3.72% | 5.21% | 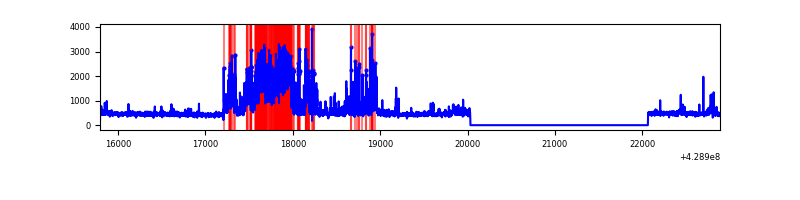 |
| C | 7095 | 5063 | 18 | 18 | 0.25% | 0.36% | 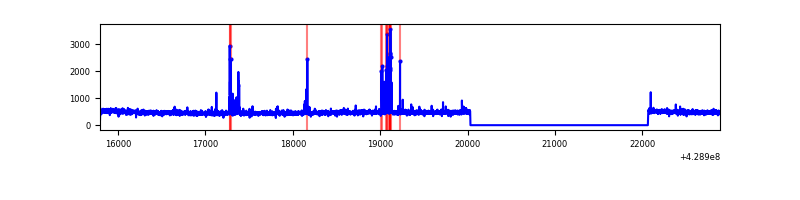 |
| D | 7094 | 5062 | 185 | 185 | 2.61% | 3.65% | 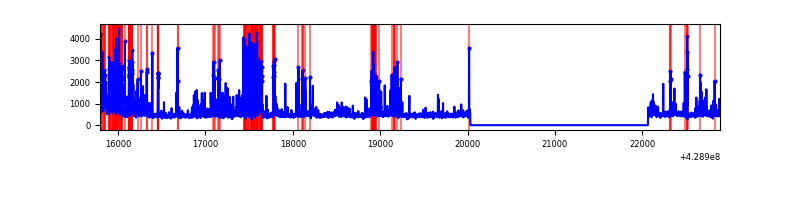 |
Top three noisy pixels from each quadrant. If the there are fewer than three noisy pixels in the level2.evt file, extra rows are filled as -1
| Pixel properties | Quadrant properties | ||||||
|---|---|---|---|---|---|---|---|
| Quadrant | DetID | PixID | Counts | Sigma | Mean | Median | Sigma |
| A | 10 | 83 | 567576 | 4919.21 | 568 | 557 | 115.3 |
| A | 12 | 189 | 22303 | 188.66 | 568 | 557 | 115.3 |
| A | 13 | 6 | 14835 | 123.87 | 568 | 557 | 115.3 |
| B | 0 | 186 | 1253467 | 12085.12 | 548 | 534 | 103.7 |
| B | 15 | 33 | 37086 | 352.56 | 548 | 534 | 103.7 |
| B | 5 | 255 | 35131 | 333.7 | 548 | 534 | 103.7 |
| C | 15 | 214 | 215152 | 1714.77 | 542 | 544 | 125.2 |
| C | 14 | 254 | 112433 | 894.02 | 542 | 544 | 125.2 |
| C | 4 | 254 | 14620 | 112.47 | 542 | 544 | 125.2 |
| D | 1 | 47 | 309881 | 2350.99 | 545 | 531 | 131.6 |
| D | 2 | 16 | 295646 | 2242.81 | 545 | 531 | 131.6 |
| D | 12 | 233 | 193089 | 1463.4 | 545 | 531 | 131.6 |
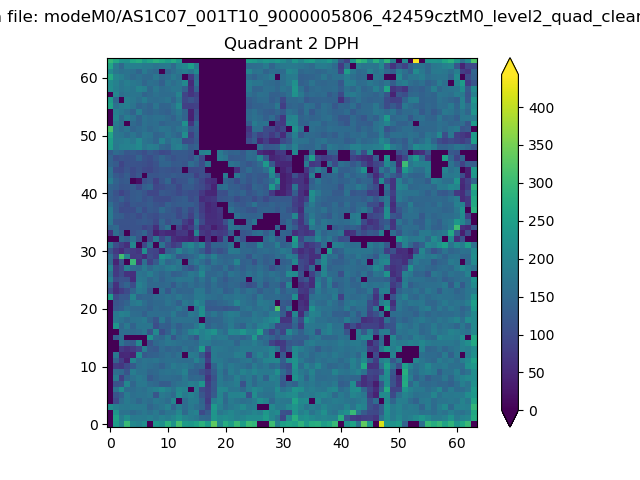
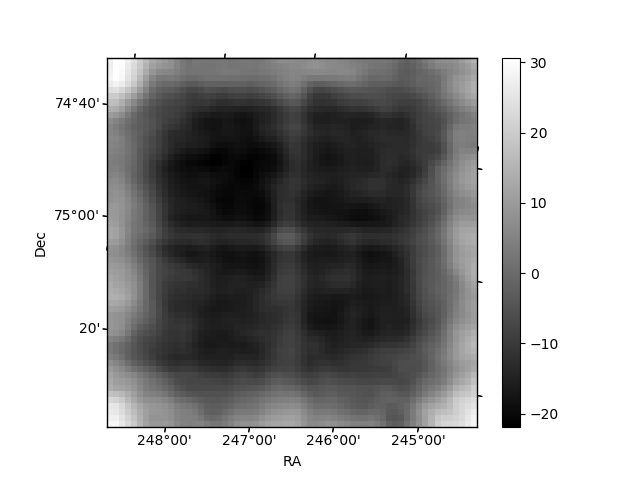
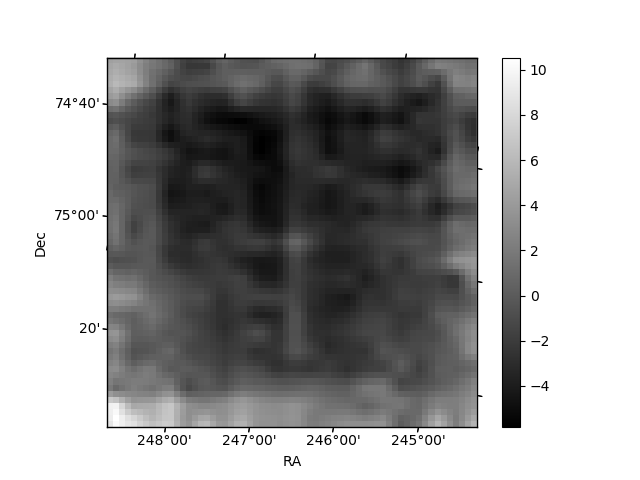
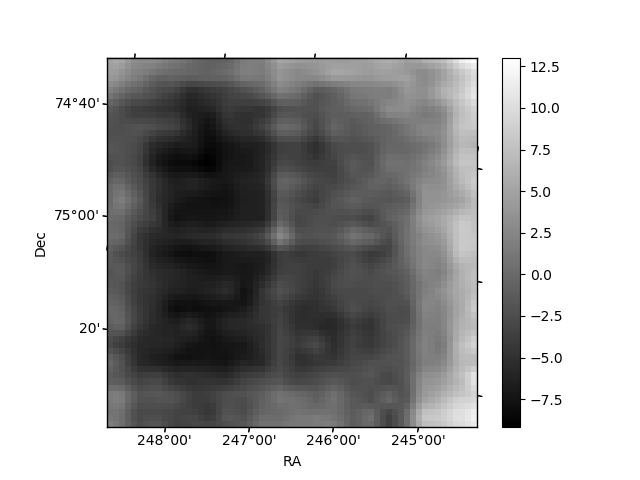
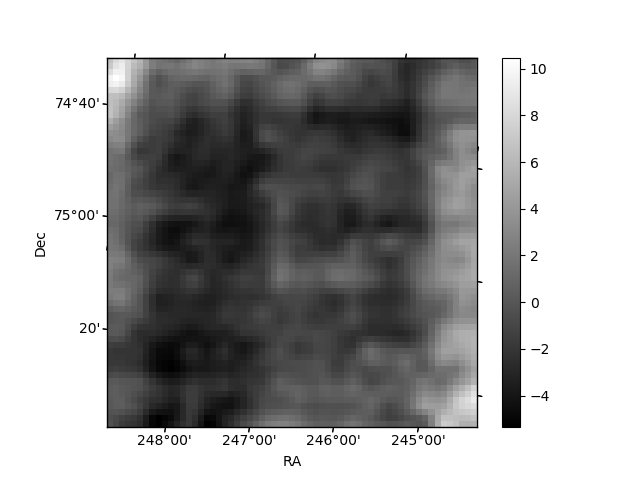
Histogram calculated using DETX and DETY for each event in the final _common_clean file
| Quadrant A | 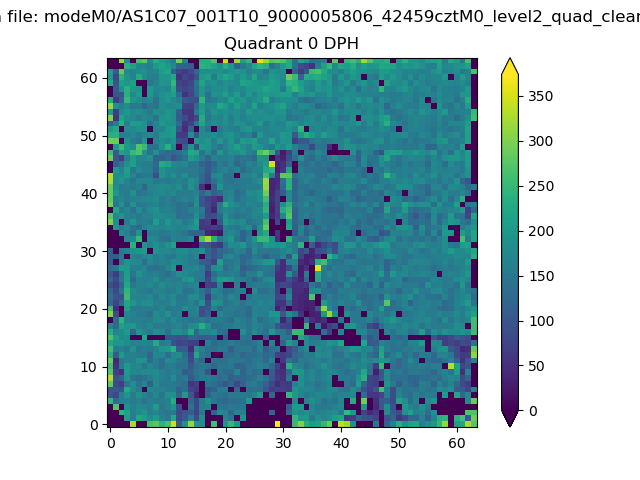 |
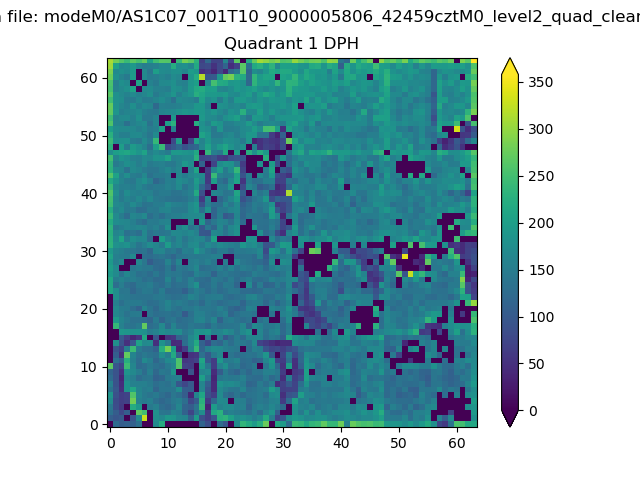 |
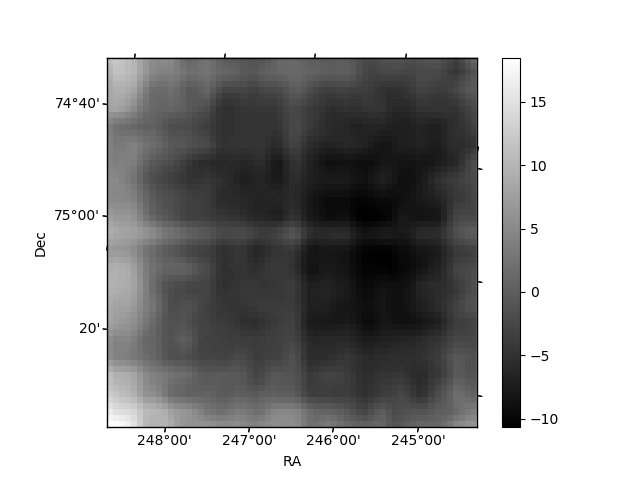
Quadrant B |
|---|---|---|---|
| Quadrant D | 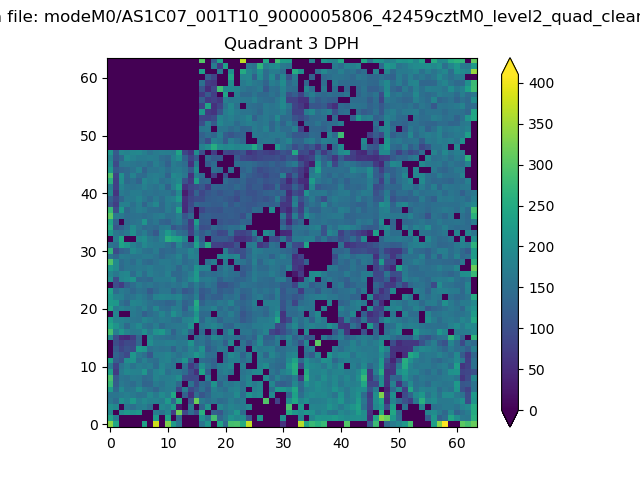 |
 |
Quadrant C |
| Plot type | Count rate plots | Images |
|---|---|---|
| Comparison with Poisson distribution Blue bars denote a histogram of data divided into 1 sec bins. Red curve is a Poisson curve with rate = median count rate of data. |
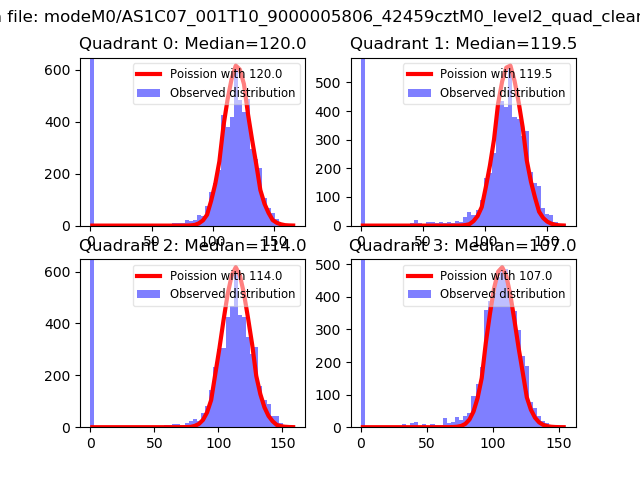 |
 |
| Quadrant-wise count rates Data is divided into 100 sec bins |
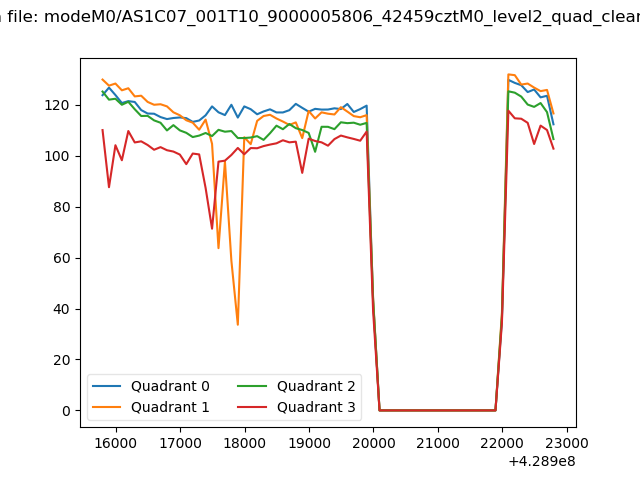 |
|
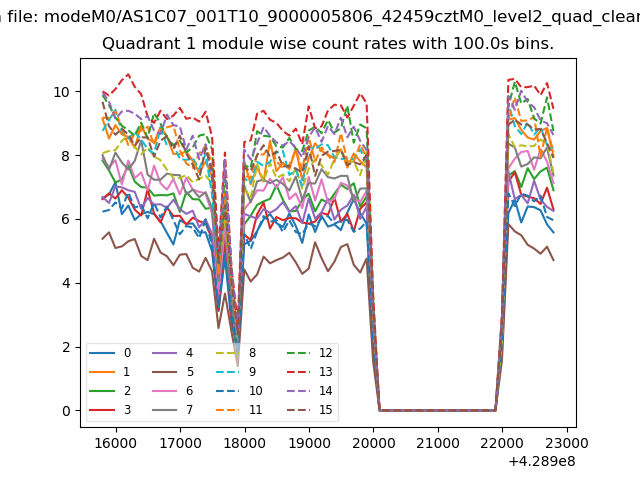
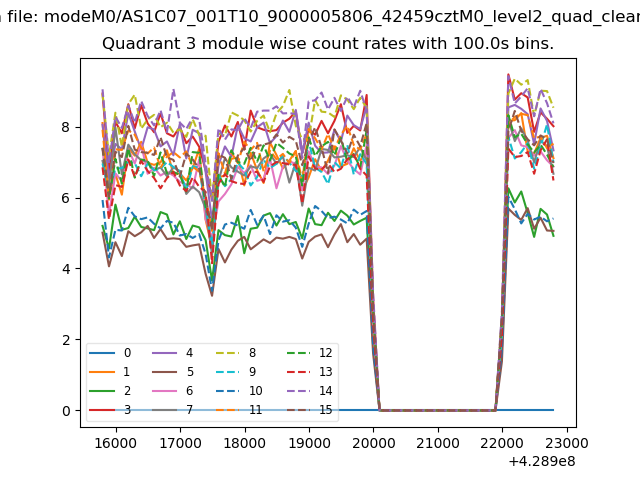
| Module-wise count rates for Quadrant A Data is divided into 100 sec bins |
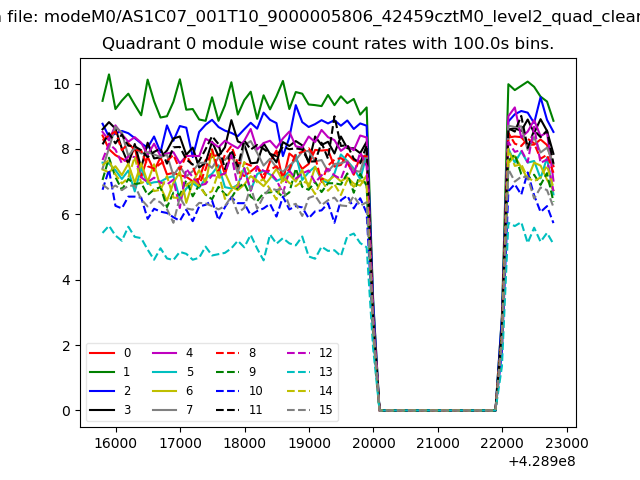 |
 |
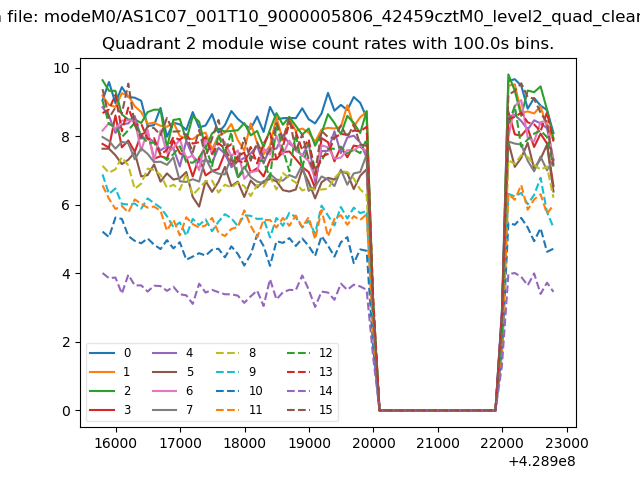
| Module-wise count rates for Quadrant B Data is divided into 100 sec bins |
 |
 |
| Module-wise count rates for Quadrant C Data is divided into 100 sec bins |
 |
 |
| Module-wise count rates for Quadrant D Data is divided into 100 sec bins |
 |
 |
| Parameter | Plot |
|---|---|
| CZT HV Monitor | 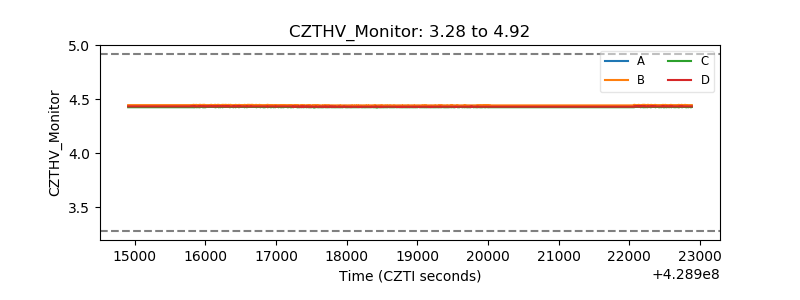 |
| D_VDD | 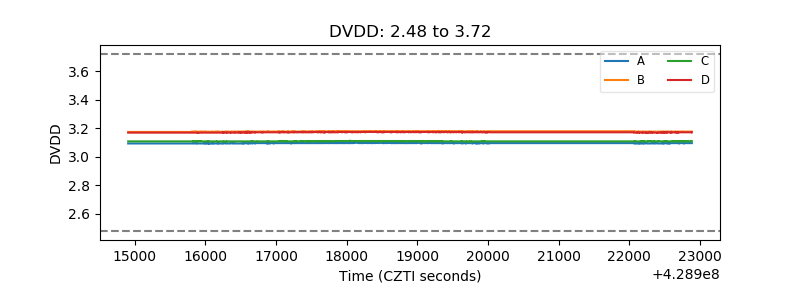 |
| Temperature 1 | 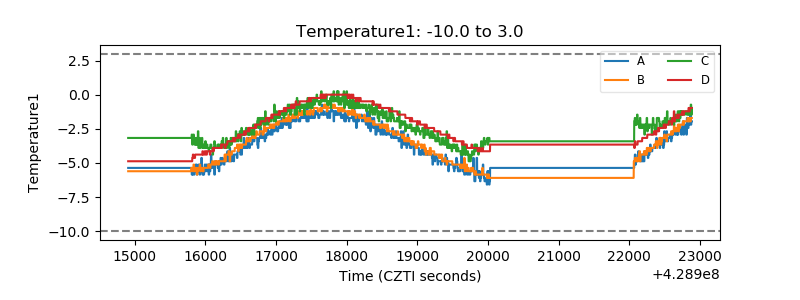 |
| Veto HV Monitor |  |
| Veto LLD | 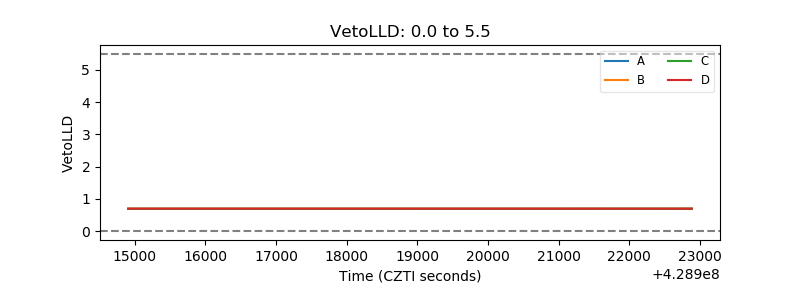 |
| Alpha Counter | 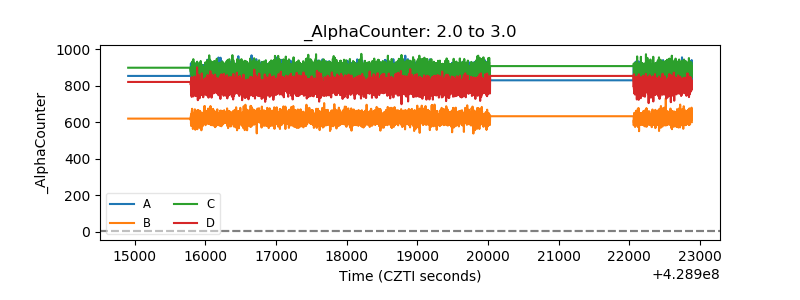 |
| _CPM_Rate | 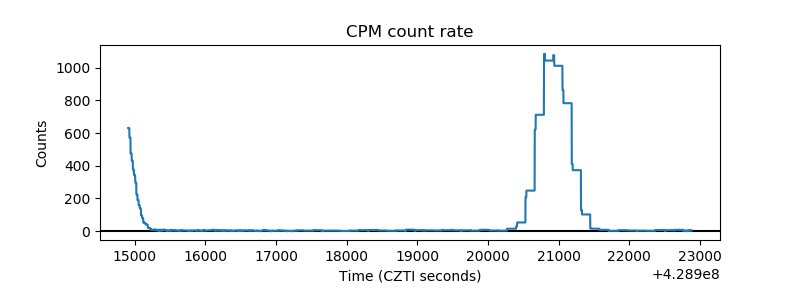 |
| CZT Counter | 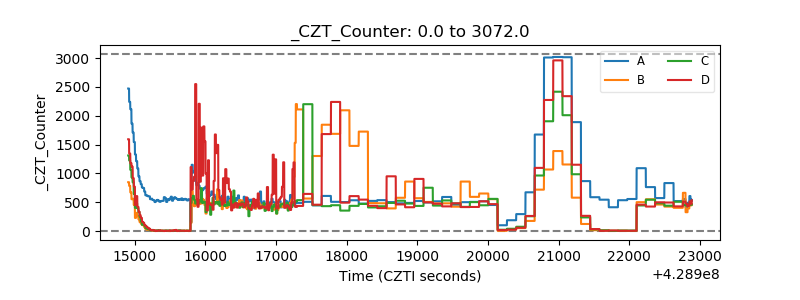 |
| +2.5 Volts monitor | 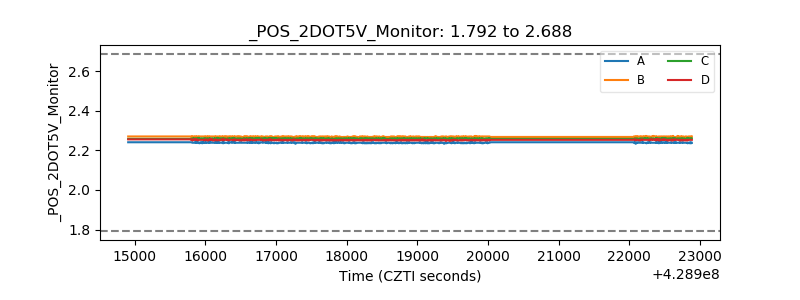 |
| +5 Volts monitor | 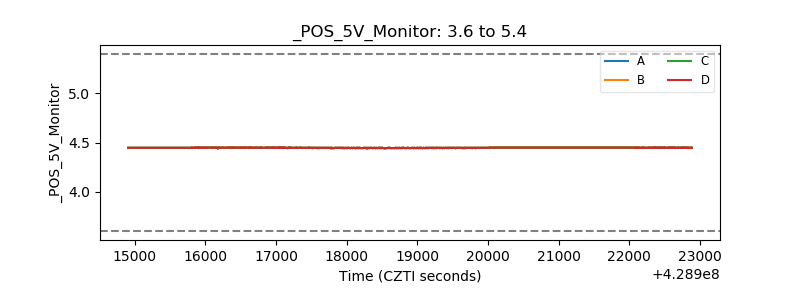 |
| _ROLL_ROT | 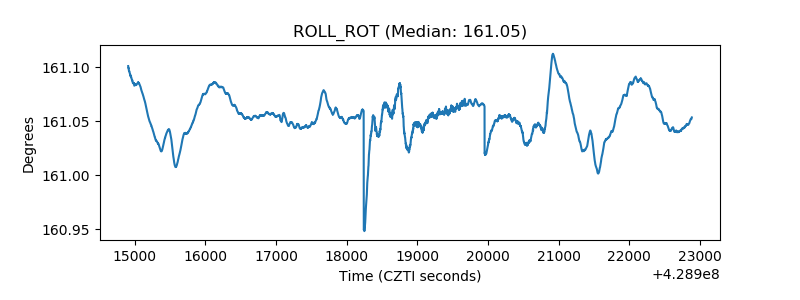 |
| _Roll_DEC | 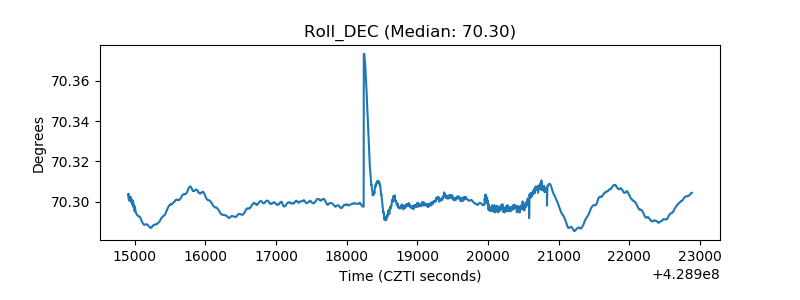 |
| _Roll_RA | 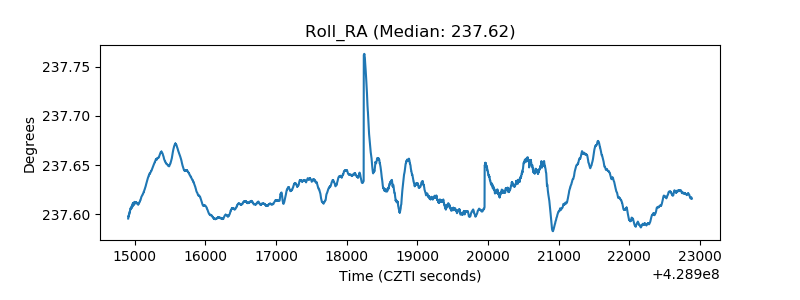 |
| Veto Counter | 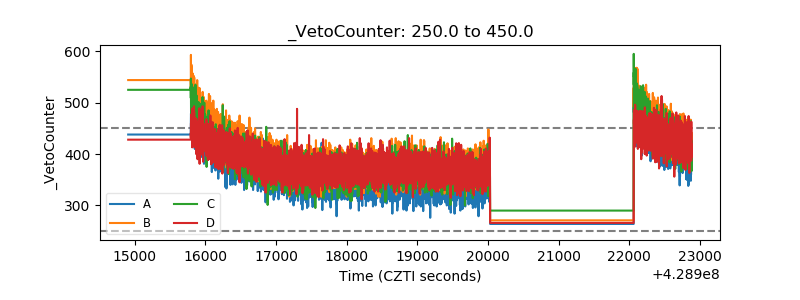 |