| Param | Original file | Final file |
|---|---|---|
| Filename | modeM0/AS1C07_001T10_9000005806_42460cztM0_level2.fits | modeM0/AS1C07_001T10_9000005806_42460cztM0_level2_quad_clean.evt |
| Size (bytes) | 336,556,800 | 85,570,560 |
| Size | 321.0 MB | 81.6 MB |
| Events in quadrant A | 2,841,725 | 597,460 |
| Events in quadrant B | 3,618,780 | 561,409 |
| Events in quadrant C | 2,316,752 | 563,777 |
| Events in quadrant D | 3,296,632 | 522,398 |
| Mode M9 | |||
|---|---|---|---|
| Quadrant | BADHDUFLAG | Total packets | Discarded packets |
| A | 0 | 30 | 0 |
| B | 0 | 31 | 0 |
| C | 0 | 31 | 0 |
| D | 0 | 31 | 0 |
| Mode SS | |||
|---|---|---|---|
| Quadrant | BADHDUFLAG | Total packets | Discarded packets |
| A | 0 | 102 | 0 |
| B | 0 | 102 | 0 |
| C | 0 | 102 | 0 |
| D | 0 | 102 | 0 |
| Mode M0 | |||
|---|---|---|---|
| Quadrant | BADHDUFLAG | Total packets | Discarded packets |
| A | 0 | 11360 | 2 |
| B | 0 | 14096 | 4 |
| C | 0 | 9949 | 2 |
| D | 0 | 13029 | 2 |
| Quadrant | Total seconds | Saturated seconds | Saturation percentage |
|---|---|---|---|
| A | 4932 | 15 | 0.304136% |
| B | 4931 | 359 | 7.280470% |
| C | 4931 | 3 | 0.060840% |
| D | 4931 | 147 | 2.981140% |
Noise dominated data is calculated using 1-second bins in cleaned event files. If a bin has >2000 counts, and if more than 50% of those come from <1% of pixels, then it is considered to be noise-dominated and hence unusable.
| Quadrant | # 1 sec bins | Bins with >0 counts | Bins with >2000 counts | High rate bins dominated by noise | Noise dominated (total time) | Noise dominated (detector-on time) | Marked lightcurve |
|---|---|---|---|---|---|---|---|
| A | 7055 | 4933 | 2 | 2 | 0.03% | 0.04% | 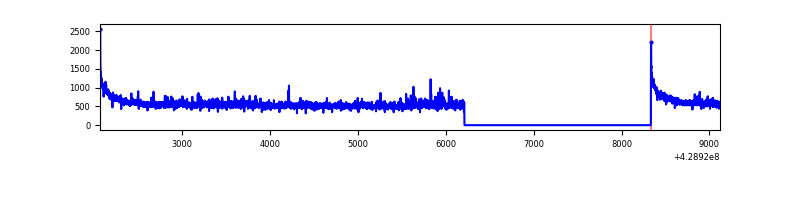 |
| B | 7054 | 4932 | 302 | 302 | 4.28% | 6.12% | 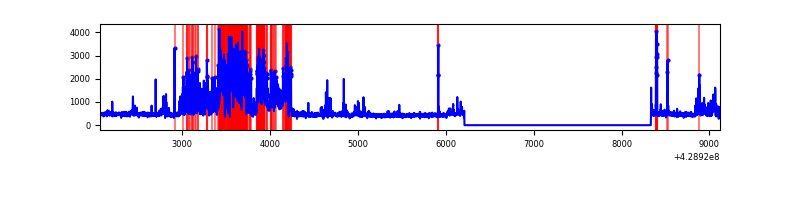 |
| C | 7054 | 4932 | 1 | 1 | 0.01% | 0.02% | 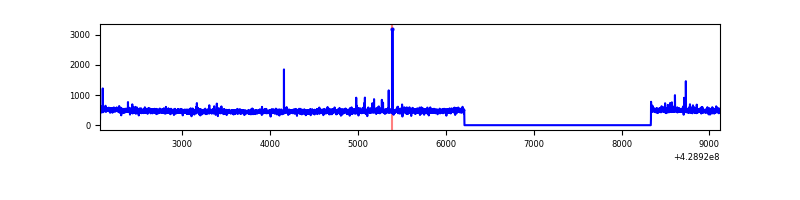 |
| D | 7054 | 4932 | 132 | 132 | 1.87% | 2.68% | 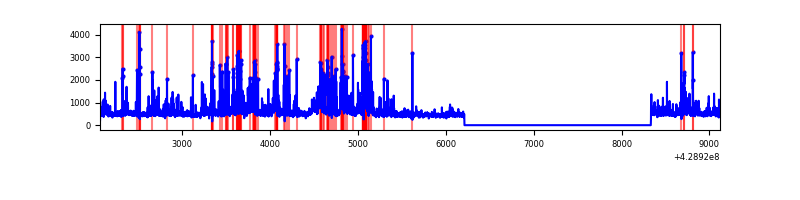 |
Top three noisy pixels from each quadrant. If the there are fewer than three noisy pixels in the level2.evt file, extra rows are filled as -1
| Pixel properties | Quadrant properties | ||||||
|---|---|---|---|---|---|---|---|
| Quadrant | DetID | PixID | Counts | Sigma | Mean | Median | Sigma |
| A | 10 | 83 | 578426 | 5098.69 | 553 | 542 | 113.3 |
| A | 12 | 189 | 93733 | 822.23 | 553 | 542 | 113.3 |
| A | 13 | 6 | 15069 | 128.17 | 553 | 542 | 113.3 |
| B | 0 | 186 | 1329317 | 13138.3 | 529 | 516 | 101.1 |
| B | 5 | 172 | 50674 | 495.93 | 529 | 516 | 101.1 |
| B | 15 | 35 | 47647 | 466.0 | 529 | 516 | 101.1 |
| C | 15 | 214 | 210624 | 1714.42 | 529 | 532 | 122.5 |
| C | 15 | 111 | 8546 | 65.4 | 529 | 532 | 122.5 |
| C | 14 | 254 | 8508 | 65.09 | 529 | 532 | 122.5 |
| D | 12 | 233 | 439334 | 3411.14 | 533 | 518 | 128.6 |
| D | 2 | 16 | 216129 | 1676.05 | 533 | 518 | 128.6 |
| D | 10 | 118 | 145463 | 1126.73 | 533 | 518 | 128.6 |
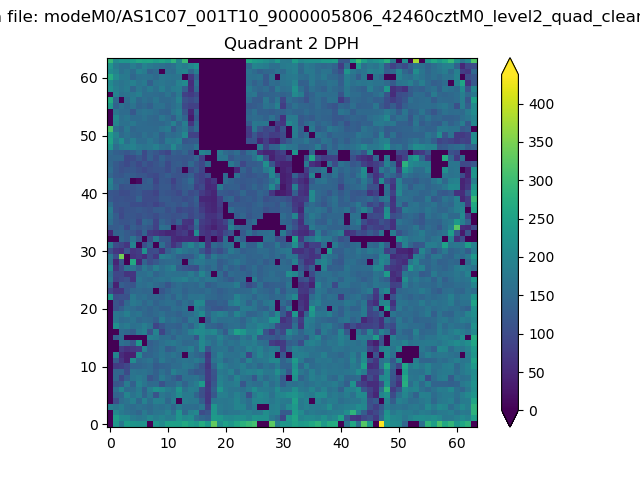
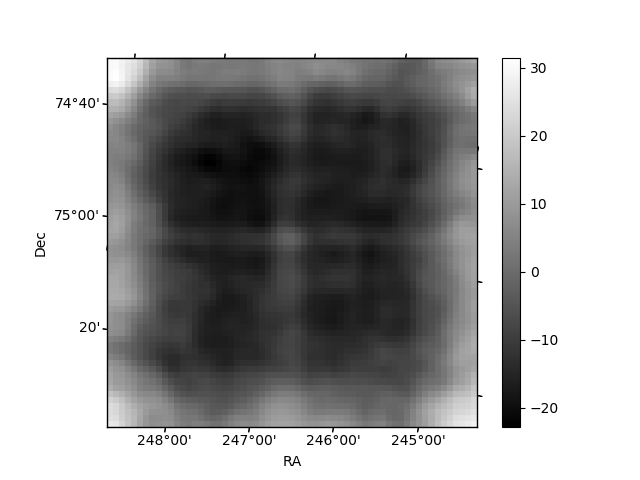
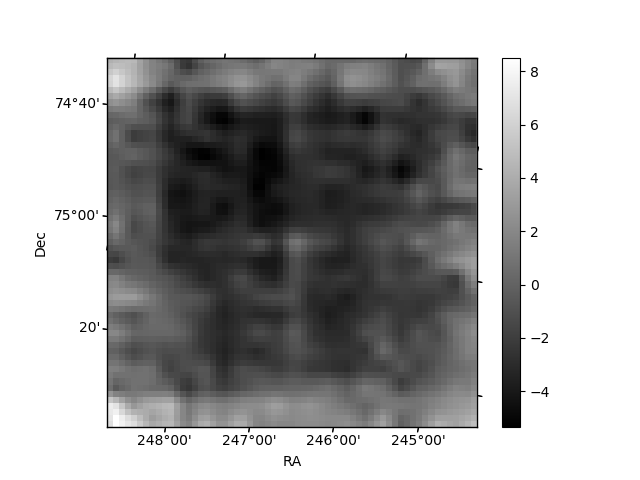
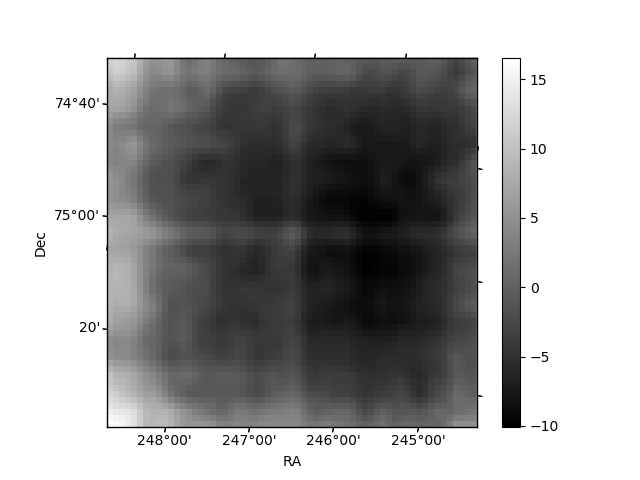
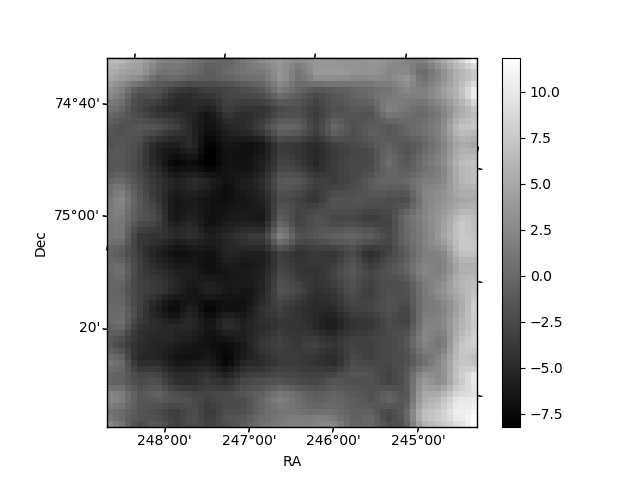
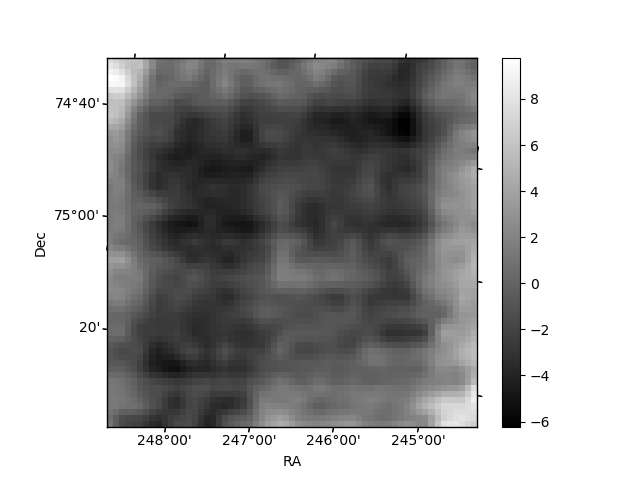
Histogram calculated using DETX and DETY for each event in the final _common_clean file
| Quadrant A | 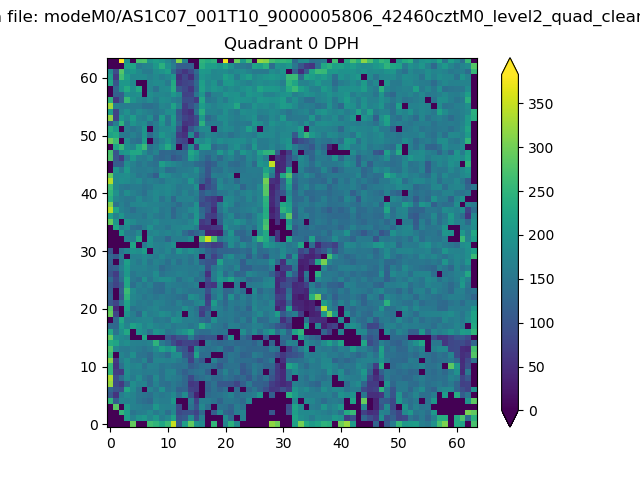 |
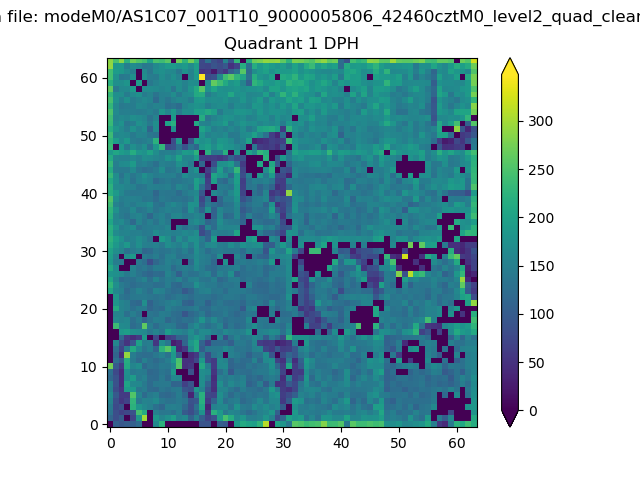 |
Quadrant B |
|---|---|---|---|
| Quadrant D | 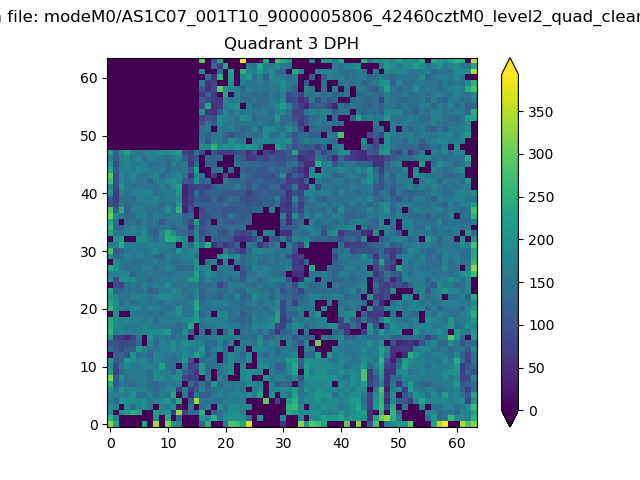 |
 |
Quadrant C |
| Plot type | Count rate plots | Images |
|---|---|---|
| Comparison with Poisson distribution Blue bars denote a histogram of data divided into 1 sec bins. Red curve is a Poisson curve with rate = median count rate of data. |
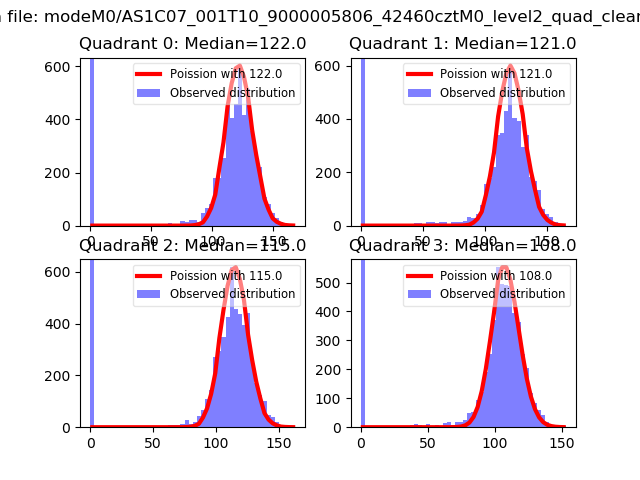 |
 |
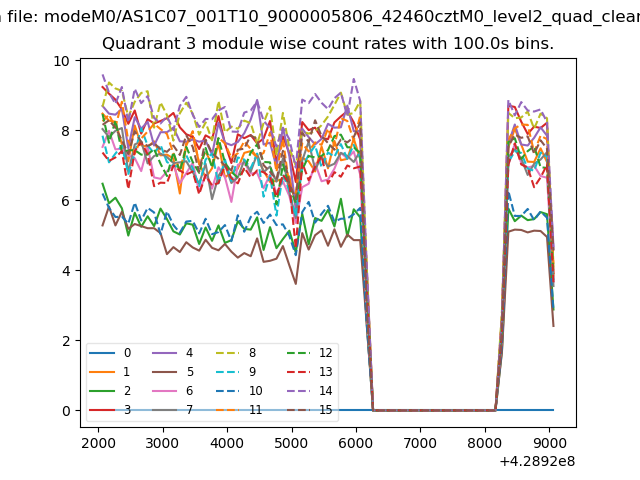
| Quadrant-wise count rates Data is divided into 100 sec bins |
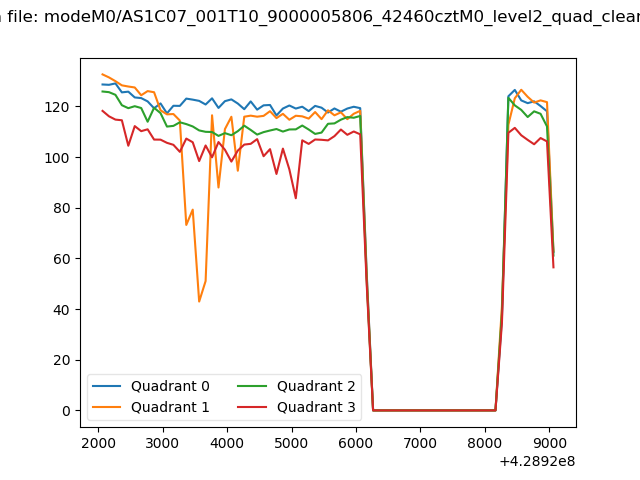 |
|
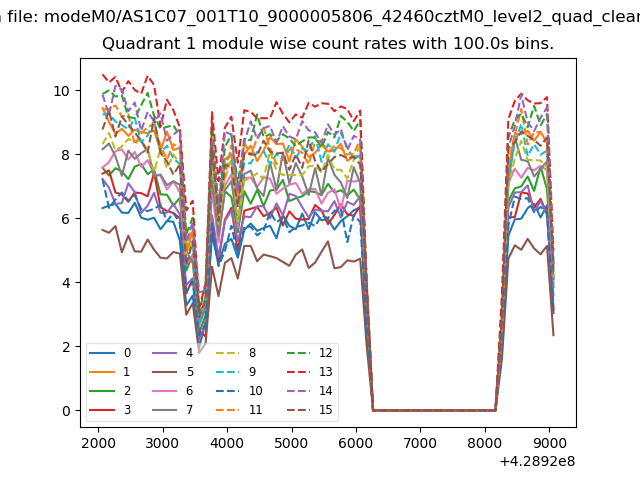
| Module-wise count rates for Quadrant A Data is divided into 100 sec bins |
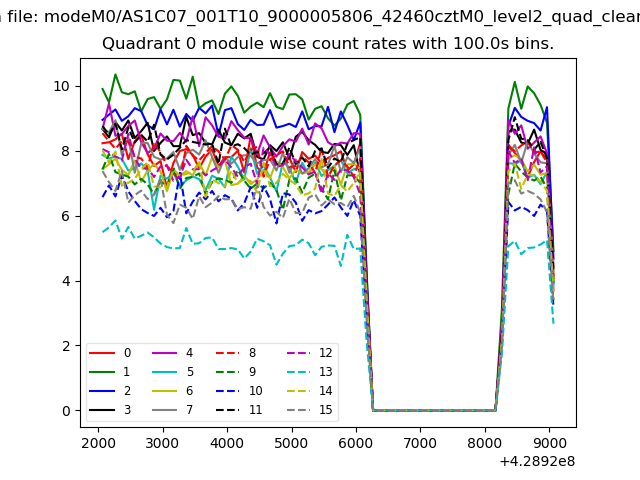 |
 |
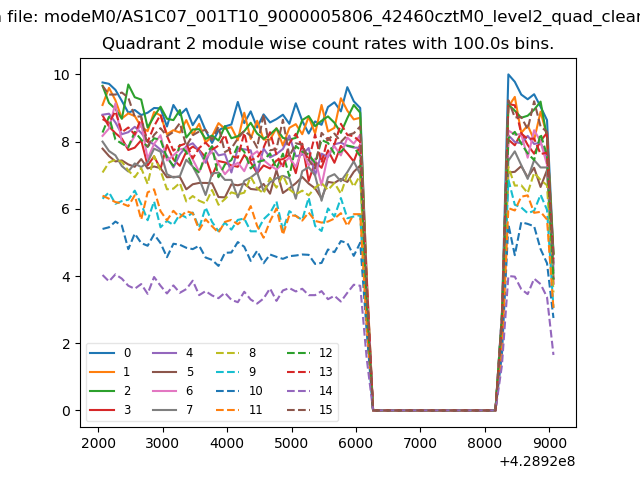
| Module-wise count rates for Quadrant B Data is divided into 100 sec bins |
 |
 |
| Module-wise count rates for Quadrant C Data is divided into 100 sec bins |
 |
 |
| Module-wise count rates for Quadrant D Data is divided into 100 sec bins |
 |
 |
| Parameter | Plot |
|---|---|
| CZT HV Monitor | 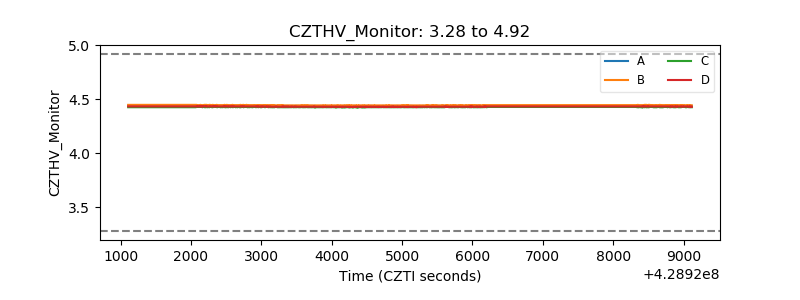 |
| D_VDD | 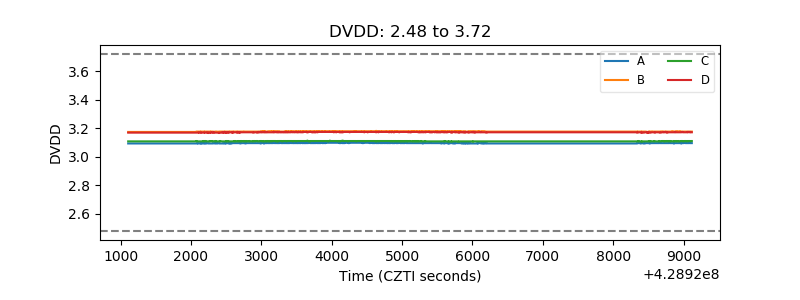 |
| Temperature 1 | 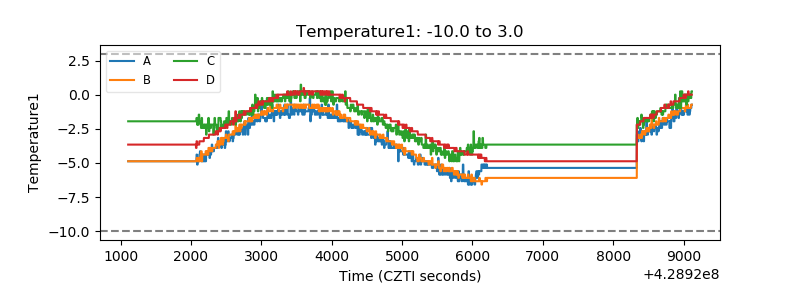 |
| Veto HV Monitor | 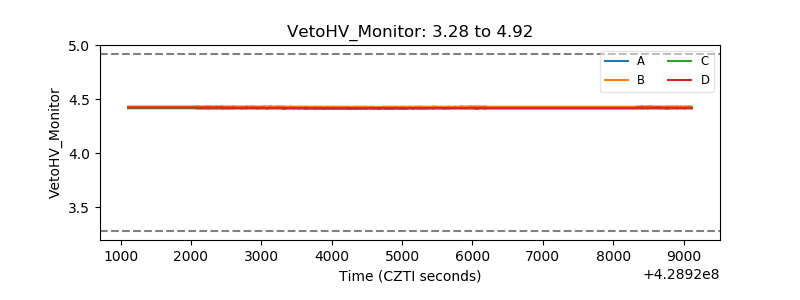 |
| Veto LLD | 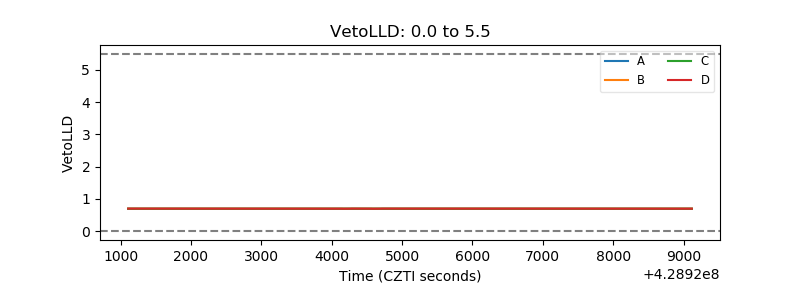 |
| Alpha Counter | 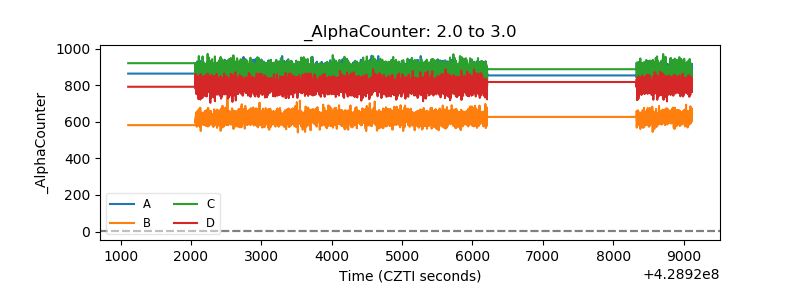 |
| _CPM_Rate | 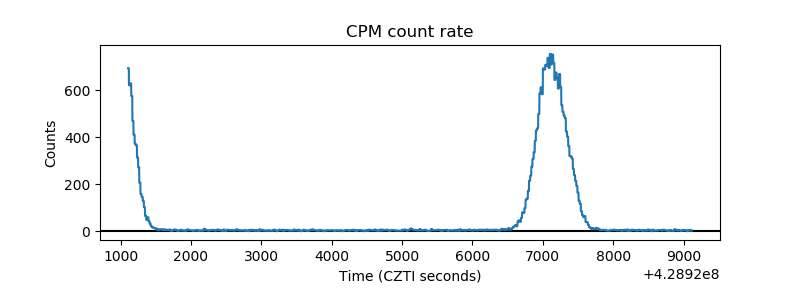 |
| CZT Counter | 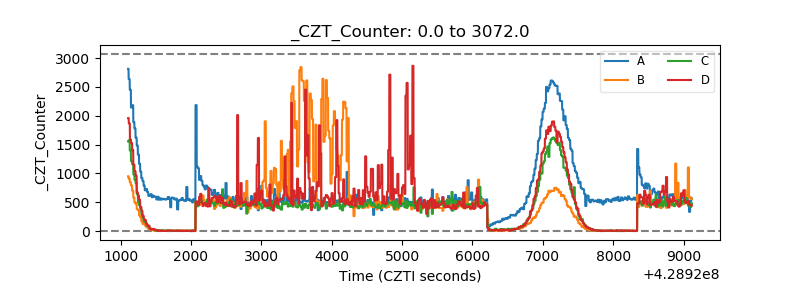 |
| +2.5 Volts monitor | 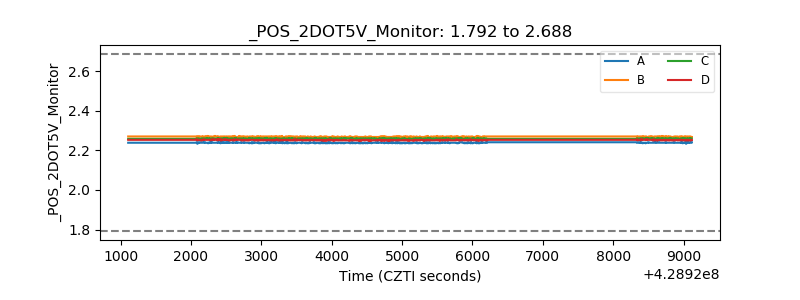 |
| +5 Volts monitor | 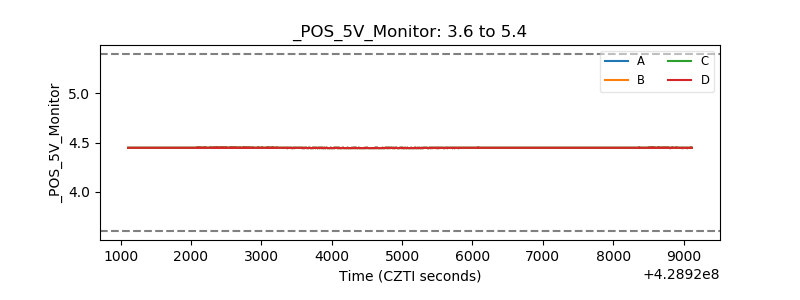 |
| _ROLL_ROT | 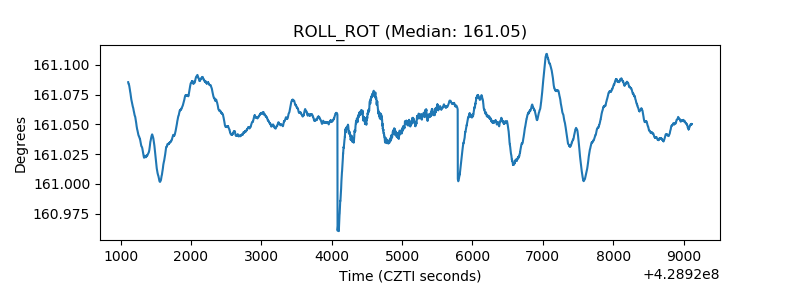 |
| _Roll_DEC | 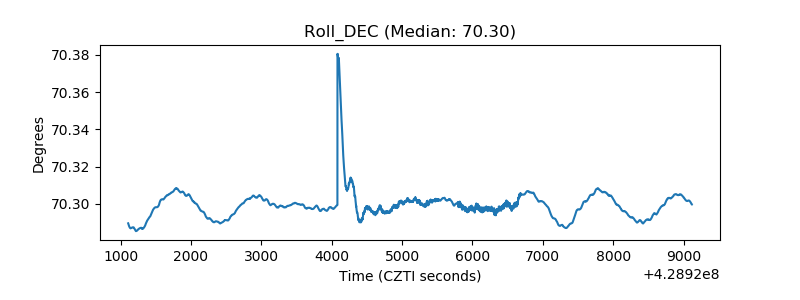 |
| _Roll_RA | 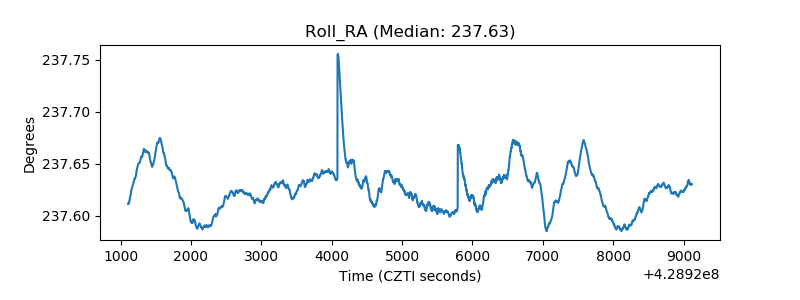 |
| Veto Counter | 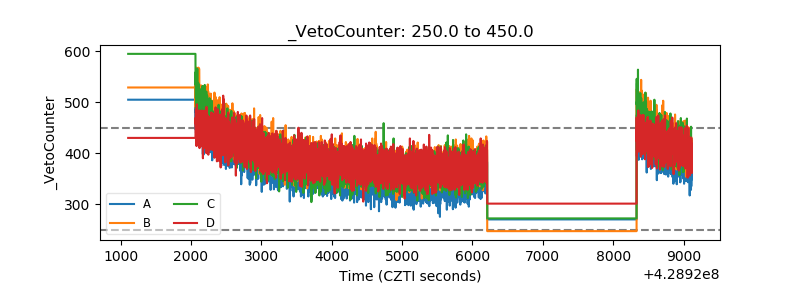 |