| Param | Original file | Final file |
|---|---|---|
| Filename | modeM0/AS1C07_001T10_9000005806_42461cztM0_level2.fits | modeM0/AS1C07_001T10_9000005806_42461cztM0_level2_quad_clean.evt |
| Size (bytes) | 371,736,000 | 88,361,280 |
| Size | 354.5 MB | 84.3 MB |
| Events in quadrant A | 2,952,636 | 613,388 |
| Events in quadrant B | 4,015,589 | 599,370 |
| Events in quadrant C | 2,459,662 | 582,031 |
| Events in quadrant D | 3,926,346 | 515,133 |
| Mode M9 | |||
|---|---|---|---|
| Quadrant | BADHDUFLAG | Total packets | Discarded packets |
| A | 0 | 26 | 0 |
| B | 0 | 27 | 0 |
| C | 0 | 27 | 0 |
| D | 0 | 27 | 0 |
| Mode SS | |||
|---|---|---|---|
| Quadrant | BADHDUFLAG | Total packets | Discarded packets |
| A | 0 | 106 | 0 |
| B | 0 | 106 | 0 |
| C | 0 | 106 | 0 |
| D | 0 | 106 | 0 |
| Mode M0 | |||
|---|---|---|---|
| Quadrant | BADHDUFLAG | Total packets | Discarded packets |
| A | 0 | 11813 | 2 |
| B | 0 | 15591 | 8 |
| C | 0 | 10615 | 2 |
| D | 0 | 15200 | 2 |
| Quadrant | Total seconds | Saturated seconds | Saturation percentage |
|---|---|---|---|
| A | 5221 | 14 | 0.268148% |
| B | 5220 | 173 | 3.314176% |
| C | 5220 | 3 | 0.057471% |
| D | 5220 | 430 | 8.237548% |
Noise dominated data is calculated using 1-second bins in cleaned event files. If a bin has >2000 counts, and if more than 50% of those come from <1% of pixels, then it is considered to be noise-dominated and hence unusable.
| Quadrant | # 1 sec bins | Bins with >0 counts | Bins with >2000 counts | High rate bins dominated by noise | Noise dominated (total time) | Noise dominated (detector-on time) | Marked lightcurve |
|---|---|---|---|---|---|---|---|
| A | 7343 | 5222 | 3 | 3 | 0.04% | 0.06% | 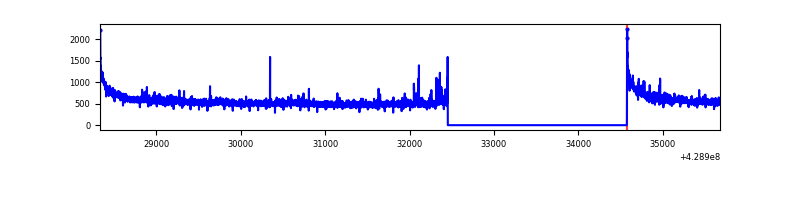 |
| B | 7342 | 5221 | 159 | 159 | 2.17% | 3.05% | 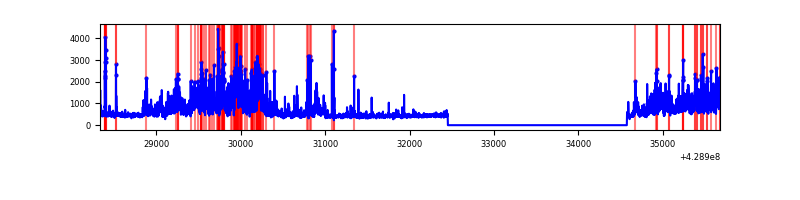 |
| C | 7342 | 5221 | 1 | 1 | 0.01% | 0.02% | 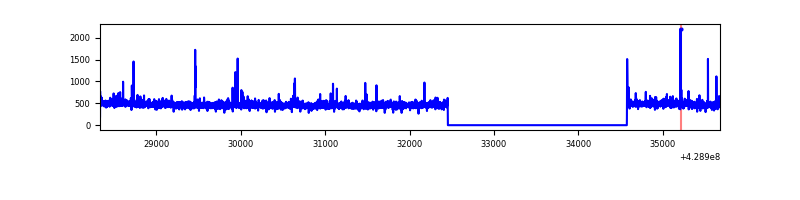 |
| D | 7342 | 5221 | 370 | 370 | 5.04% | 7.09% | 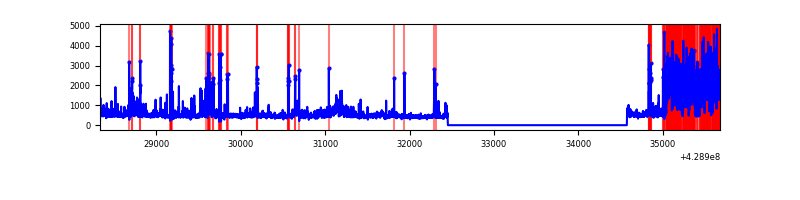 |
Top three noisy pixels from each quadrant. If the there are fewer than three noisy pixels in the level2.evt file, extra rows are filled as -1
| Pixel properties | Quadrant properties | ||||||
|---|---|---|---|---|---|---|---|
| Quadrant | DetID | PixID | Counts | Sigma | Mean | Median | Sigma |
| A | 10 | 83 | 625067 | 5318.93 | 572 | 561 | 117.4 |
| A | 12 | 189 | 44245 | 372.06 | 572 | 561 | 117.4 |
| A | 2 | 79 | 24862 | 206.97 | 572 | 561 | 117.4 |
| B | 0 | 186 | 1512393 | 14246.84 | 555 | 538 | 106.1 |
| B | 5 | 172 | 143419 | 1346.43 | 555 | 538 | 106.1 |
| B | 15 | 35 | 94604 | 886.42 | 555 | 538 | 106.1 |
| C | 15 | 214 | 221721 | 1736.18 | 552 | 555 | 127.4 |
| C | 14 | 32 | 16203 | 122.84 | 552 | 555 | 127.4 |
| C | 9 | 54 | 12788 | 96.03 | 552 | 555 | 127.4 |
| D | 12 | 233 | 1030318 | 7789.19 | 543 | 527 | 132.2 |
| D | 1 | 52 | 301632 | 2277.52 | 543 | 527 | 132.2 |
| D | 2 | 16 | 137323 | 1034.71 | 543 | 527 | 132.2 |
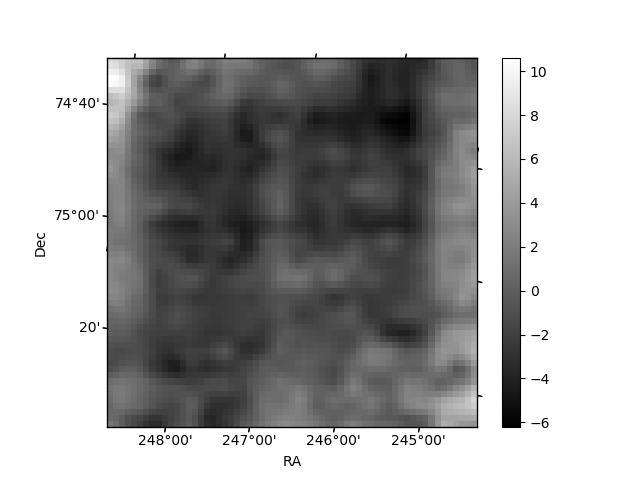
Histogram calculated using DETX and DETY for each event in the final _common_clean file
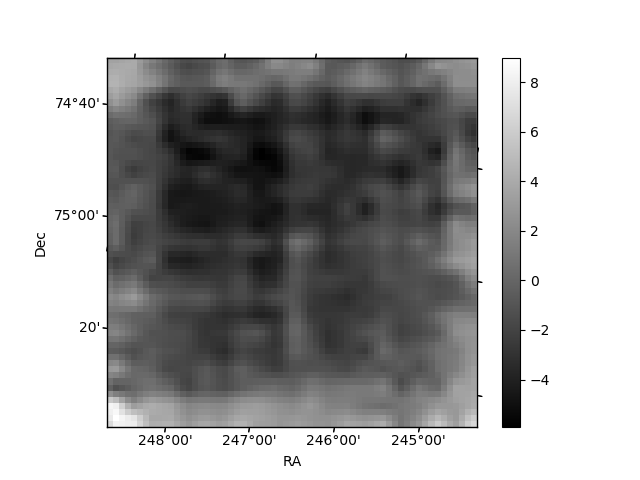
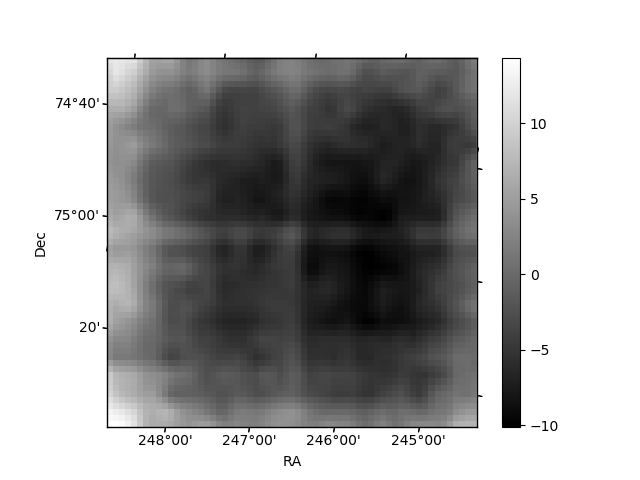
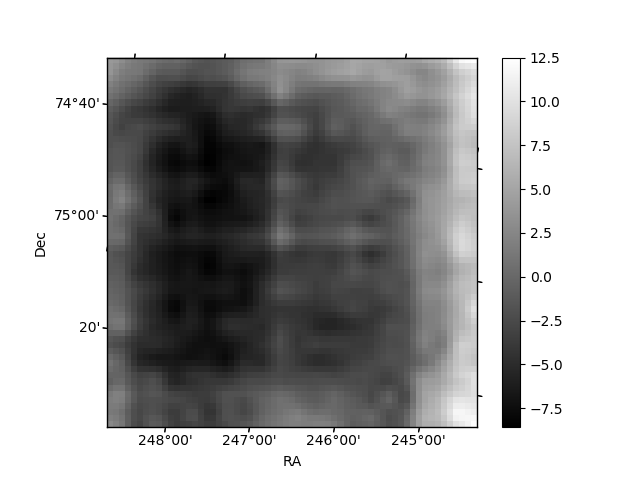
| Quadrant A |  |
 |
Quadrant B |
|---|---|---|---|
| Quadrant D |  |
 |
Quadrant C |
| Plot type | Count rate plots | Images |
|---|---|---|
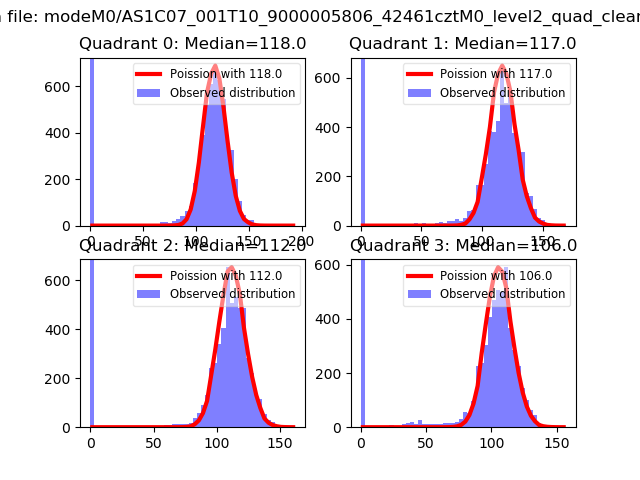
| Comparison with Poisson distribution Blue bars denote a histogram of data divided into 1 sec bins. Red curve is a Poisson curve with rate = median count rate of data. |
 |
 |
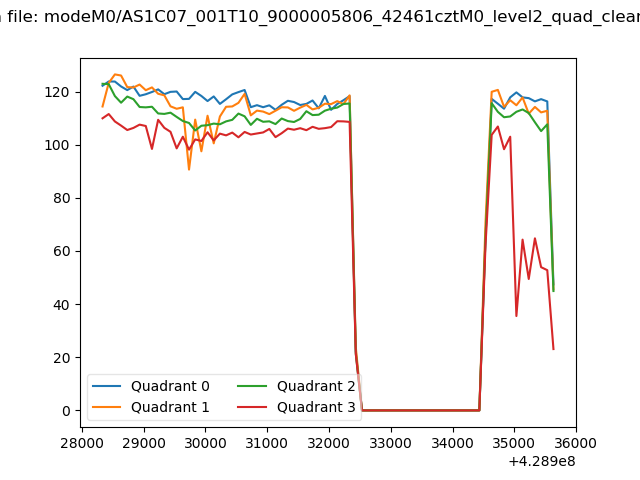
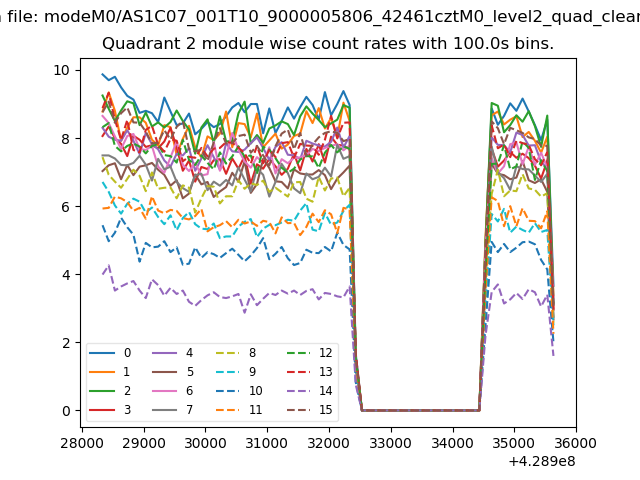
| Quadrant-wise count rates Data is divided into 100 sec bins |
 |
|
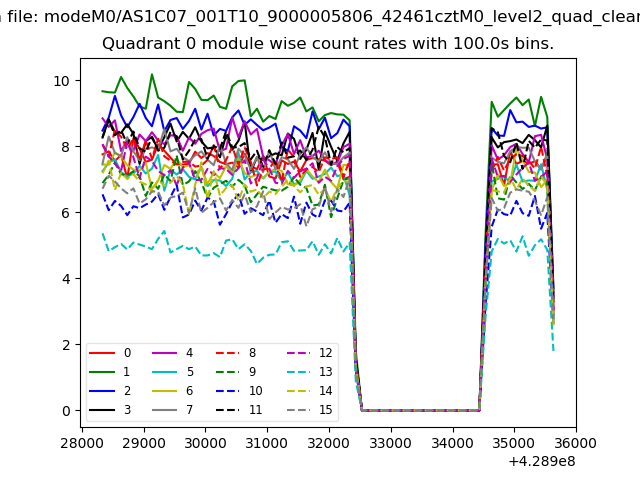
| Module-wise count rates for Quadrant A Data is divided into 100 sec bins |
 |
 |
| Module-wise count rates for Quadrant B Data is divided into 100 sec bins |
 |
 |
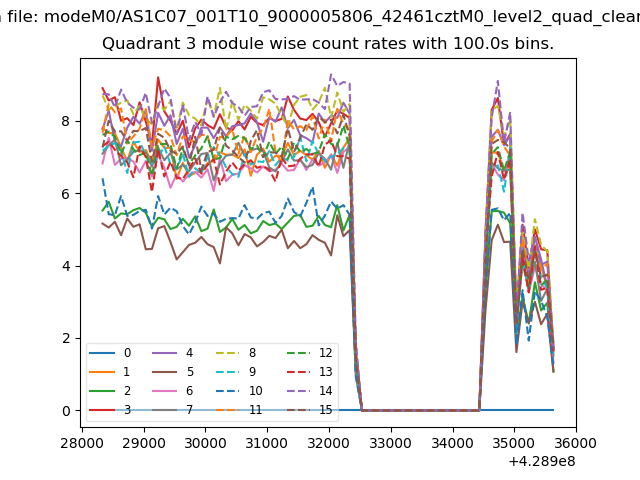
| Module-wise count rates for Quadrant C Data is divided into 100 sec bins |
 |
 |
| Module-wise count rates for Quadrant D Data is divided into 100 sec bins |
 |
 |
| Parameter | Plot |
|---|---|
| CZT HV Monitor | 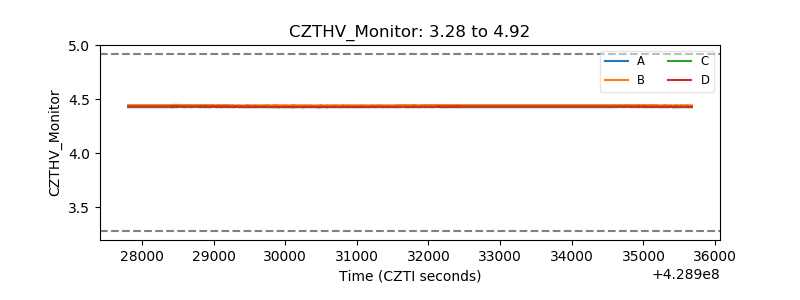 |
| D_VDD | 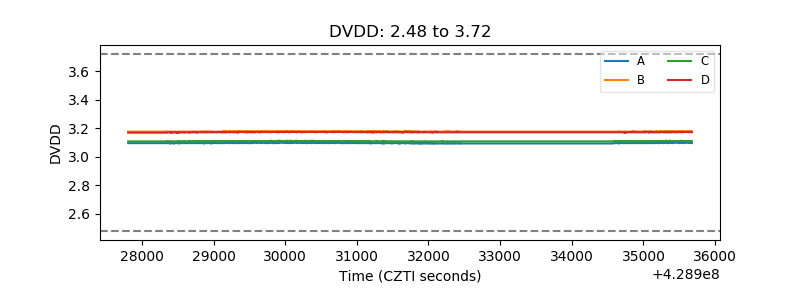 |
| Temperature 1 | 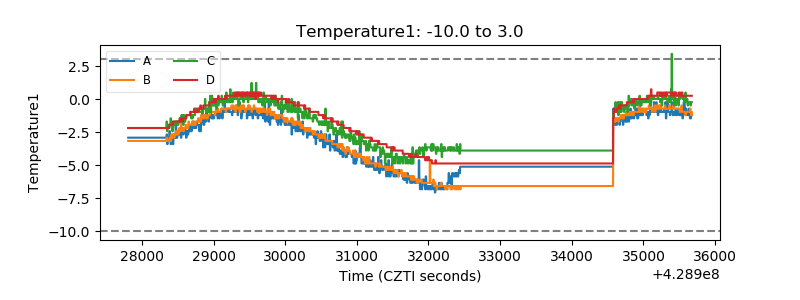 |
| Veto HV Monitor |  |
| Veto LLD | 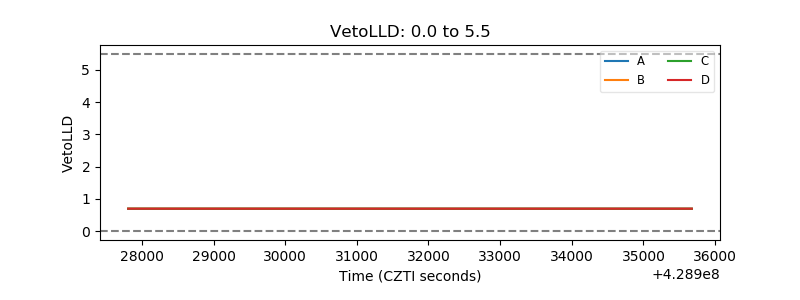 |
| Alpha Counter | 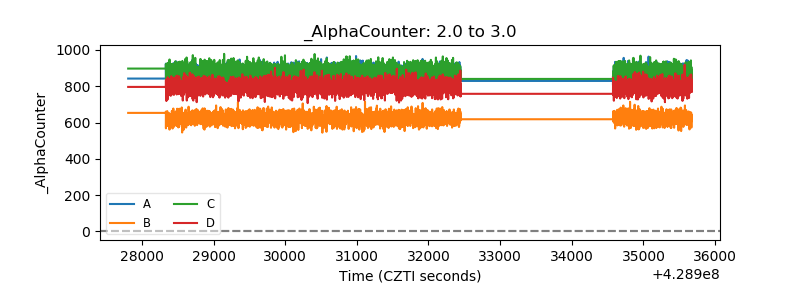 |
| _CPM_Rate | 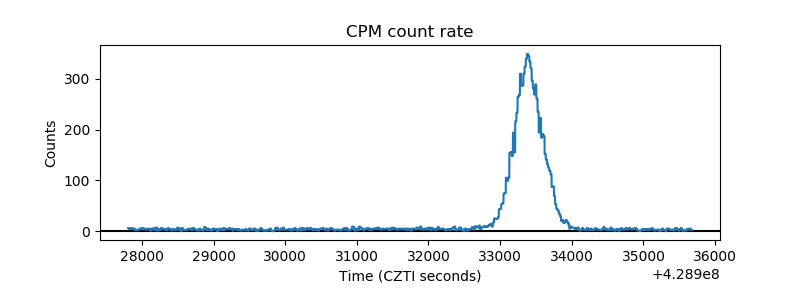 |
| CZT Counter | 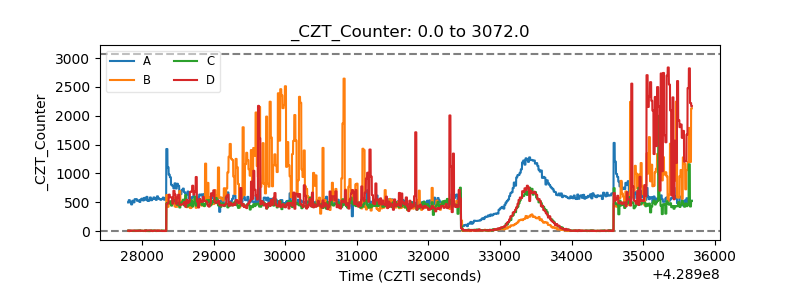 |
| +2.5 Volts monitor | 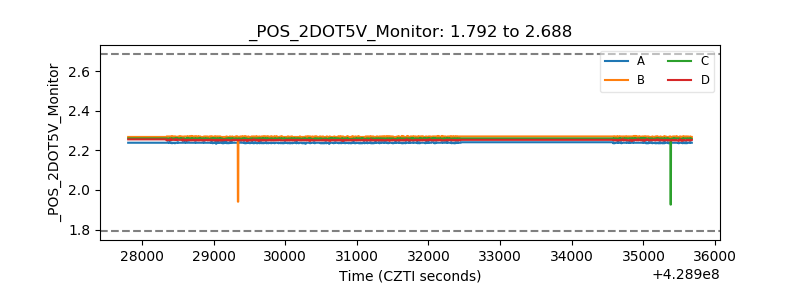 |
| +5 Volts monitor | 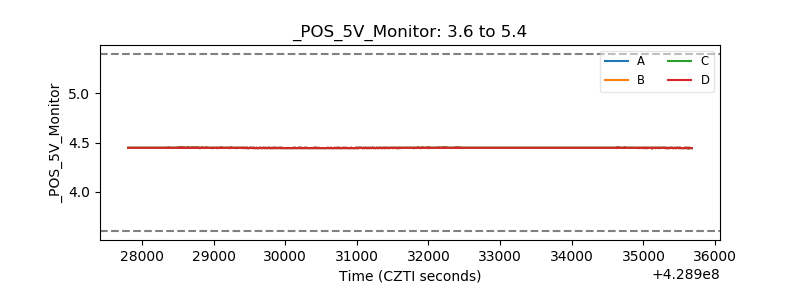 |
| _ROLL_ROT | 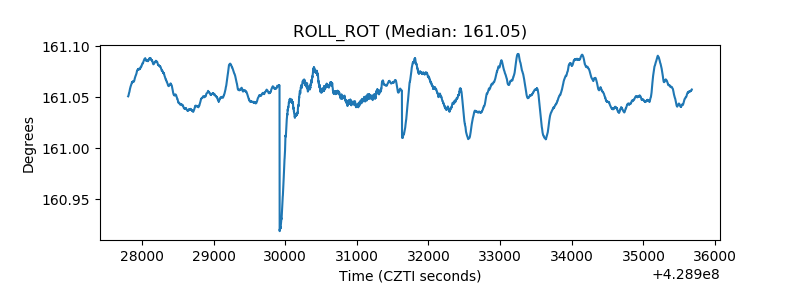 |
| _Roll_DEC | 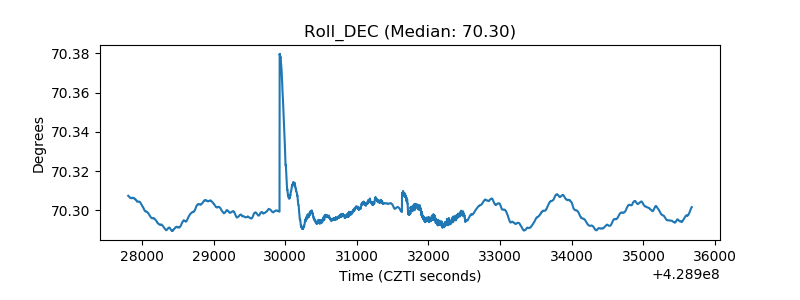 |
| _Roll_RA | 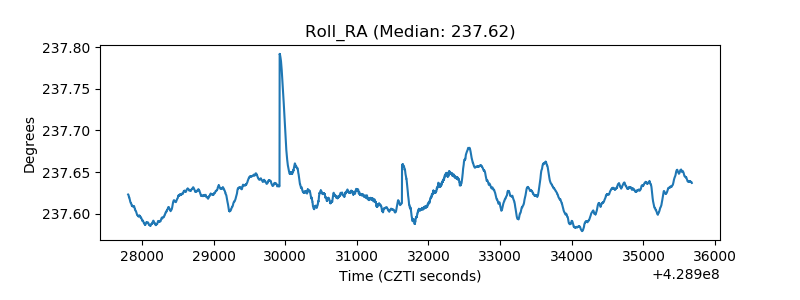 |
| Veto Counter | 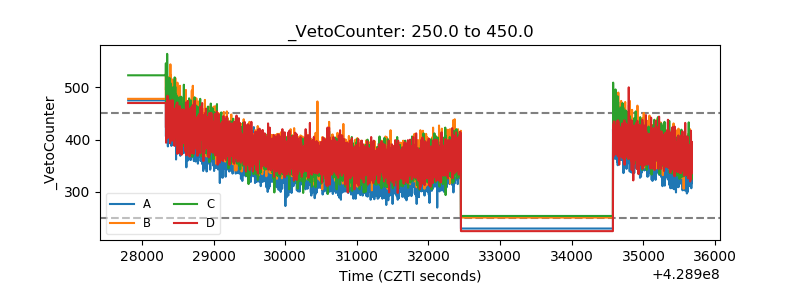 |