| Param | Original file | Final file |
|---|---|---|
| Filename | modeM0/AS1C07_001T10_9000005806_42462cztM0_level2.fits | modeM0/AS1C07_001T10_9000005806_42462cztM0_level2_quad_clean.evt |
| Size (bytes) | 378,172,800 | 76,633,920 |
| Size | 360.7 MB | 73.1 MB |
| Events in quadrant A | 2,660,579 | 544,602 |
| Events in quadrant B | 3,164,189 | 523,659 |
| Events in quadrant C | 2,230,971 | 513,705 |
| Events in quadrant D | 5,569,670 | 401,289 |
| Mode M9 | |||
|---|---|---|---|
| Quadrant | BADHDUFLAG | Total packets | Discarded packets |
| A | 0 | 20 | 0 |
| B | 0 | 20 | 0 |
| C | 0 | 20 | 0 |
| D | 0 | 20 | 0 |
| Mode SS | |||
|---|---|---|---|
| Quadrant | BADHDUFLAG | Total packets | Discarded packets |
| A | 0 | 100 | 0 |
| B | 0 | 100 | 0 |
| C | 0 | 100 | 0 |
| D | 0 | 100 | 0 |
| Mode M0 | |||
|---|---|---|---|
| Quadrant | BADHDUFLAG | Total packets | Discarded packets |
| A | 0 | 10756 | 1 |
| B | 0 | 12900 | 1 |
| C | 0 | 9817 | 1 |
| D | 0 | 19866 | 1 |
| Quadrant | Total seconds | Saturated seconds | Saturation percentage |
|---|---|---|---|
| A | 4793 | 8 | 0.166910% |
| B | 4793 | 176 | 3.672022% |
| C | 4793 | 7 | 0.146046% |
| D | 4792 | 1047 | 21.848915% |
Noise dominated data is calculated using 1-second bins in cleaned event files. If a bin has >2000 counts, and if more than 50% of those come from <1% of pixels, then it is considered to be noise-dominated and hence unusable.
| Quadrant | # 1 sec bins | Bins with >0 counts | Bins with >2000 counts | High rate bins dominated by noise | Noise dominated (total time) | Noise dominated (detector-on time) | Marked lightcurve |
|---|---|---|---|---|---|---|---|
| A | 6824 | 4794 | 3 | 3 | 0.04% | 0.06% | 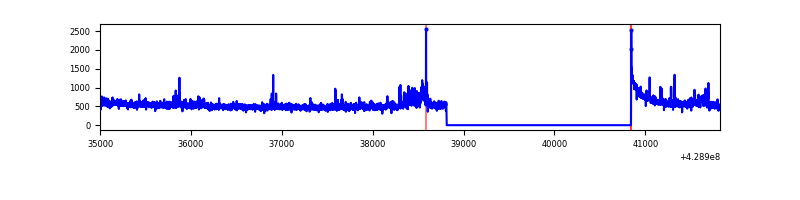 |
| B | 6824 | 4794 | 148 | 148 | 2.17% | 3.09% | 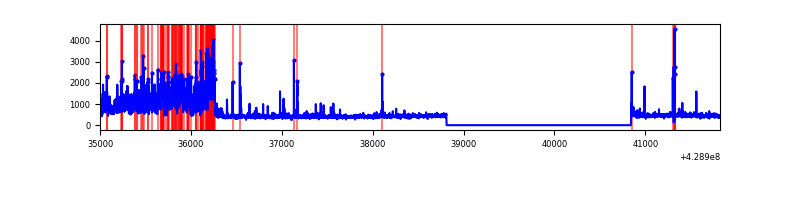 |
| C | 6824 | 4794 | 6 | 6 | 0.09% | 0.13% | 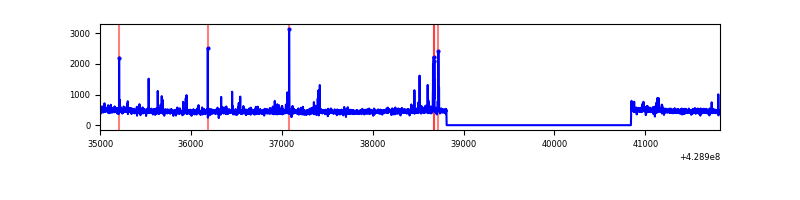 |
| D | 6823 | 4793 | 962 | 962 | 14.10% | 20.07% | 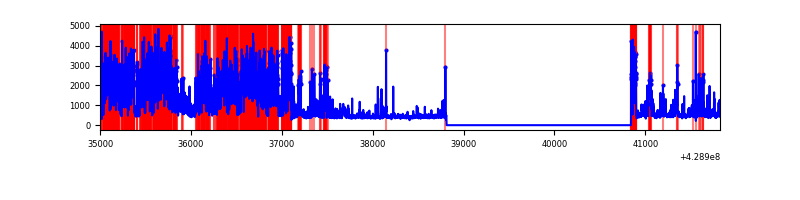 |
Top three noisy pixels from each quadrant. If the there are fewer than three noisy pixels in the level2.evt file, extra rows are filled as -1
| Pixel properties | Quadrant properties | ||||||
|---|---|---|---|---|---|---|---|
| Quadrant | DetID | PixID | Counts | Sigma | Mean | Median | Sigma |
| A | 10 | 83 | 507544 | 4908.66 | 505 | 494 | 103.3 |
| A | 12 | 189 | 117241 | 1130.2 | 505 | 494 | 103.3 |
| A | 13 | 248 | 60039 | 576.44 | 505 | 494 | 103.3 |
| B | 0 | 186 | 1044936 | 11171.03 | 493 | 481 | 93.5 |
| B | 4 | 141 | 44302 | 468.69 | 493 | 481 | 93.5 |
| B | 5 | 255 | 35801 | 377.77 | 493 | 481 | 93.5 |
| C | 15 | 214 | 198740 | 1711.51 | 494 | 496 | 115.8 |
| C | 14 | 254 | 61506 | 526.72 | 494 | 496 | 115.8 |
| C | 9 | 54 | 16735 | 140.2 | 494 | 496 | 115.8 |
| D | 12 | 233 | 2954798 | 26162.16 | 458 | 443 | 112.9 |
| D | 1 | 52 | 326556 | 2887.88 | 458 | 443 | 112.9 |
| D | 2 | 249 | 167565 | 1479.94 | 458 | 443 | 112.9 |
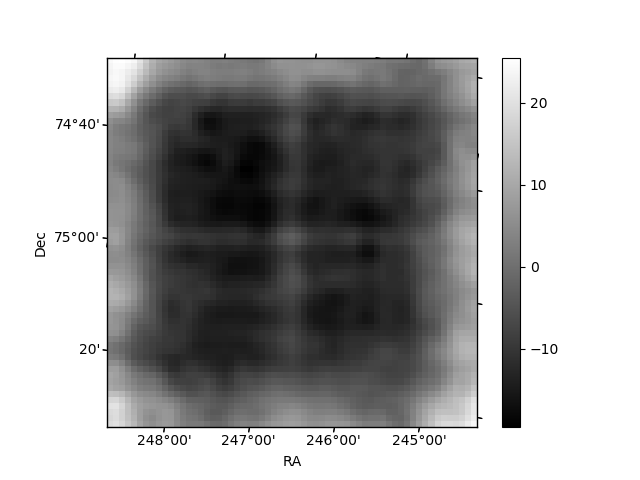
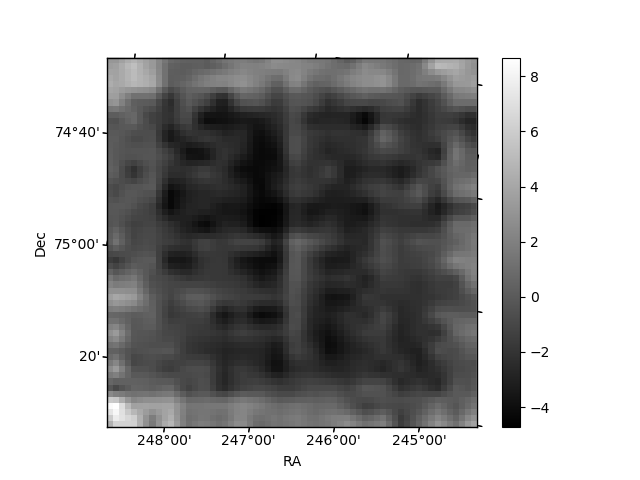
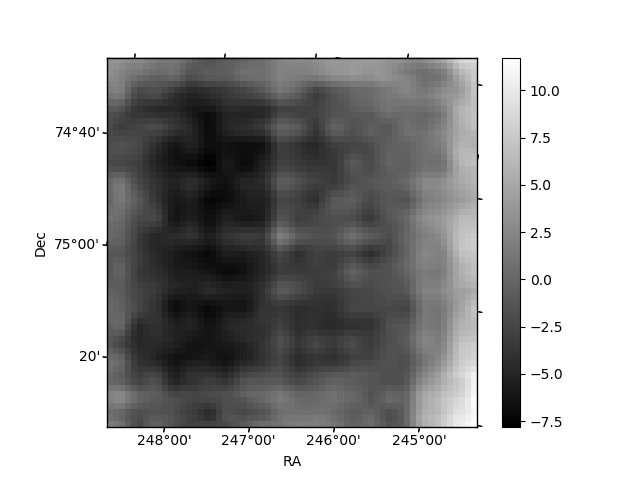
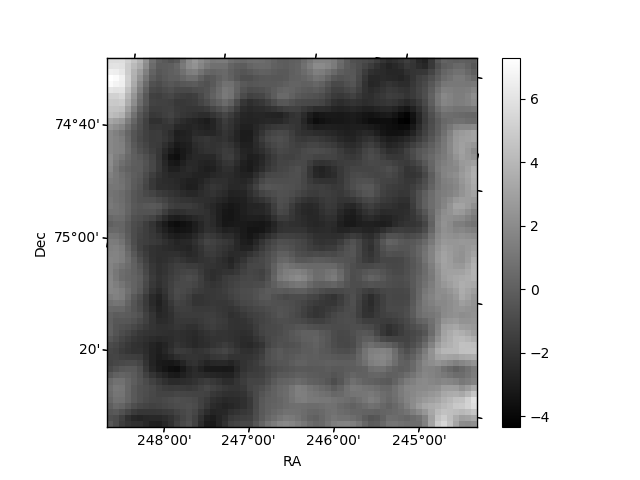
Histogram calculated using DETX and DETY for each event in the final _common_clean file
| Quadrant A | 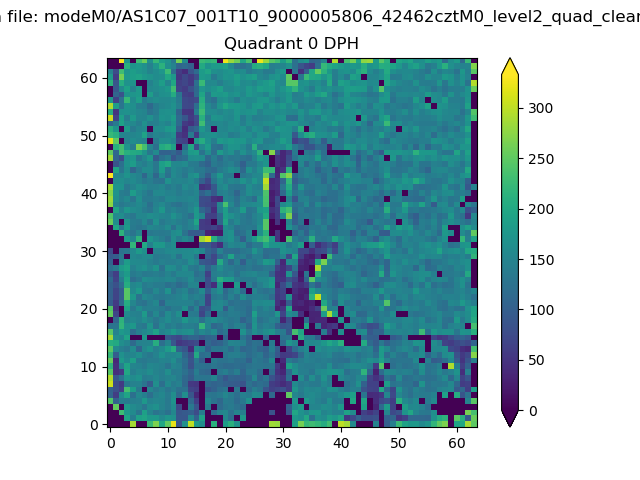 |
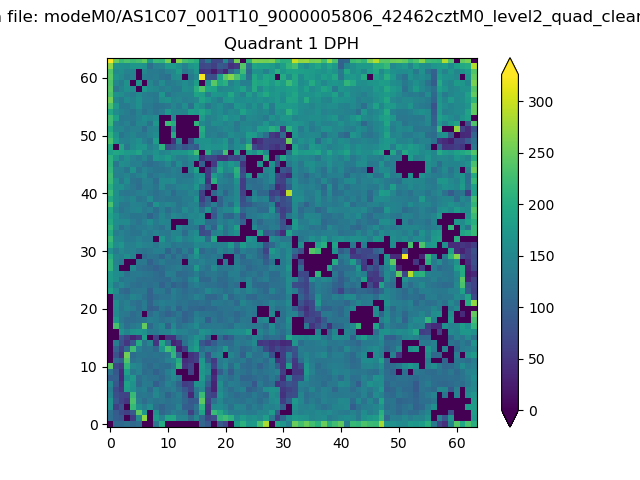 |
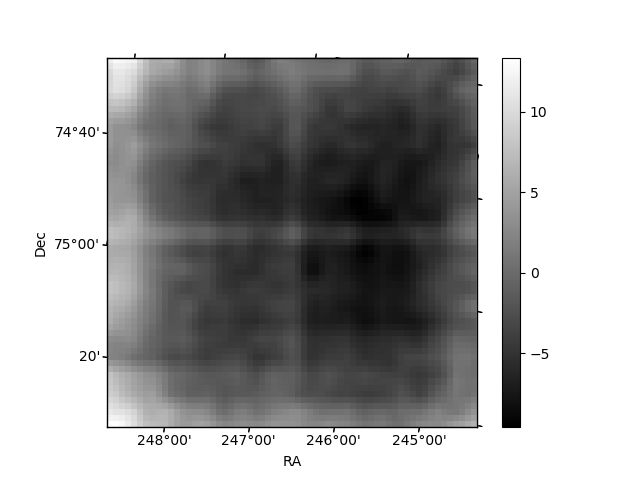
Quadrant B |
|---|---|---|---|
| Quadrant D | 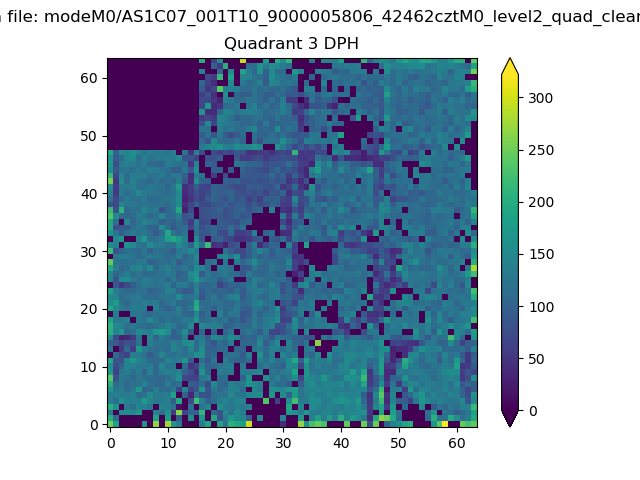 |
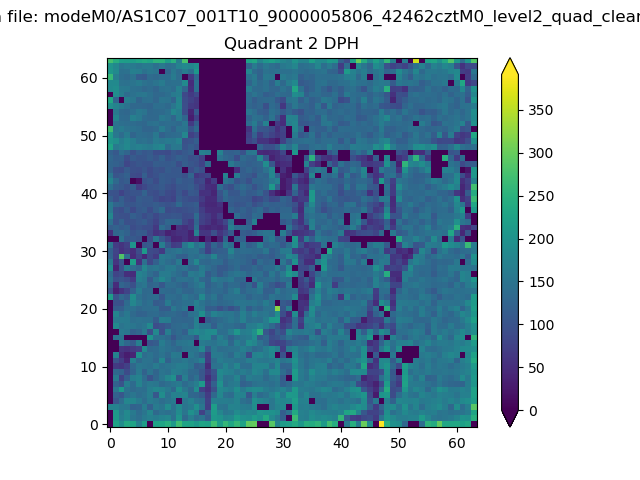 |
Quadrant C |
| Plot type | Count rate plots | Images |
|---|---|---|
| Comparison with Poisson distribution Blue bars denote a histogram of data divided into 1 sec bins. Red curve is a Poisson curve with rate = median count rate of data. |
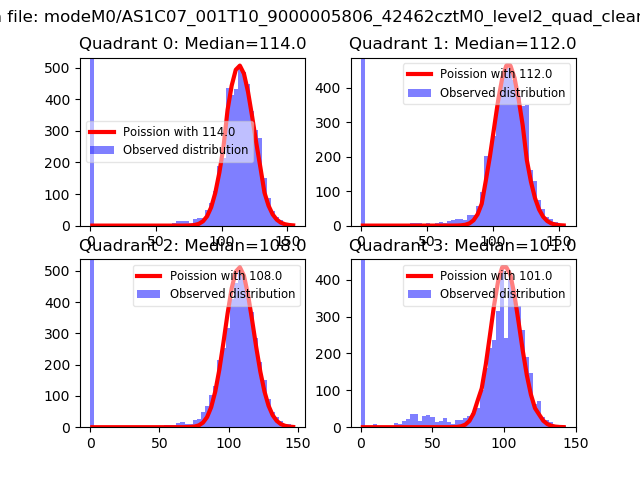 |
 |
| Quadrant-wise count rates Data is divided into 100 sec bins |
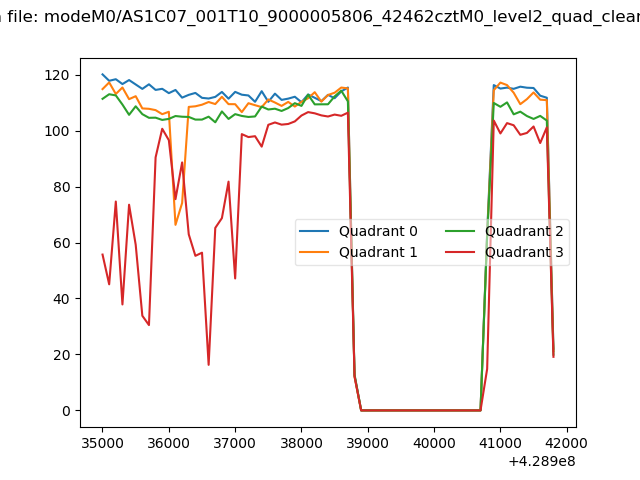 |
|
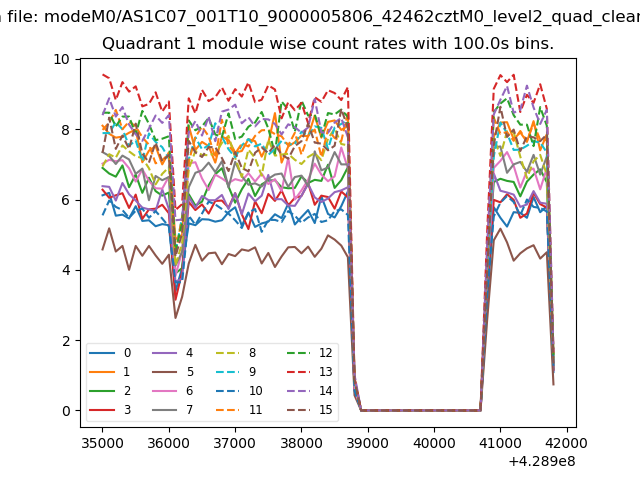
| Module-wise count rates for Quadrant A Data is divided into 100 sec bins |
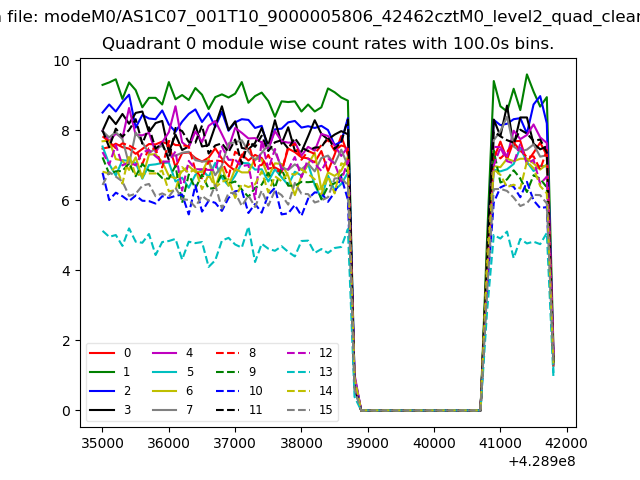 |
 |
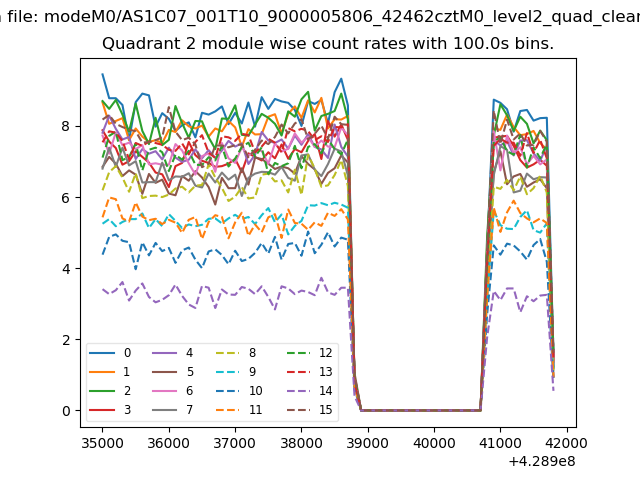
| Module-wise count rates for Quadrant B Data is divided into 100 sec bins |
 |
 |
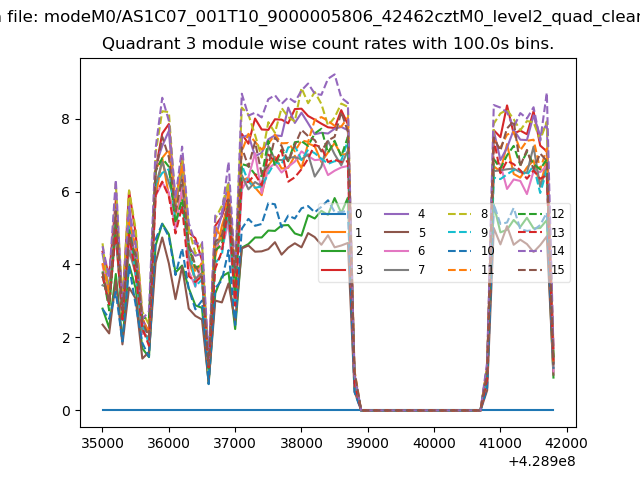
| Module-wise count rates for Quadrant C Data is divided into 100 sec bins |
 |
 |
| Module-wise count rates for Quadrant D Data is divided into 100 sec bins |
 |
 |
| Parameter | Plot |
|---|---|
| CZT HV Monitor | 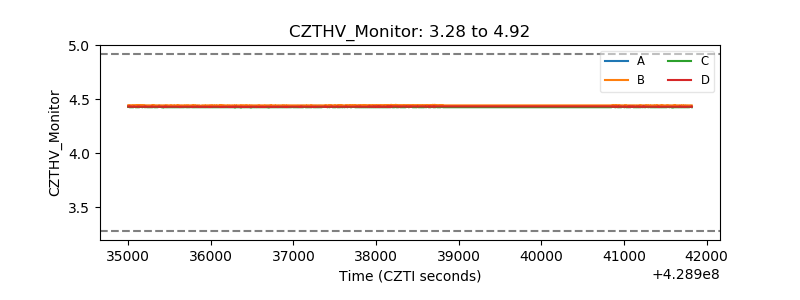 |
| D_VDD | 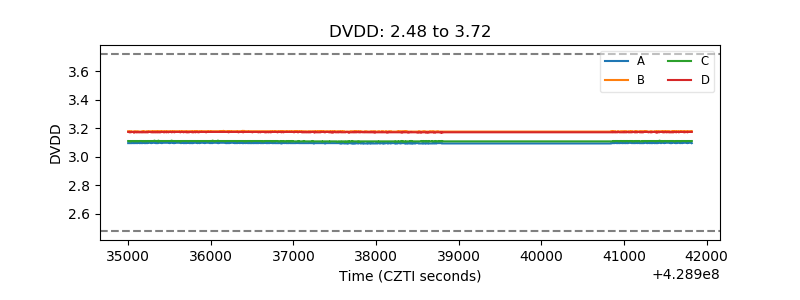 |
| Temperature 1 | 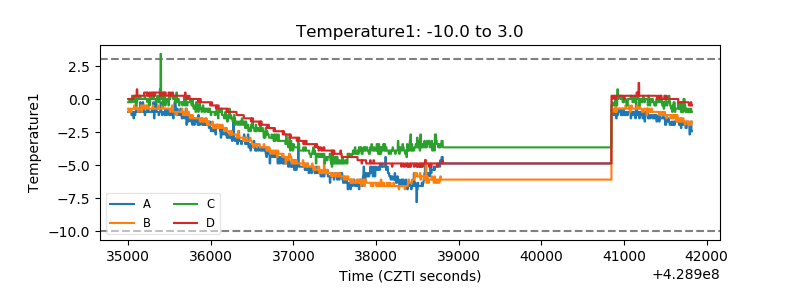 |
| Veto HV Monitor | 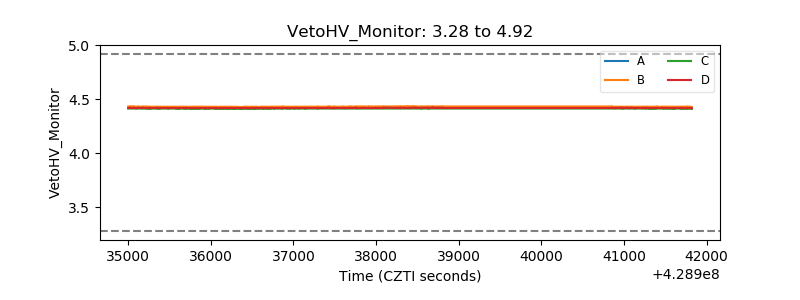 |
| Veto LLD | 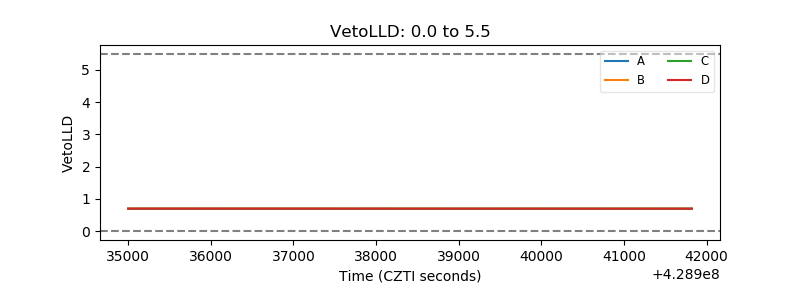 |
| Alpha Counter | 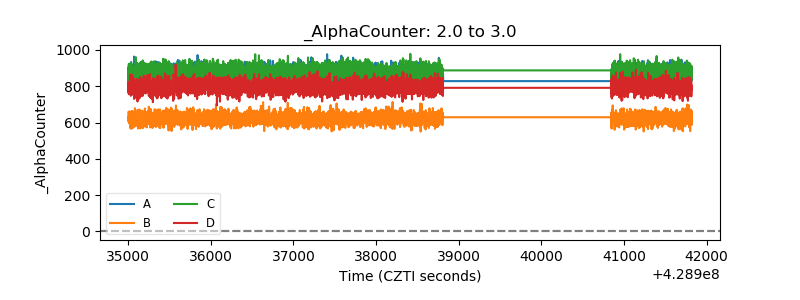 |
| _CPM_Rate | 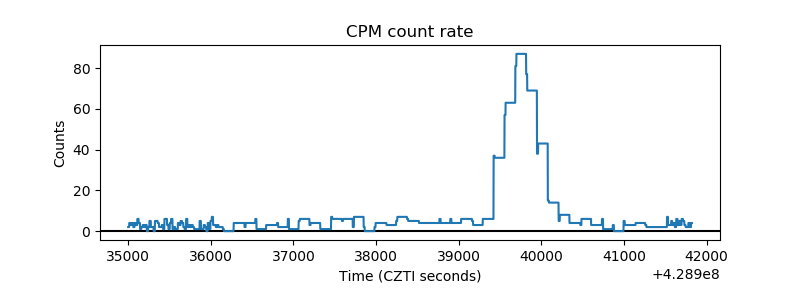 |
| CZT Counter | 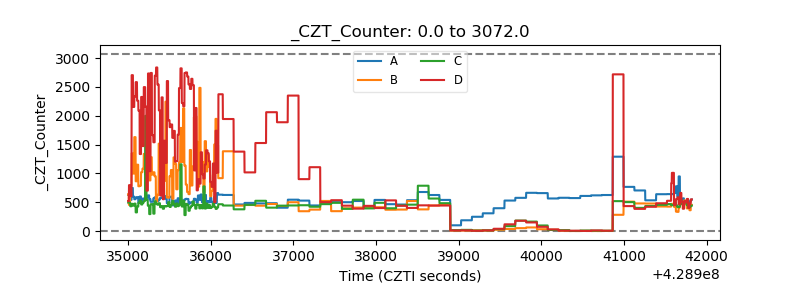 |
| +2.5 Volts monitor |  |
| +5 Volts monitor | 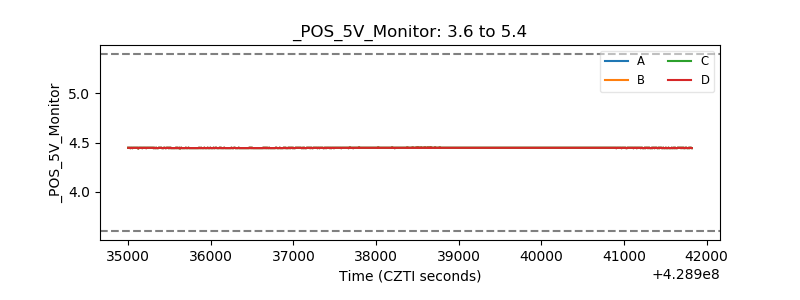 |
| _ROLL_ROT | 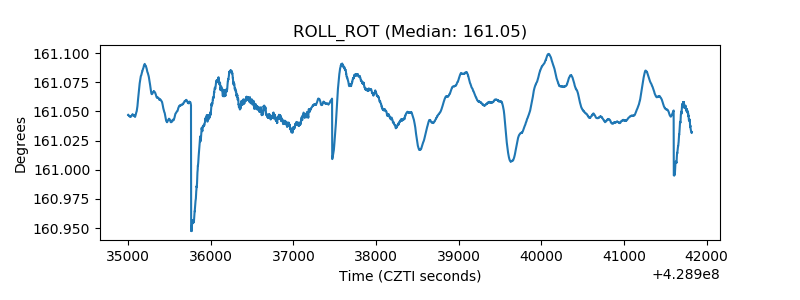 |
| _Roll_DEC | 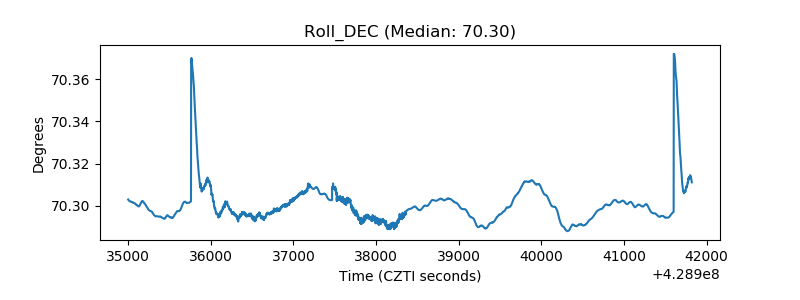 |
| _Roll_RA | 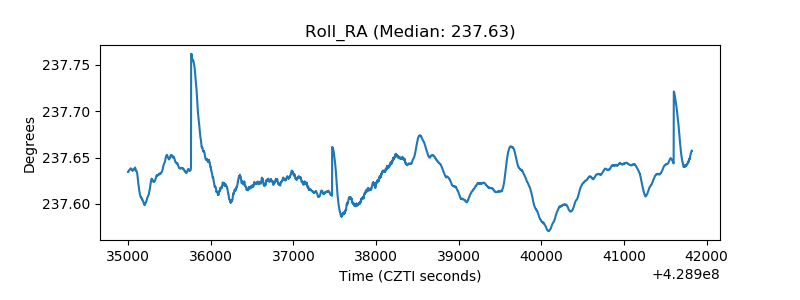 |
| Veto Counter | 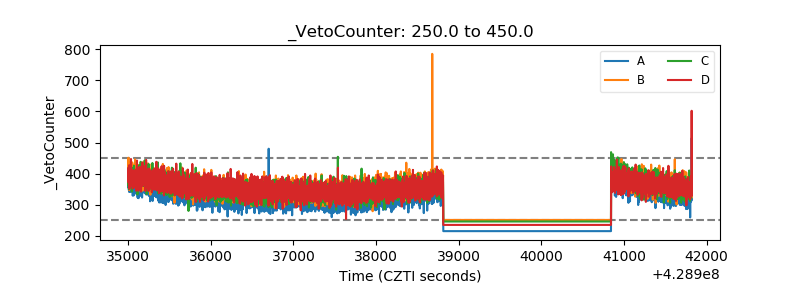 |