| Param | Original file | Final file |
|---|---|---|
| Filename | modeM0/AS1C07_001T10_9000005806_42463cztM0_level2.fits | modeM0/AS1C07_001T10_9000005806_42463cztM0_level2_quad_clean.evt |
| Size (bytes) | 349,090,560 | 86,325,120 |
| Size | 332.9 MB | 82.3 MB |
| Events in quadrant A | 2,985,120 | 593,042 |
| Events in quadrant B | 2,838,293 | 581,773 |
| Events in quadrant C | 3,387,657 | 535,456 |
| Events in quadrant D | 3,291,300 | 526,502 |
| Mode M9 | |||
|---|---|---|---|
| Quadrant | BADHDUFLAG | Total packets | Discarded packets |
| A | 0 | 23 | 0 |
| B | 0 | 24 | 0 |
| C | 0 | 24 | 0 |
| D | 0 | 24 | 0 |
| Mode SS | |||
|---|---|---|---|
| Quadrant | BADHDUFLAG | Total packets | Discarded packets |
| A | 0 | 108 | 0 |
| B | 0 | 108 | 0 |
| C | 0 | 108 | 0 |
| D | 0 | 108 | 0 |
| Mode M0 | |||
|---|---|---|---|
| Quadrant | BADHDUFLAG | Total packets | Discarded packets |
| A | 0 | 12201 | 2 |
| B | 0 | 12333 | 2 |
| C | 0 | 13702 | 2 |
| D | 0 | 13640 | 2 |
| Quadrant | Total seconds | Saturated seconds | Saturation percentage |
|---|---|---|---|
| A | 5390 | 13 | 0.241187% |
| B | 5390 | 94 | 1.743970% |
| C | 5390 | 299 | 5.547310% |
| D | 5390 | 157 | 2.912801% |
Noise dominated data is calculated using 1-second bins in cleaned event files. If a bin has >2000 counts, and if more than 50% of those come from <1% of pixels, then it is considered to be noise-dominated and hence unusable.
| Quadrant | # 1 sec bins | Bins with >0 counts | Bins with >2000 counts | High rate bins dominated by noise | Noise dominated (total time) | Noise dominated (detector-on time) | Marked lightcurve |
|---|---|---|---|---|---|---|---|
| A | 7153 | 5391 | 5 | 5 | 0.07% | 0.09% | 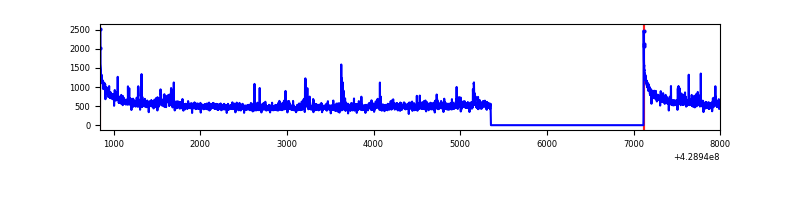 |
| B | 7153 | 5391 | 72 | 72 | 1.01% | 1.34% | 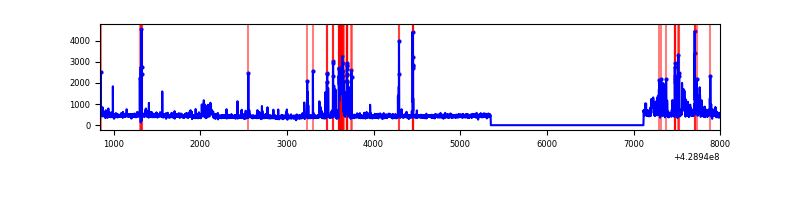 |
| C | 7153 | 5391 | 241 | 241 | 3.37% | 4.47% | 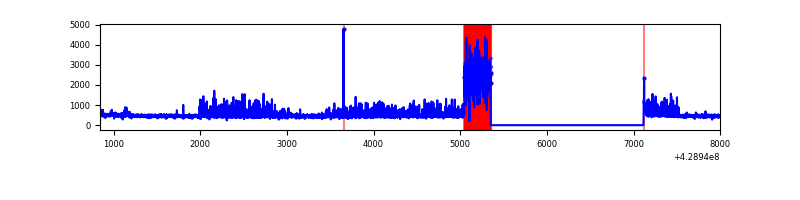 |
| D | 7153 | 5391 | 141 | 141 | 1.97% | 2.62% | 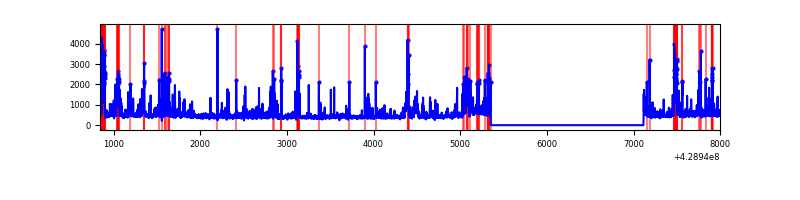 |
Top three noisy pixels from each quadrant. If the there are fewer than three noisy pixels in the level2.evt file, extra rows are filled as -1
| Pixel properties | Quadrant properties | ||||||
|---|---|---|---|---|---|---|---|
| Quadrant | DetID | PixID | Counts | Sigma | Mean | Median | Sigma |
| A | 10 | 83 | 628518 | 5513.01 | 563 | 551 | 113.9 |
| A | 12 | 189 | 110425 | 964.6 | 563 | 551 | 113.9 |
| A | 15 | 223 | 29354 | 252.87 | 563 | 551 | 113.9 |
| B | 15 | 35 | 298413 | 2807.33 | 553 | 539 | 106.1 |
| B | 0 | 186 | 98432 | 922.6 | 553 | 539 | 106.1 |
| B | 5 | 255 | 96744 | 906.69 | 553 | 539 | 106.1 |
| C | 9 | 54 | 652101 | 5240.67 | 532 | 535 | 124.3 |
| C | 10 | 34 | 398779 | 3203.15 | 532 | 535 | 124.3 |
| C | 15 | 214 | 221876 | 1780.29 | 532 | 535 | 124.3 |
| D | 1 | 47 | 257316 | 1904.17 | 549 | 534 | 134.9 |
| D | 1 | 52 | 205841 | 1522.45 | 549 | 534 | 134.9 |
| D | 12 | 233 | 167006 | 1234.47 | 549 | 534 | 134.9 |
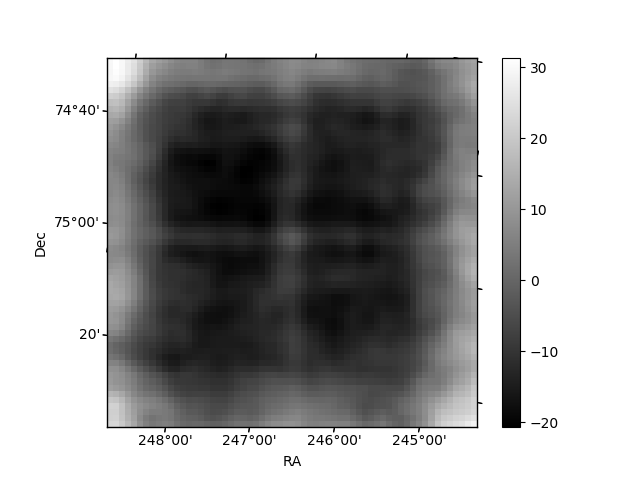
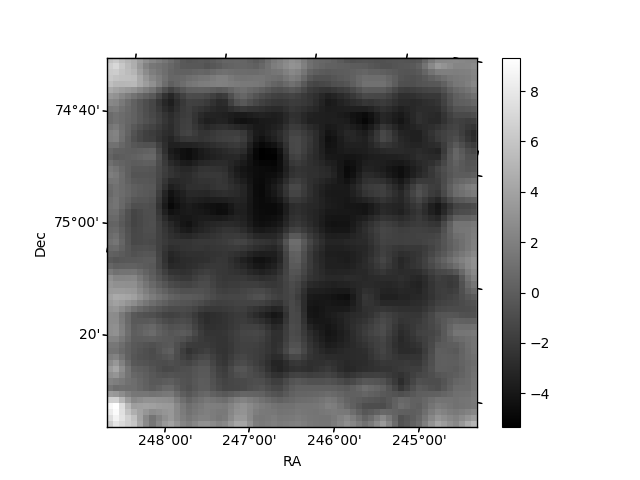
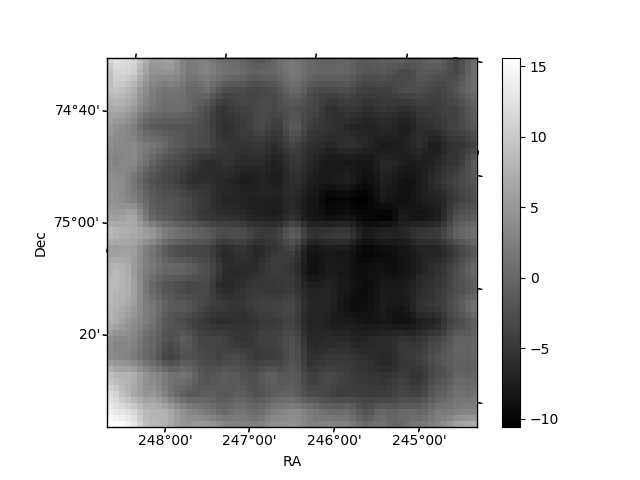
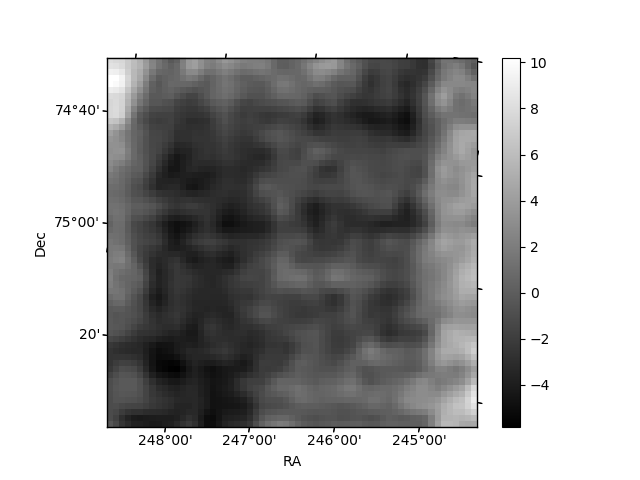
Histogram calculated using DETX and DETY for each event in the final _common_clean file
| Quadrant A | 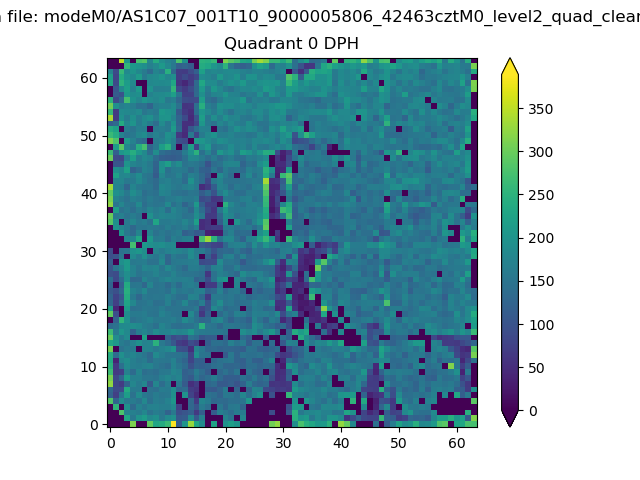 |
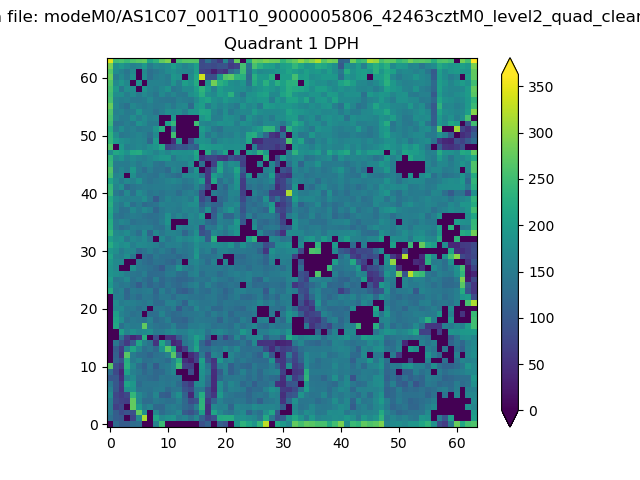 |
Quadrant B |
|---|---|---|---|
| Quadrant D | 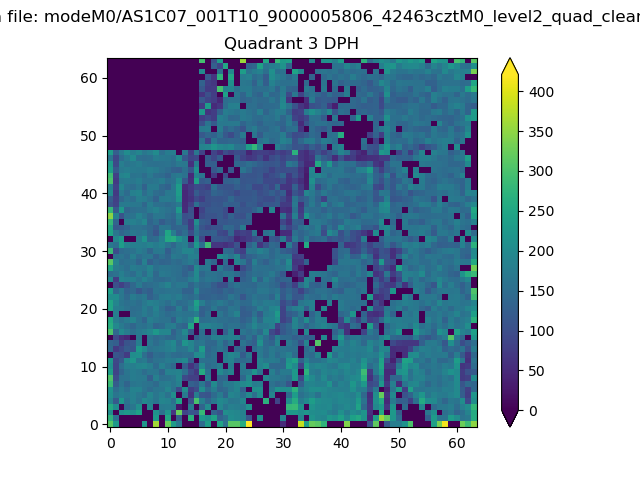 |
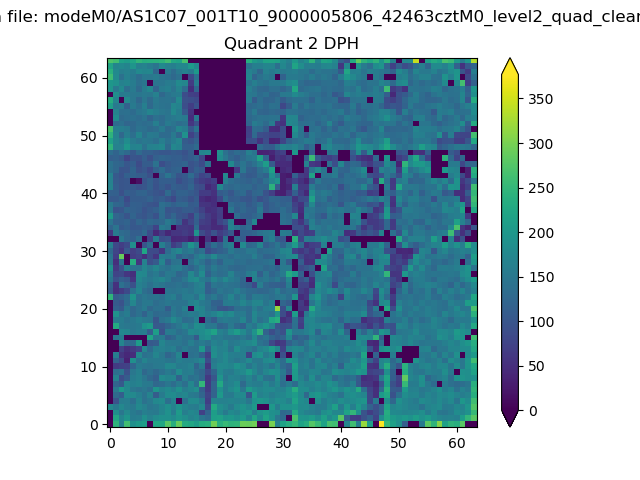 |
Quadrant C |
| Plot type | Count rate plots | Images |
|---|---|---|
| Comparison with Poisson distribution Blue bars denote a histogram of data divided into 1 sec bins. Red curve is a Poisson curve with rate = median count rate of data. |
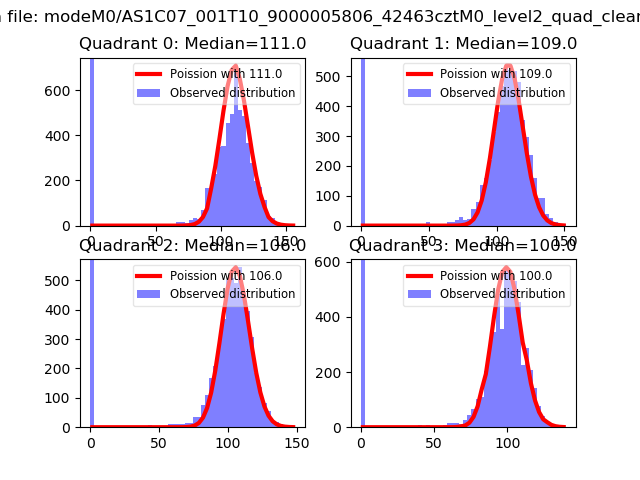 |
 |
| Quadrant-wise count rates Data is divided into 100 sec bins |
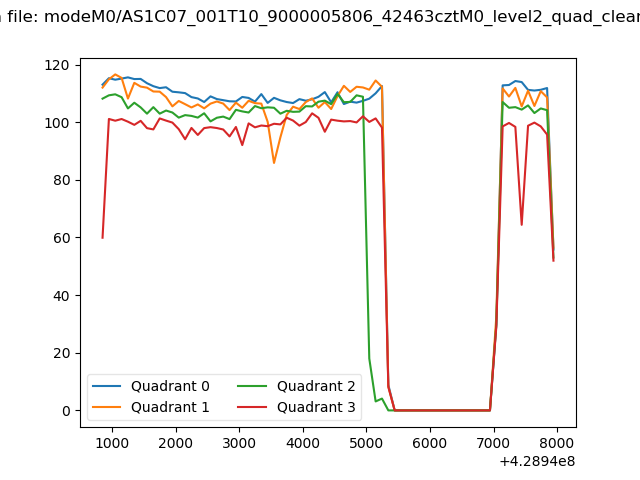 |
|
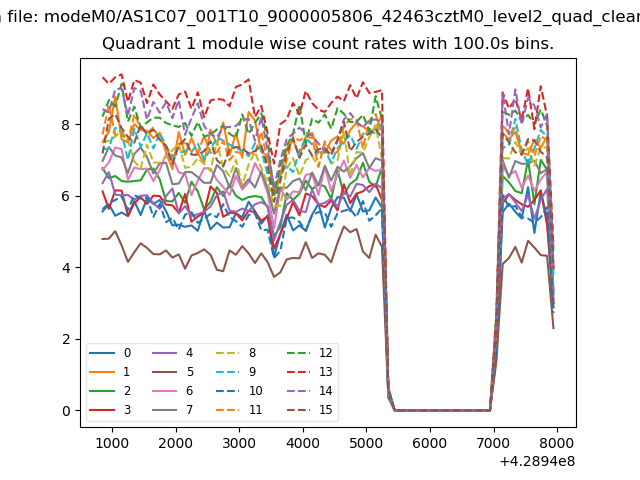
| Module-wise count rates for Quadrant A Data is divided into 100 sec bins |
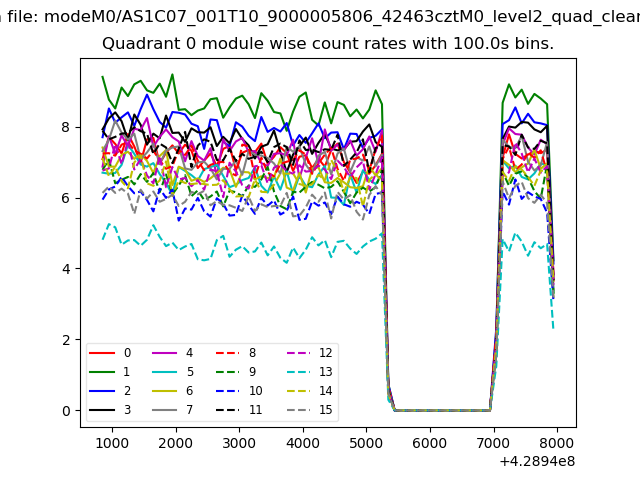 |
 |
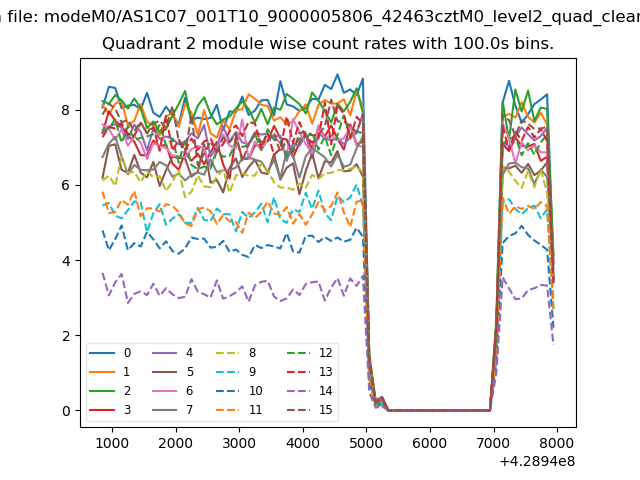
| Module-wise count rates for Quadrant B Data is divided into 100 sec bins |
 |
 |
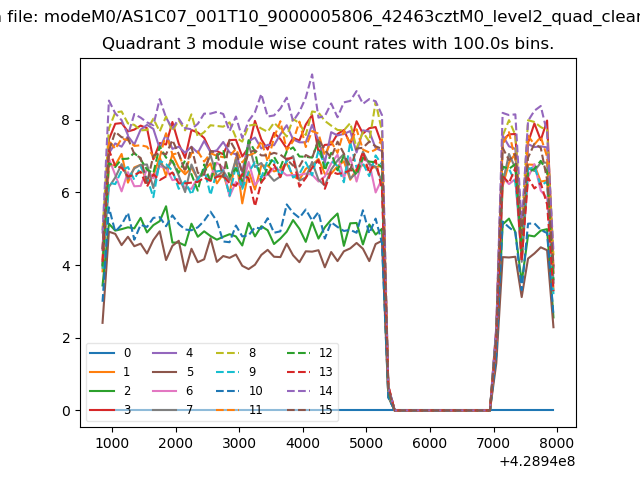
| Module-wise count rates for Quadrant C Data is divided into 100 sec bins |
 |
 |
| Module-wise count rates for Quadrant D Data is divided into 100 sec bins |
 |
 |
| Parameter | Plot |
|---|---|
| CZT HV Monitor |  |
| D_VDD | 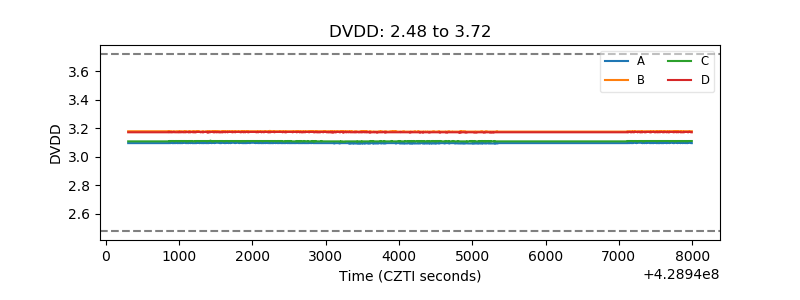 |
| Temperature 1 | 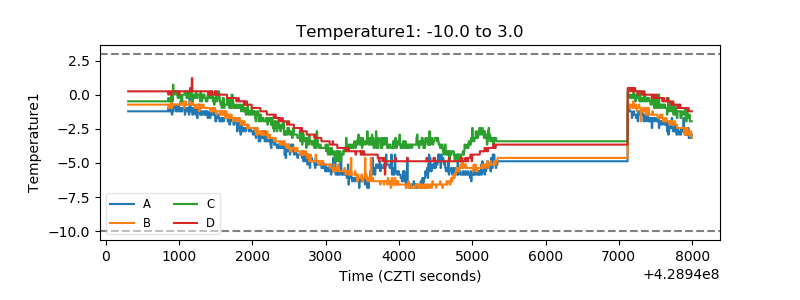 |
| Veto HV Monitor | 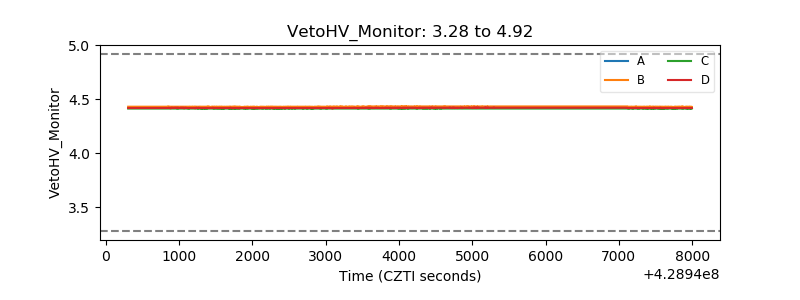 |
| Veto LLD | 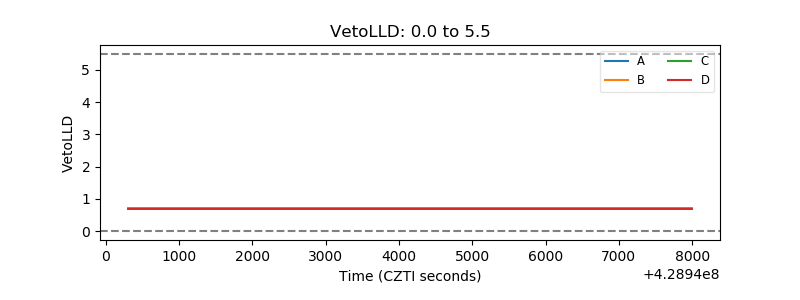 |
| Alpha Counter | 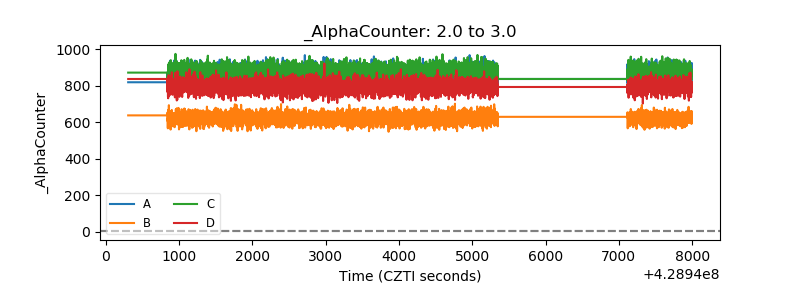 |
| _CPM_Rate | 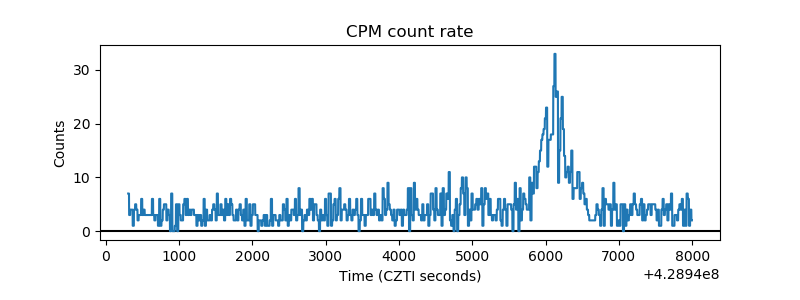 |
| CZT Counter | 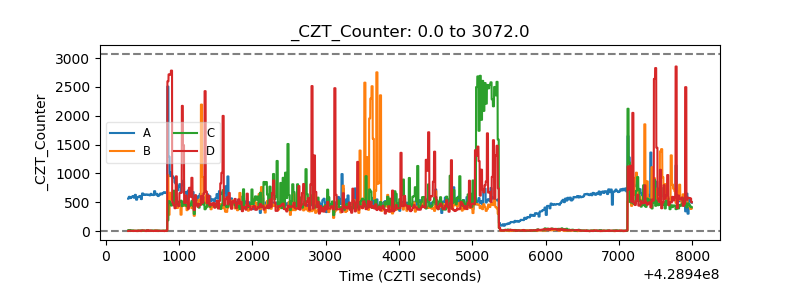 |
| +2.5 Volts monitor | 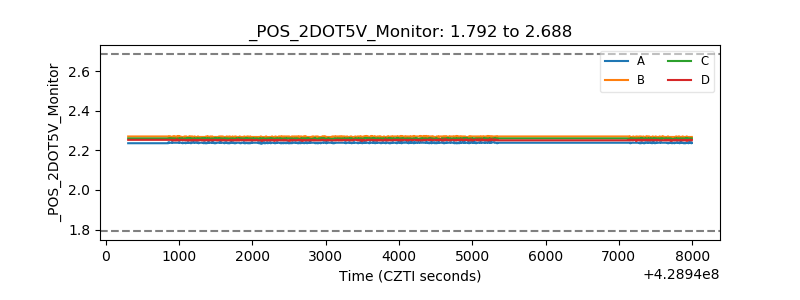 |
| +5 Volts monitor |  |
| _ROLL_ROT | 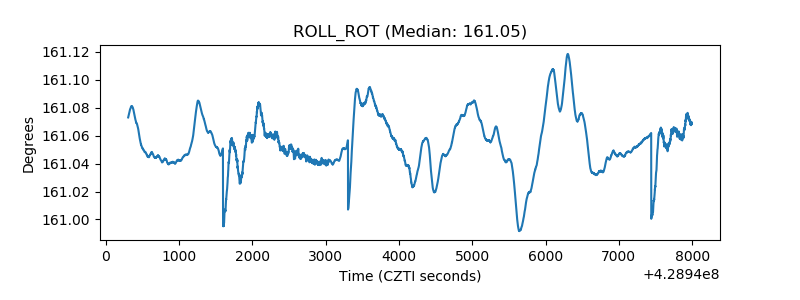 |
| _Roll_DEC | 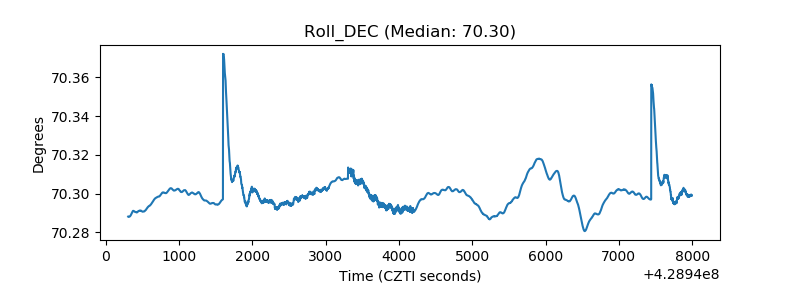 |
| _Roll_RA | 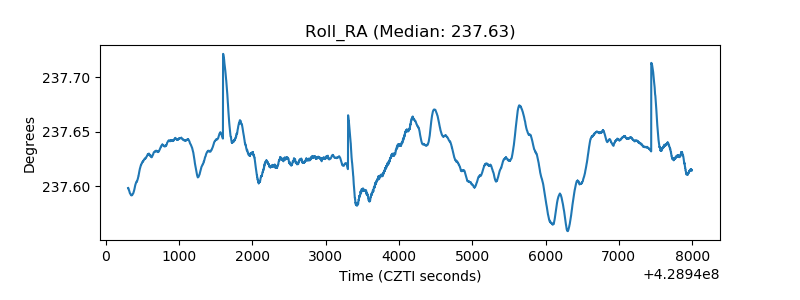 |
| Veto Counter | 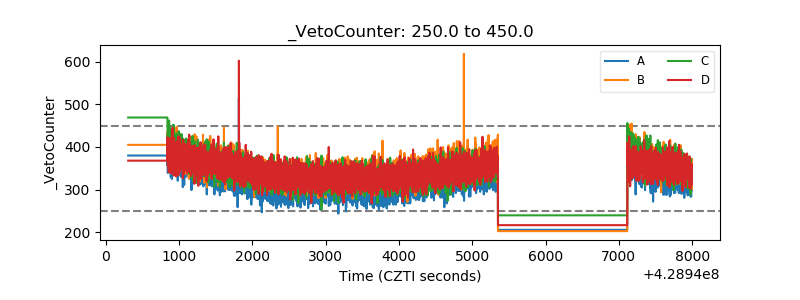 |