| Param | Original file | Final file |
|---|---|---|
| Filename | modeM0/AS1C07_001T10_9000005806_42464cztM0_level2.fits | modeM0/AS1C07_001T10_9000005806_42464cztM0_level2_quad_clean.evt |
| Size (bytes) | 365,728,320 | 88,873,920 |
| Size | 348.8 MB | 84.8 MB |
| Events in quadrant A | 3,049,543 | 603,401 |
| Events in quadrant B | 2,661,741 | 596,951 |
| Events in quadrant C | 3,169,905 | 576,891 |
| Events in quadrant D | 4,224,504 | 524,699 |
| Mode M9 | |||
|---|---|---|---|
| Quadrant | BADHDUFLAG | Total packets | Discarded packets |
| A | 0 | 19 | 0 |
| B | 0 | 20 | 0 |
| C | 0 | 20 | 0 |
| D | 0 | 20 | 0 |
| Mode SS | |||
|---|---|---|---|
| Quadrant | BADHDUFLAG | Total packets | Discarded packets |
| A | 0 | 114 | 0 |
| B | 0 | 114 | 0 |
| C | 0 | 114 | 0 |
| D | 0 | 114 | 0 |
| Mode M0 | |||
|---|---|---|---|
| Quadrant | BADHDUFLAG | Total packets | Discarded packets |
| A | 0 | 12477 | 2 |
| B | 0 | 12073 | 2 |
| C | 0 | 13299 | 2 |
| D | 0 | 16461 | 3 |
| Quadrant | Total seconds | Saturated seconds | Saturation percentage |
|---|---|---|---|
| A | 5555 | 17 | 0.306031% |
| B | 5555 | 43 | 0.774077% |
| C | 5555 | 87 | 1.566157% |
| D | 5554 | 374 | 6.733885% |
Noise dominated data is calculated using 1-second bins in cleaned event files. If a bin has >2000 counts, and if more than 50% of those come from <1% of pixels, then it is considered to be noise-dominated and hence unusable.
| Quadrant | # 1 sec bins | Bins with >0 counts | Bins with >2000 counts | High rate bins dominated by noise | Noise dominated (total time) | Noise dominated (detector-on time) | Marked lightcurve |
|---|---|---|---|---|---|---|---|
| A | 7018 | 5556 | 8 | 8 | 0.11% | 0.14% | 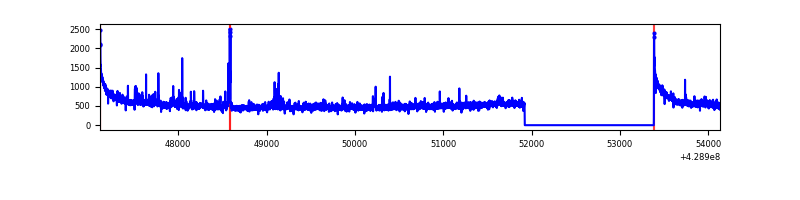 |
| B | 7018 | 5556 | 24 | 24 | 0.34% | 0.43% | 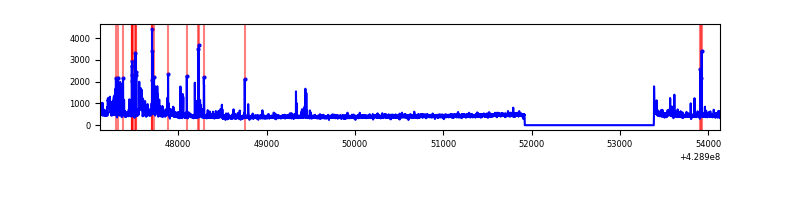 |
| C | 7018 | 5556 | 87 | 87 | 1.24% | 1.57% | 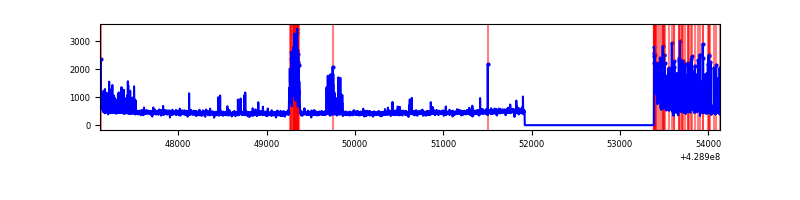 |
| D | 7017 | 5555 | 389 | 389 | 5.54% | 7.00% | 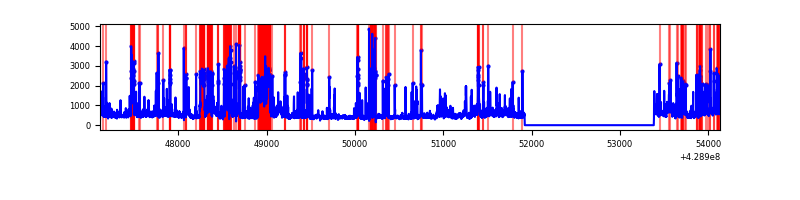 |
Top three noisy pixels from each quadrant. If the there are fewer than three noisy pixels in the level2.evt file, extra rows are filled as -1
| Pixel properties | Quadrant properties | ||||||
|---|---|---|---|---|---|---|---|
| Quadrant | DetID | PixID | Counts | Sigma | Mean | Median | Sigma |
| A | 10 | 83 | 629945 | 5257.56 | 580 | 568 | 119.7 |
| A | 12 | 189 | 73209 | 606.81 | 580 | 568 | 119.7 |
| A | 15 | 223 | 60976 | 504.62 | 580 | 568 | 119.7 |
| B | 5 | 255 | 114658 | 1037.02 | 572 | 557 | 110.0 |
| B | 0 | 186 | 94564 | 854.4 | 572 | 557 | 110.0 |
| B | 0 | 183 | 67943 | 612.45 | 572 | 557 | 110.0 |
| C | 10 | 34 | 536499 | 4053.27 | 563 | 566 | 132.2 |
| C | 15 | 214 | 230218 | 1736.86 | 563 | 566 | 132.2 |
| C | 14 | 254 | 180277 | 1359.16 | 563 | 566 | 132.2 |
| D | 2 | 16 | 784398 | 5696.91 | 558 | 541 | 137.6 |
| D | 1 | 52 | 278291 | 2018.63 | 558 | 541 | 137.6 |
| D | 13 | 249 | 251756 | 1825.78 | 558 | 541 | 137.6 |
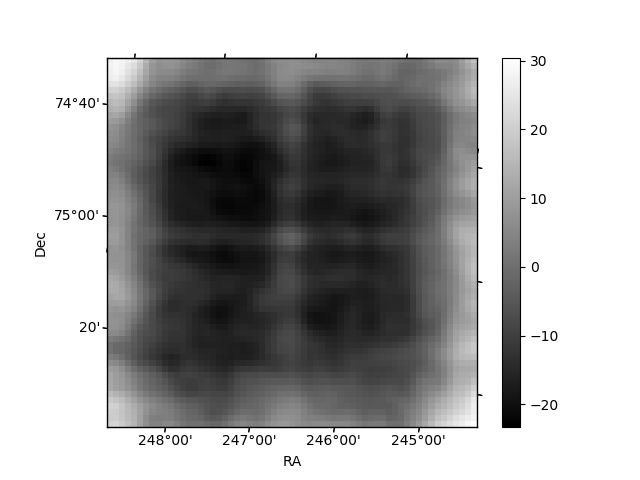
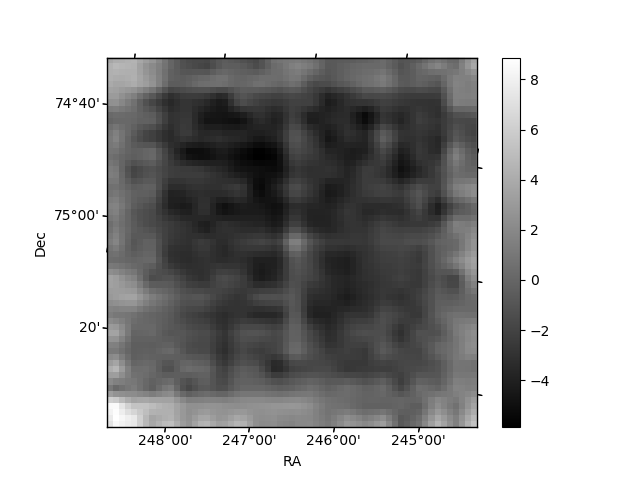
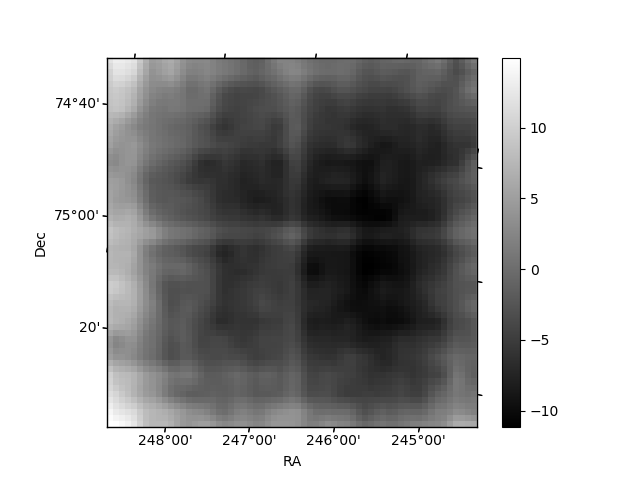
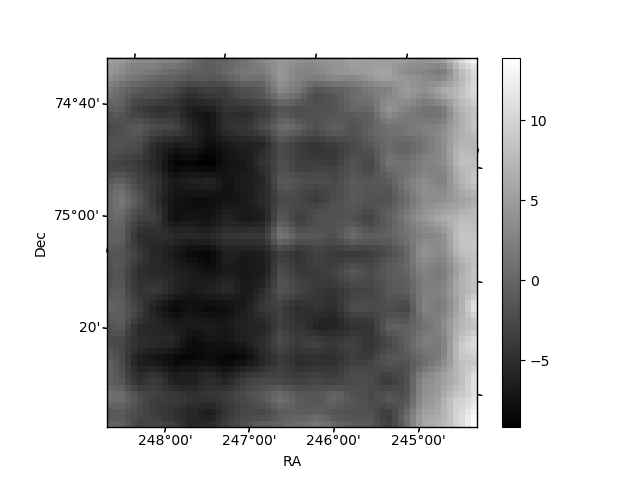
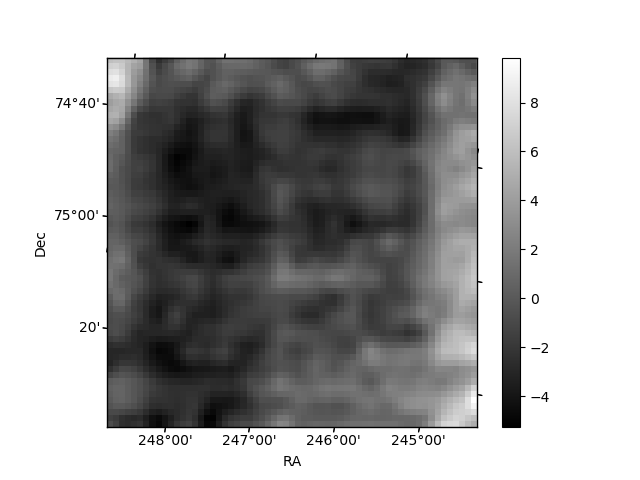
Histogram calculated using DETX and DETY for each event in the final _common_clean file
| Quadrant A | 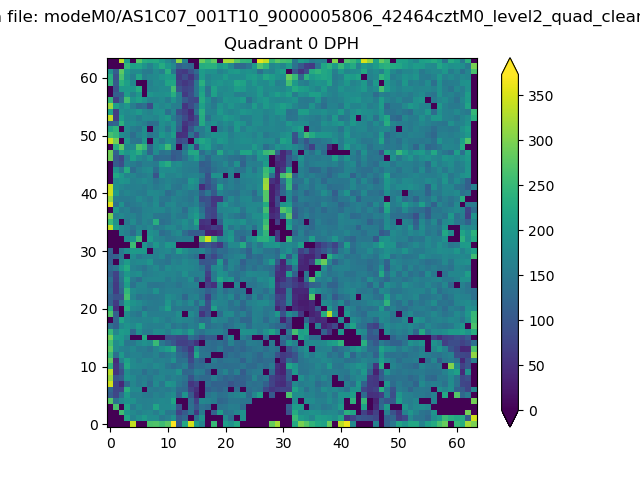 |
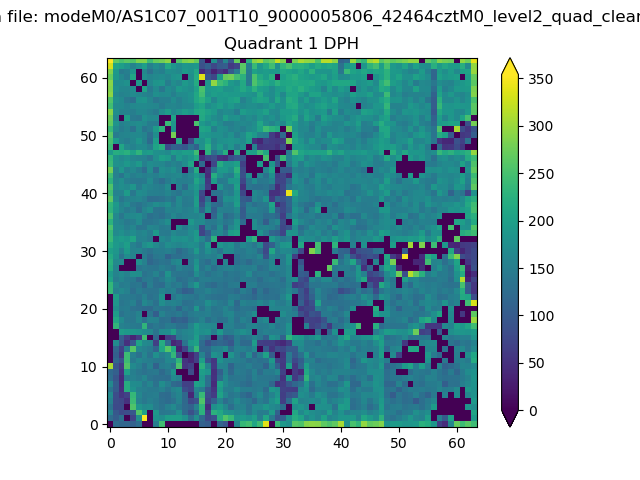 |
Quadrant B |
|---|---|---|---|
| Quadrant D | 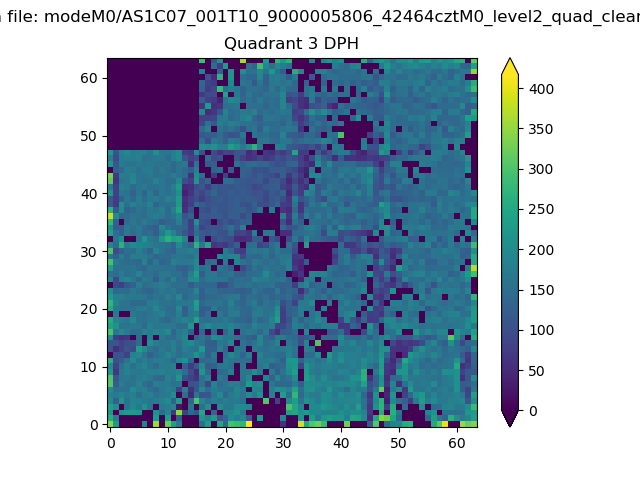 |
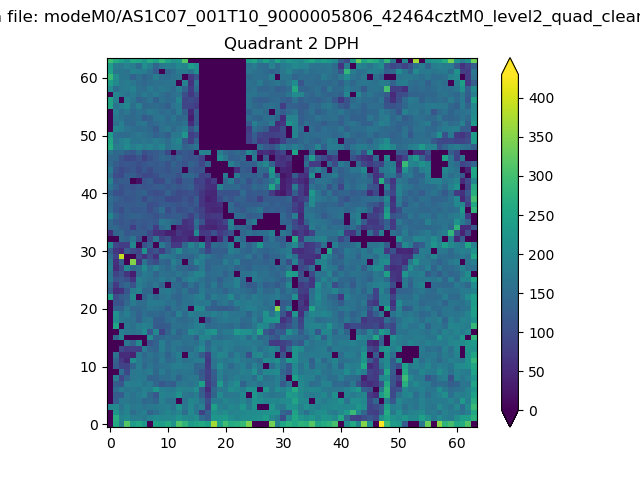 |
Quadrant C |
| Plot type | Count rate plots | Images |
|---|---|---|
| Comparison with Poisson distribution Blue bars denote a histogram of data divided into 1 sec bins. Red curve is a Poisson curve with rate = median count rate of data. |
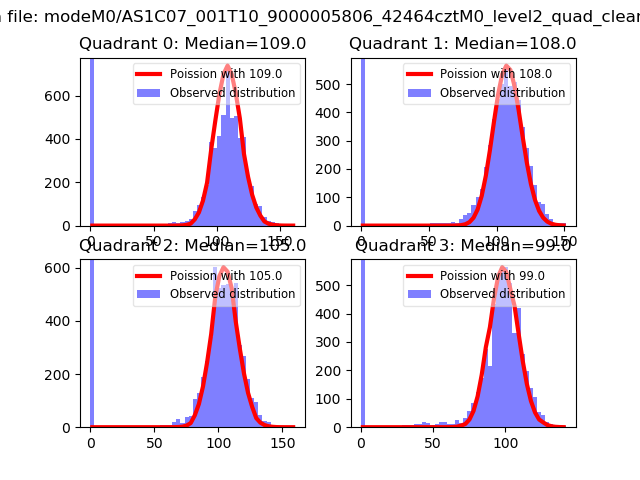 |
 |
| Quadrant-wise count rates Data is divided into 100 sec bins |
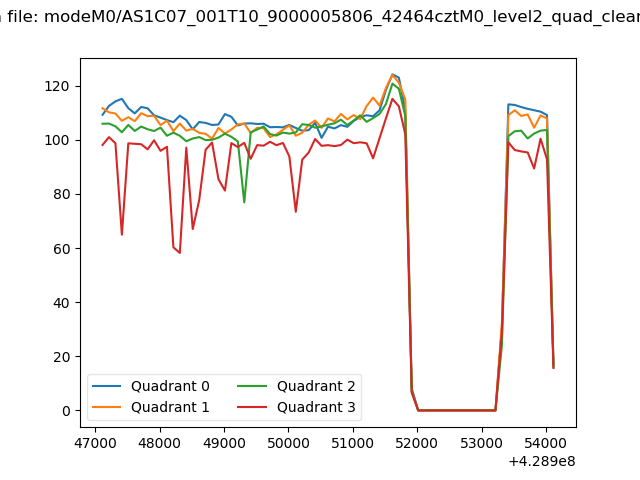 |
|
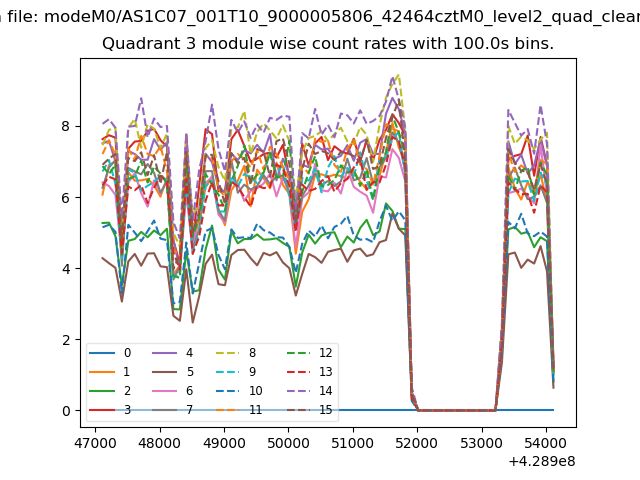
| Module-wise count rates for Quadrant A Data is divided into 100 sec bins |
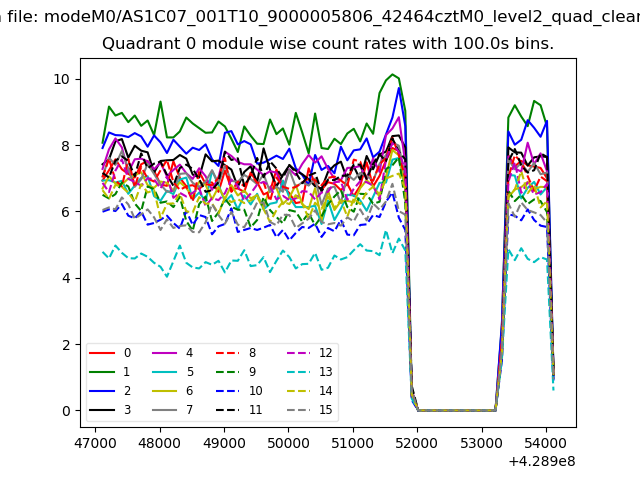 |
 |
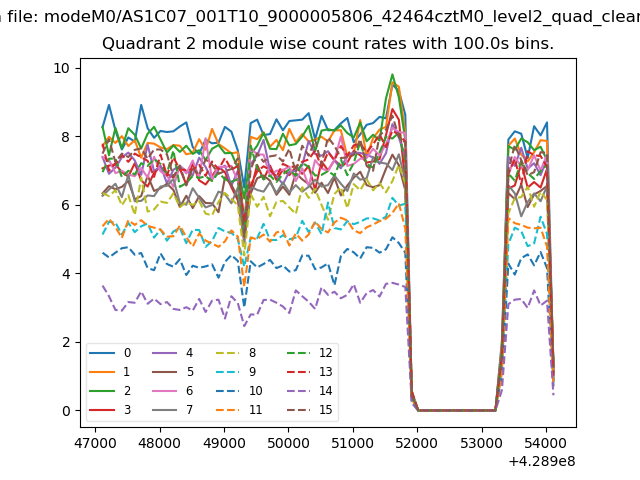
| Module-wise count rates for Quadrant B Data is divided into 100 sec bins |
 |
 |
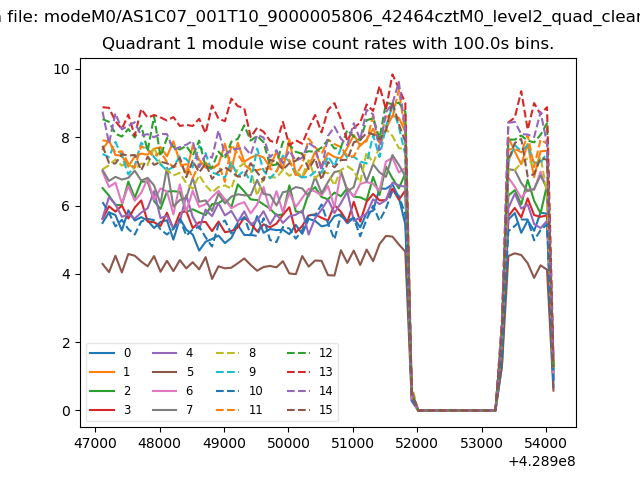
| Module-wise count rates for Quadrant C Data is divided into 100 sec bins |
 |
 |
| Module-wise count rates for Quadrant D Data is divided into 100 sec bins |
 |
 |
| Parameter | Plot |
|---|---|
| CZT HV Monitor | 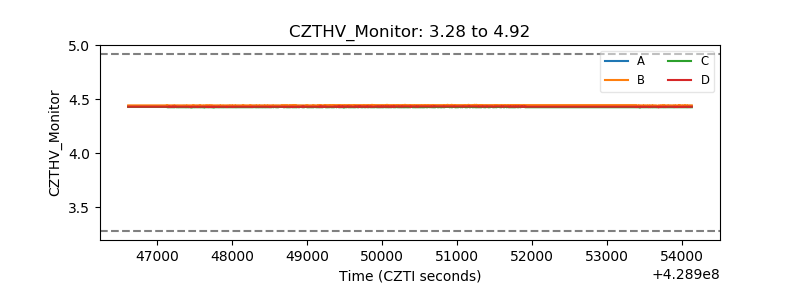 |
| D_VDD | 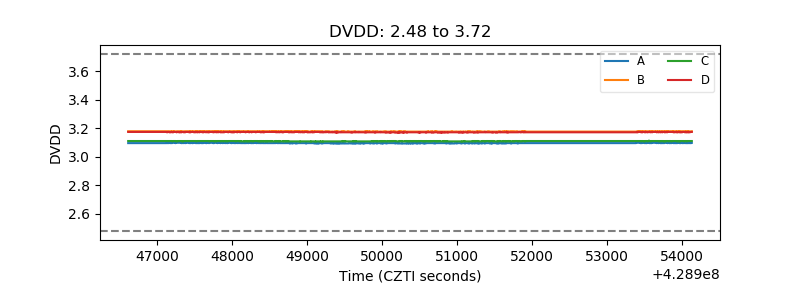 |
| Temperature 1 | 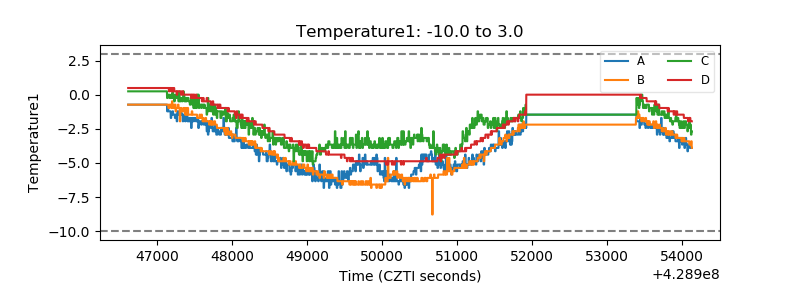 |
| Veto HV Monitor | 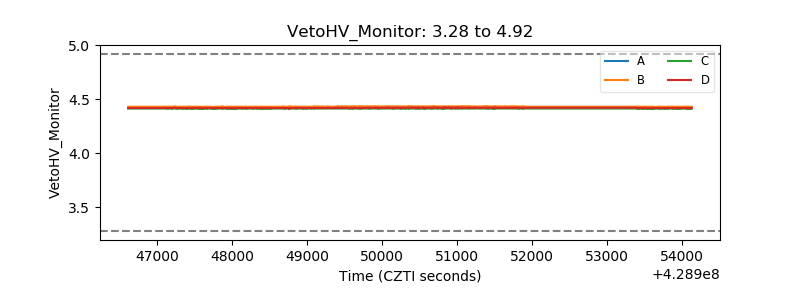 |
| Veto LLD | 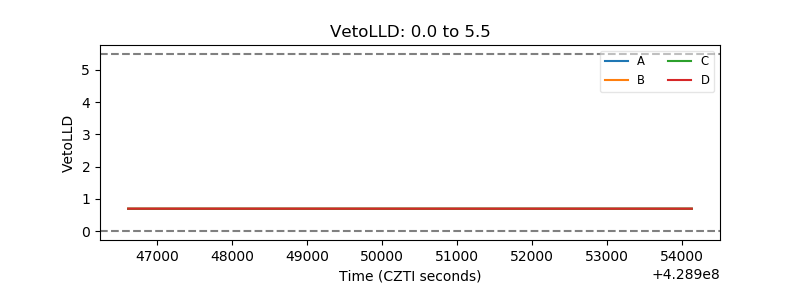 |
| Alpha Counter | 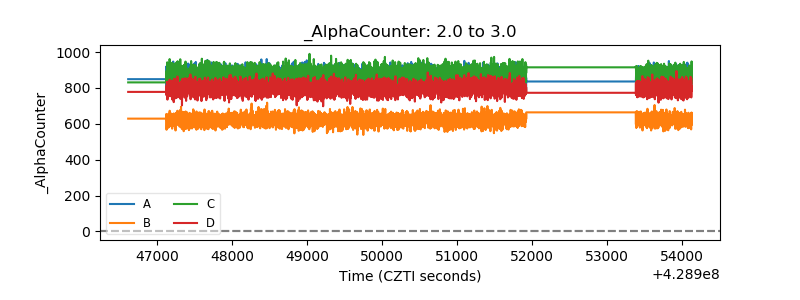 |
| _CPM_Rate | 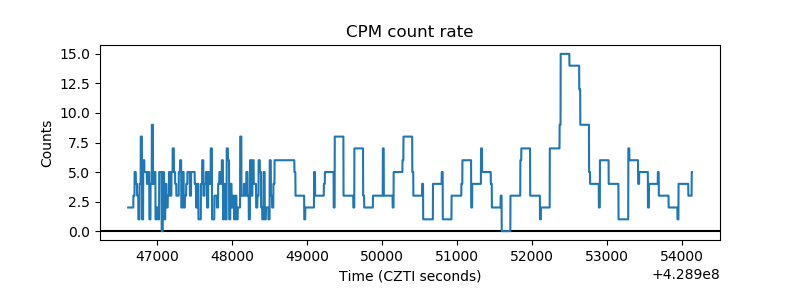 |
| CZT Counter | 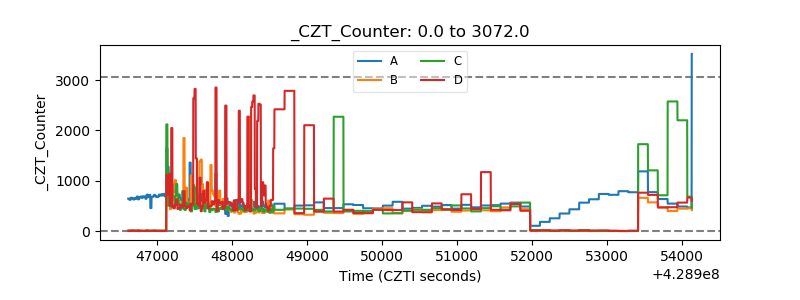 |
| +2.5 Volts monitor | 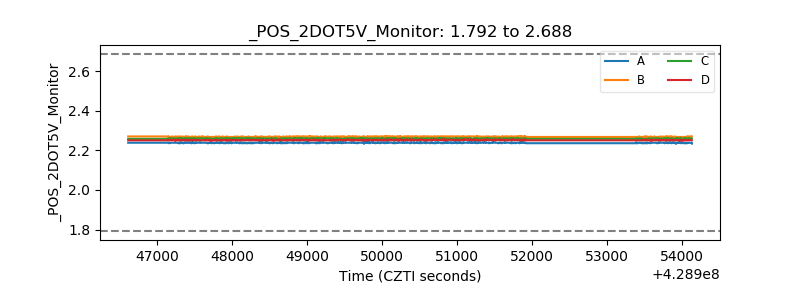 |
| +5 Volts monitor | 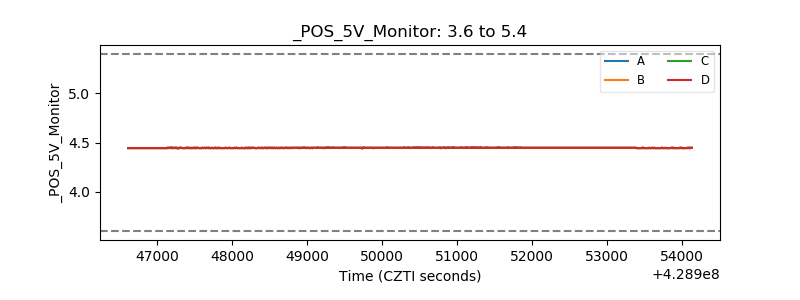 |
| _ROLL_ROT | 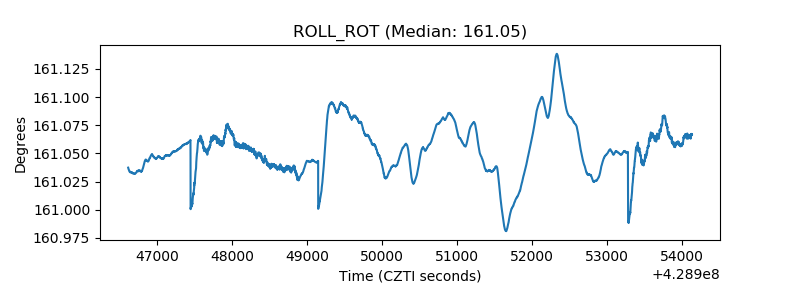 |
| _Roll_DEC |  |
| _Roll_RA | 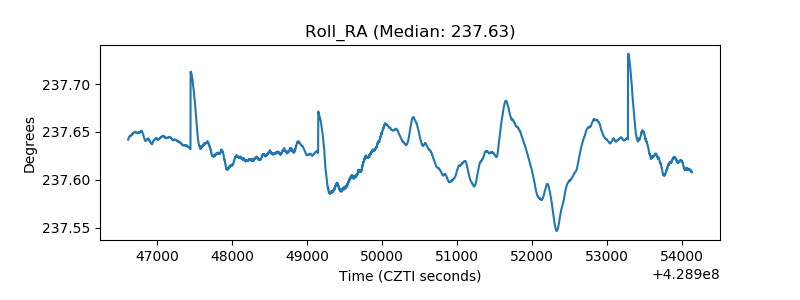 |
| Veto Counter | 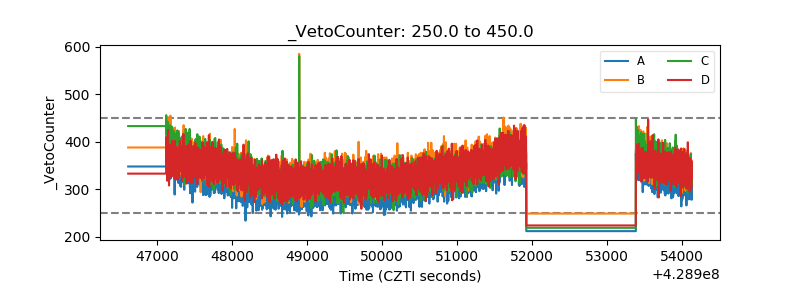 |